
4.4.2: Phylogeny and Cladistics
- Page ID
- 104505

Phylogeny and Cladistics
- Please read and watch the following Mandatory Resources
- Reading the material for understanding, and taking notes during videos, will take approximately 3 hours.
- Optional Activities are embedded.
- To navigate to the next section, use the Contents menu at the top of the page OR the right arrow on the side of the page.
- If on a mobile device, use the Contents menu at the top of the page OR the links at the bottom of the page.
- Explain the purpose of cladistics
- Design a cladogram
- Recognize and interpret a phylogenetic tree
- Explain a phylogenetic tree's components and purpose
Introduction to Phylogeny
All life on Earth evolved from a common ancestor. Biologists map how organisms are related by constructing phylogenetic trees. Phylogenetic trees are diagrams used to reflect evolutionary relationships among organisms or groups of organisms. In other words, a “tree of life” can be constructed to illustrate when different organisms evolved and to show the relationships among different organisms, as shown in Figure \(\PageIndex{1}\). Notice that from a single point, the three domains of Archaea, Bacteria, and Eukarya diverge and then branch repeatedly. The small branch that plants and animals (including humans) occupy in this diagram shows how recently these groups had their origin compared with other groups. A phylogeny is the evolutionary history and the relationships among a species or group of species. The study of organisms with the purpose of deriving their relationships is called systematics.

Understanding Phylogeny
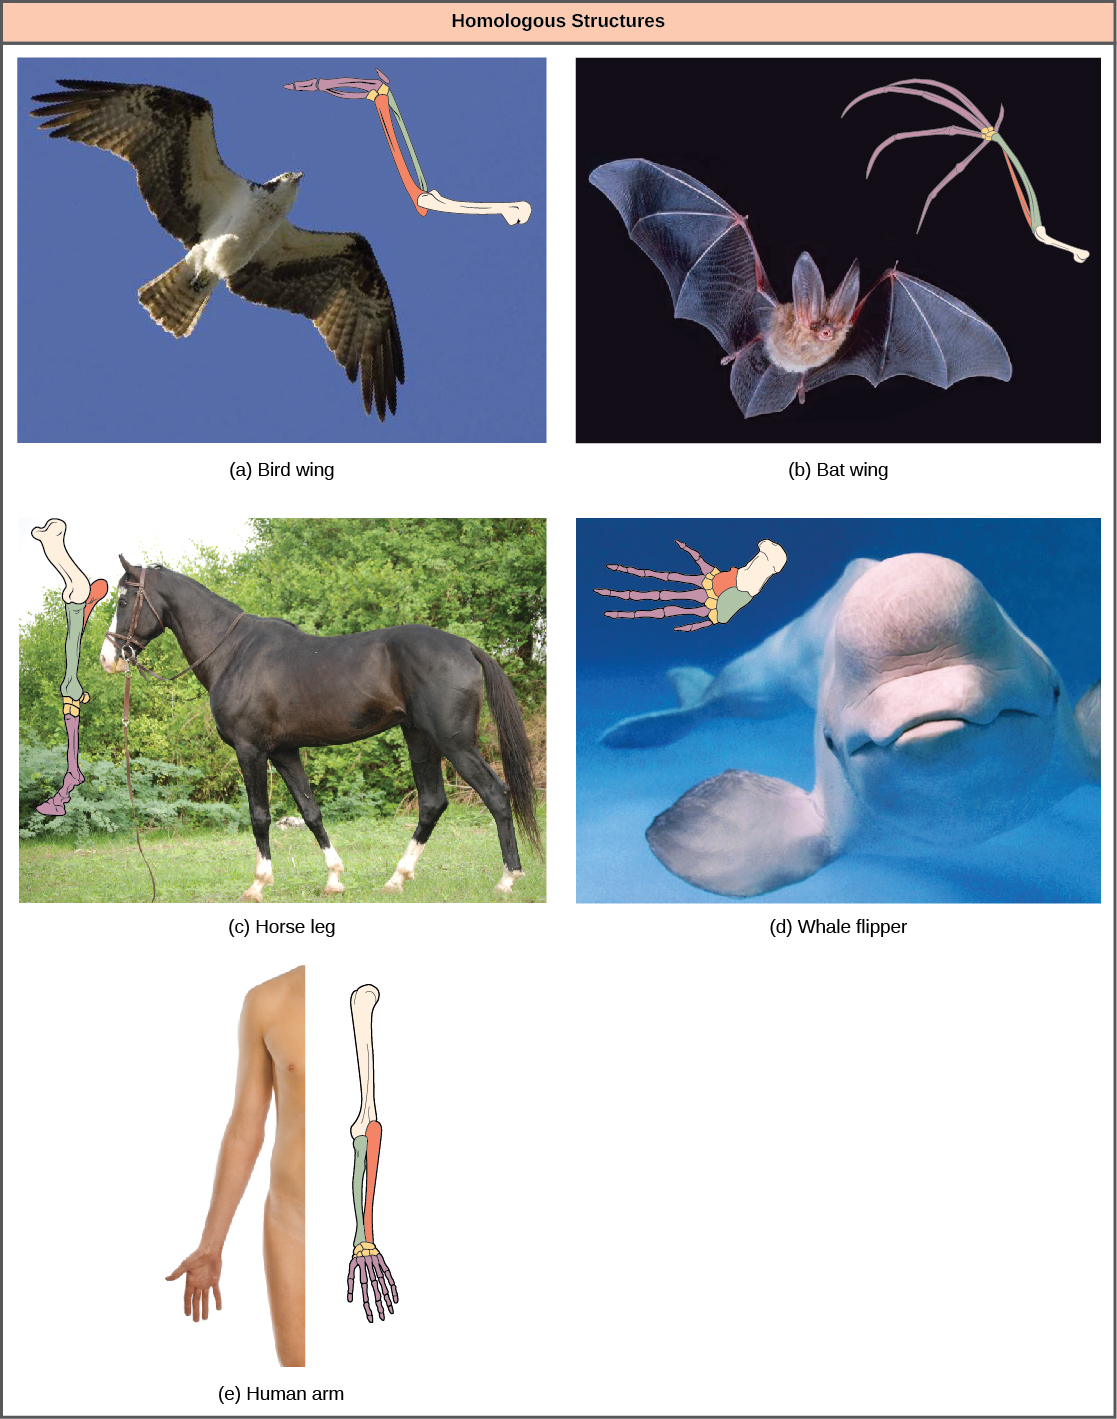
Two Measures of Similarity
Organisms that share similar physical features and genetic sequences tend to be more closely related than those that do not. Features that overlap both morphologically and genetically are referred to as homologous structures; the similarities stem from common evolutionary paths. For example, as shown in Figure \(\PageIndex{2}\), the bones in the wings of bats and birds, the arms of humans, and the foreleg of a horse are homologous structures. Notice the structure is not simply a single bone, but rather a grouping of several bones arranged in a similar way in each organism even though the elements of the structure may have changed shape and size.
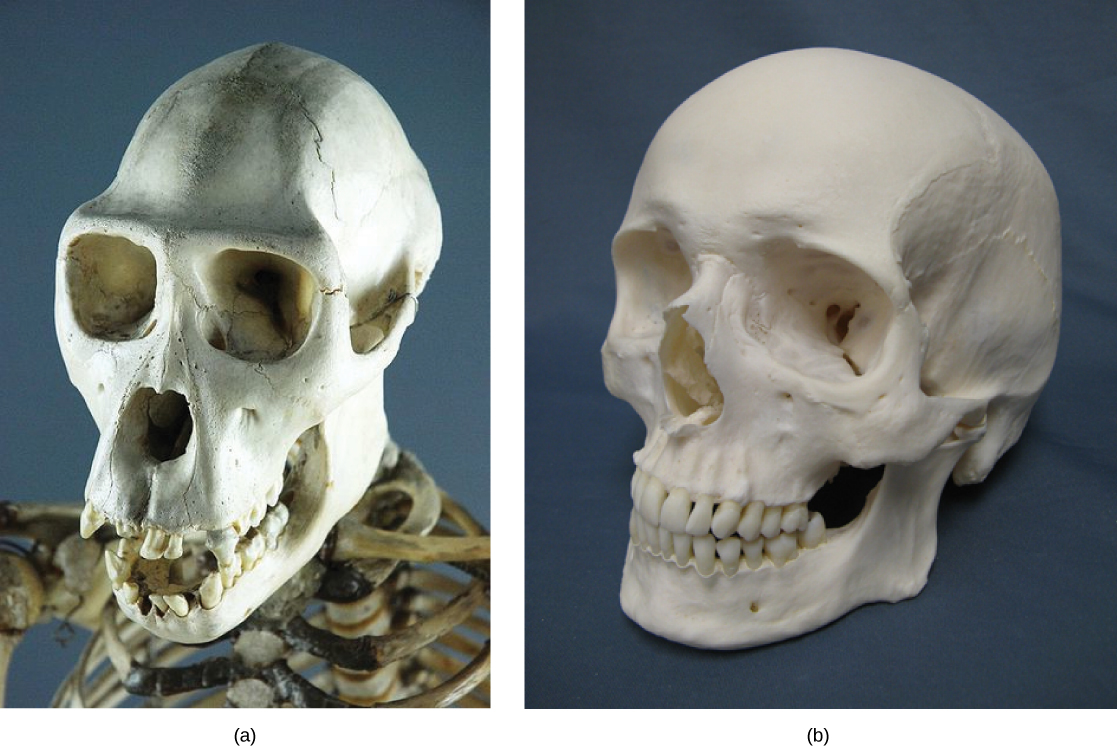
Misleading Appearances
Some organisms may be very closely related, even though a minor genetic change caused a major morphological difference to make them look quite different. For example, chimpanzees and humans, the skulls of which are shown in Figure \(\PageIndex{3}\) are very similar genetically, sharing 99 percent1 of their genes. However, chimpanzees and humans show considerable anatomical differences, including the degree to which the jaw protrudes in the adult and the relative lengths of our arms and legs.
However, unrelated organisms may be distantly related yet appear very much alike, usually because common adaptations to similar environmental conditions evolved in both independently. An example is the streamlined body shapes, the shapes of fins and appendages, and the shape of the tails in fishes (which are from the fish taxon) and whales (which are from the mammal taxon). These structures bear superficial similarity because they are adaptations to moving and maneuvering in the same environment—water. When a characteristic that is similar occurs by adaptive convergence (convergent evolution), and not because of a close evolutionary relationship, it is called an analogous structure.
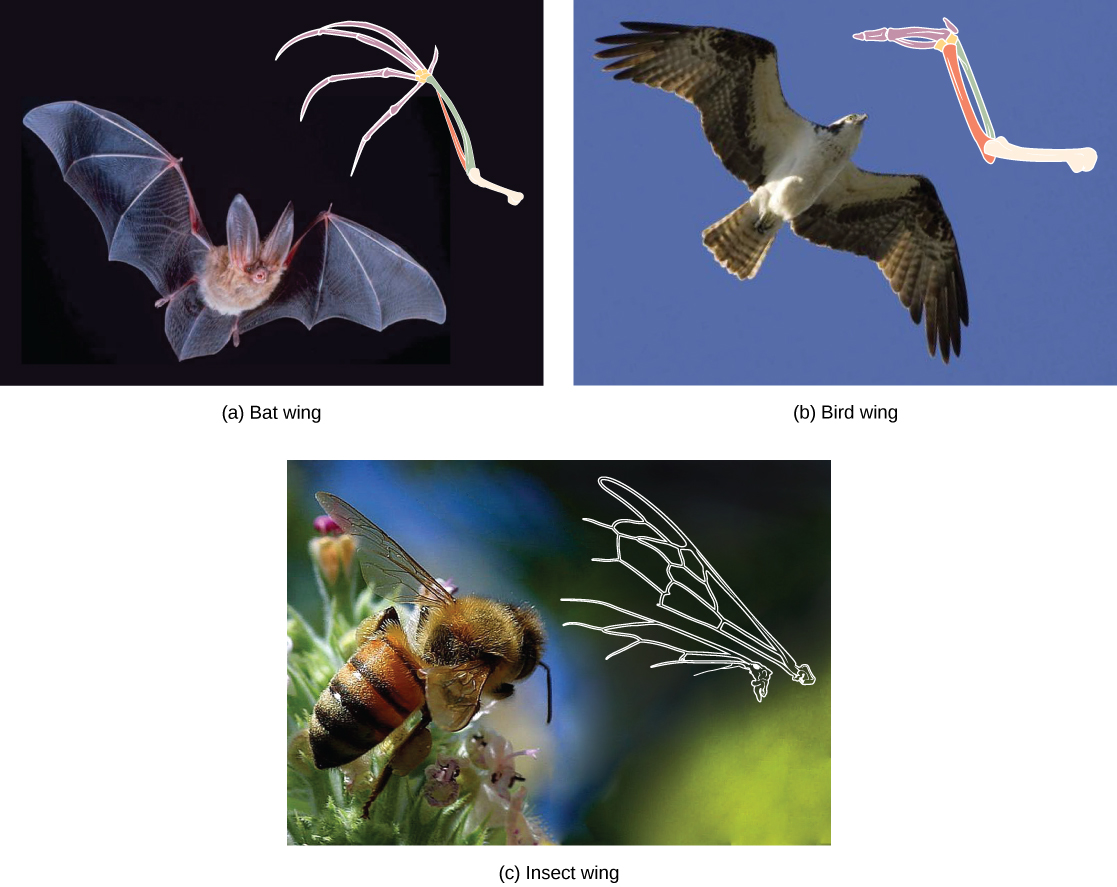
In another example, insects use wings to fly like bats and birds. We call them all wings because they perform the same function and have a superficially similar form, but the embryonic origin of the three wings is different. The difference in the development, or embryogenesis, of the wings in each case is a signal that insects versus bats or birds do not share a common ancestor that had a wing. The wing structures, shown in Figure \(\PageIndex{4}\) evolved independently in the two lineages (insects versus vertebrates).
Similar traits can be either homologous or analogous. Homologous traits share an evolutionary path that led to the development of that trait. Analogous traits may look similar but they do not share a common evolutionary origin. Scientists must determine which type of similarity a feature exhibits to decipher the phylogeny of the organisms being studied.
Which statement about analogies is correct?
- They occur only as errors.
- They are synonymous with homologous traits.
- They are derived due to similar environmental constraints.
- They are a form of mutation.
- Answer
-
c. They are derived due to similar environmental constraints.
Molecular Comparisons
With the advancement of DNA technology, the area of molecular systematics, which describes the use of information on the molecular level including DNA sequencing, has blossomed. New analysis of molecular characters not only confirms many earlier classifications, but also uncovers previously made errors based on morphology alone. Molecular characters can include differences in the amino-acid sequence of a protein, shapes of a protein, RNA, location of a gene, differences in the individual nucleotide sequence of a gene, or differences in the arrangements of genes. Phylogenies based on molecular characters assume that the more similar the sequences are in two organisms, the more closely related they are. Different genes change evolutionarily at different rates and this affects the level at which they are useful at identifying relationships. Rapidly evolving sequences are useful for determining the relationships among closely related species. More slowly evolving sequences are useful for determining the relationships between distantly related species. To determine the relationships between very different species such as Eukarya and Archaea, the genes used must be very ancient, slowly evolving genes that are present in both groups, such as the genes for ribosomal RNA. Comparing phylogenetic trees using different sequences and finding them similar helps to build confidence in the inferred relationships.
Sometimes two segments of DNA in distantly related organisms randomly share a high percentage of bases in the same locations, causing these organisms to appear closely related when they are not. For example, the fruit fly shares 60 percent of its DNA with humans.2 These similar sections are those that make fruit flies and humans both eukaryotes and animals. This 60 percent is important but does not tell us as much about why we are different. In this situation, computer-based statistical algorithms have been developed to help identify how far back our common ancestor was, which is difficult, if not impossible with morphology alone. Ultimately, the coupled use of both morphologic and molecular information is most effective in determining phylogeny.
This Click and Learn describes the process of aligning DNA sequences from different organisms so that they can be compared to one another: https://media.hhmi.org/biointeractive/click/Phylogenetic_Trees/01.html
To navigate this resource, use the forward and back arrows at the top right of the webpage. There will be short videos on most pages. Click on the Play symbol (arrow in a rectangle) to play the video.
This 12.5-minute video discusses some interesting phylogenetic mysteries.
Question after watching: Of the three cases featured, which one helped you understand phylogeny better?
Classification and Phylogeny
Scientists use phylogenetic trees to show the evolutionary pathways and relationships between organisms. The hierarchical classification of groups nested within more inclusive groups is reflected in diagrams. Scientists consider phylogenetic trees to be a hypothesis of the evolutionary past because one cannot go back through time to confirm the proposed relationships. Unlike taxonomy, a phylogenetic tree can be read like a map of evolutionary history.
Scientists apply the concept of maximum parsimony, which states that the likeliest order of events is the simplest shortest path. For evolutionary events, this would be the path with the least number of major divergences that correlate with the evidence.
Recent genetic analysis and other advancements have found that some earlier taxonomic classifications do not reflect actual evolutionary relationships, and therefore, changes and updates must be made as new discoveries take place. Recall that phylogenetic trees are hypotheses and are modified as data becomes available. In addition, classification historically has focused on grouping organisms mainly by shared characteristics and does not necessarily illustrate how the various groups relate to each other from an evolutionary perspective. For example, despite the fact that a hippopotamus resembles a pig more than a whale, the hippopotamus may be the closest living relative to the whale. One dramatic and recent example was the breaking apart of prokaryotic species which, until the 1970s, were all classified as 'bacteria'. Their division into Archaea and Bacteria came about after the recognition that their large genetic differences warranted their separation into two of three fundamental Domains of life.
Phylogenetic Trees
The phylogenetic tree in Figure \(\PageIndex{1}\) illustrates the pathway of evolutionary history. The pathway can be traced from the origin of life to any individual species by navigating through the evolutionary branches between the two points. Also, by starting with a single species and tracing backward to any branch point, the organisms related to it by various degrees of relatedness can be identified.
Many phylogenetic trees have a single branch point at the base representing a common ancestor of all the branches in the tree. This is known as a rooted tree. The branching from that root indicates evolutionary relationships as in Figure \(\PageIndex{6}\). The point where a split occurs, called a branch point or "node", represents where a single lineage evolved into distinct new ones.
A lineage that evolved early from the root and remains unbranched is called basal taxon. When two lineages stem from the same node, they are called sister taxa. A node with more than two lineages is called a polytomy and serves to illustrate where scientists have not definitively determined all relationships. It is important to note that while sister taxa or polytomy share an ancestor, this does not mean that one taxon evolved from the other. The branch point, or split, represents a common ancestor that existed in the past, but that no longer exists. Organisms in two taxa may have split apart at a specific node, but neither taxon gave rise to the other.
Rooted phylogenetic trees can serve as a pathway to understanding evolutionary history. The pathway can be traced from the origin of life to any individual species by navigating through the evolutionary branches between the two points. Also, by starting with a single species and tracing back towards the “trunk” of the tree, one can discover that species’ ancestors, as well as where lineages share a common ancestry. In addition, the tree can be used to study entire groups of organisms.
Another point to mention on phylogenetic tree structure is that rotation at nodes does not change the information Figure \(\PageIndex{7}\). For example, if a node was rotated and the taxon order changed, this would not alter the information because the evolution of each taxon from the node was independent of the other.
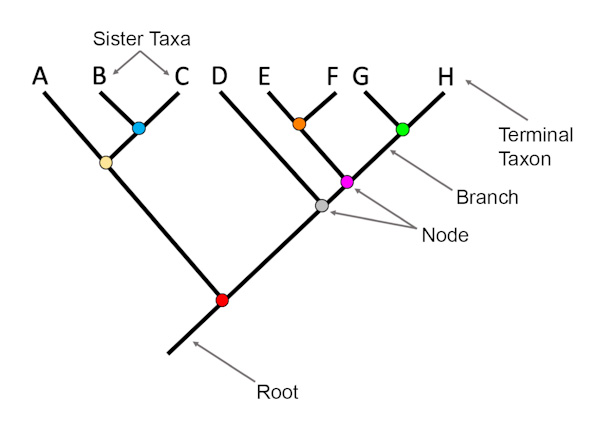
Figure \(\PageIndex{6}\): Parts of a phylogenetic tree, including terminal taxa, sister taxa, root, branch, and node. Image by Jonathan R. Hendricks (CC-BY-SA 4.0).
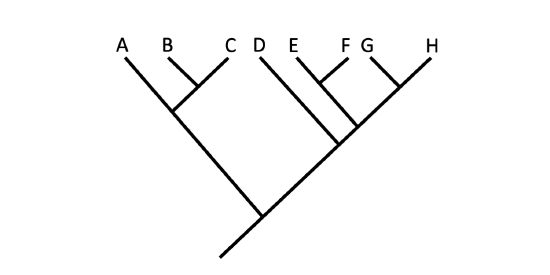
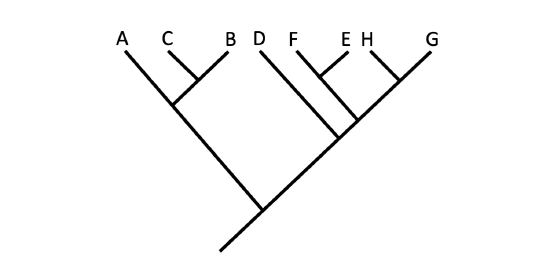
Figure \(\PageIndex{7}\): Branches may be rotated about nodes without any change in the hypothesized relationships depicted on a tree diagram. There is no difference in the evolutionary relationships being depicted between these two trees. Images by Jonathan R. Hendricks (CC-BY-SA 4.0).
This 8-minute video explains phylogenetics.
Question after watching: Which big cat is most closely related to the cheetah?
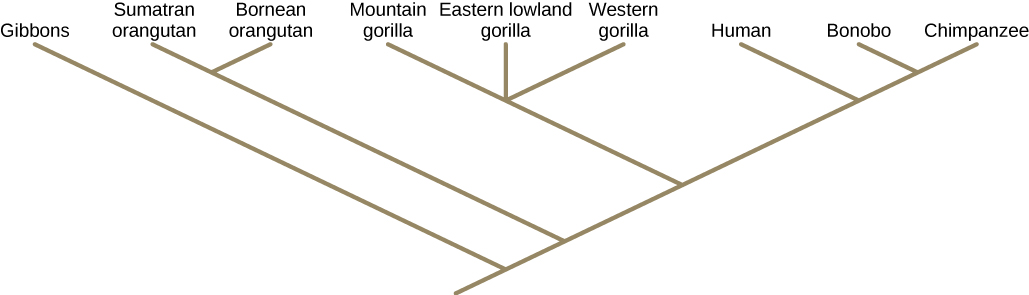
Figure \(\PageIndex{8}\) is a rooted tree for the modern great apes. The two species of orangutans are sister taxa. The three branches leading to the gorilla subspecies are a polytomy. The names of the species that are at the tip of the branches are co-existing species at the current time. The common ancestor that gave rise to two currently existing species was neither of these current species, but rather an ancestral species to both that no longer exists. For example, humans did not evolve from bonobos or chimpanzees (nor did chimpanzees evolve from humans) although they are our closest living relatives. Humans, bonobos, and chimpanzees all evolved from a common ancestor that lived, scientists believe, six million years ago and looked different from modern chimpanzees, bonobos, AND humans.
The nodes and the branches in phylogenetic tree structure imply evolutionary change. Sometimes significant adaptive changes are identified on a branch or node. For example, in Figure \(\PageIndex{9}\), the node that gives rise to the mammal and reptile lineage from the frog lineage shows the origin of the amniotic egg character. Also, the node that gives rise to organisms with legs is indicated as the common ancestor of mammals, reptiles, amphibians, and jawed fishes.
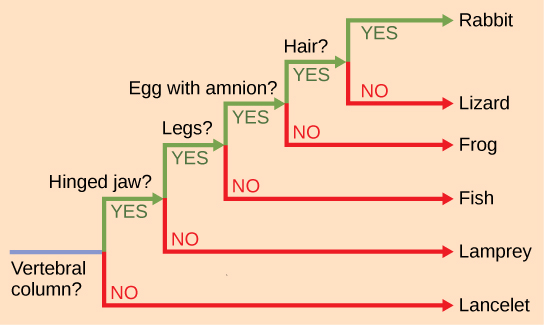
Figure \(\PageIndex{9}\): This phylogenetic tree is rooted by an organism that lacked a vertebral column. At each branch point, organisms with different characters are placed in different groups.
Understanding Phylogenetic Trees
One of the most common forms of a phylogenetic tree is a cladogram, seen in Figures \(\PageIndex{10}\) and \(\PageIndex{11}\). To begin this diagram, scientists often organize the homologous and analogous traits of various organisms using a system called cladistics. This system sorts organisms into clades: groups of organisms that descended from a single ancestor. For example, all organisms in the orange region in Figure \(\PageIndex{10}\) evolved from a single ancestor that had amniotic eggs. Consequently, all these organisms also have amniotic eggs and make a single clade, also called a monophyletic group. Clades must include all descendants from a branch point.

Clades can vary in size depending on which branch point is being referenced. The important factor is that all organisms in the clade or monophyletic group stem from a single point on the tree. This can be remembered because monophyletic breaks down into “mono,” meaning one, and “phyletic,” meaning evolutionary relationship. Notice in the examples of clades how each clade comes from a single point, whereas the non-clade groups show branches that do not share a single point.
On a phylogenetic tree, which term refers to lineages that diverged from the same place?
- sister taxa
- basal taxa
- rooted taxa
- dichotomous taxa
- Answer
-
a. sister taxa
Which animals in the phylogenetic tree in Figure \(\PageIndex{10}\) belong to a clade that includes animals with hair? Which evolved first: hair or the amniotic egg?
- Answer
-
Rabbits and humans belong in the clade that includes animals with hair. The amniotic egg evolved before hair, because the Amniota clade branches off earlier than the clade that encompasses animals with hair.
This 10-minute video is the first part of a sequence that describes how cladograms are created.
Question after watching:
How does science represent the relationships between organisms?
Cladistics and Shared Characteristics
Organisms evolve from common ancestors and then diversify. Scientists use the phrase “descent with modification” because even though related organisms have many of the same characteristics and genetic codes, changes occur.
This pattern repeats as one goes through the phylogenetic tree of life:
- A change in the genetic makeup of an organism leads to a new trait that becomes prevalent in the group.
- Many organisms descend from this point and have this trait.
- New variations continue to arise: some are adaptive and persist, leading to new traits.
- With new traits, a new branch point is determined (go back to step 1 and repeat).
Cladistics rests on three assumptions.
- Living things are related by descent from a common ancestor, which is a general assumption of evolution.
- Speciation occurs by splits of one species into two, never more than two at a time, and at one point in time. This is a simplification but is accepted by most biologists.
- Traits change enough over time to be considered to be in a different state.
It is also assumed that one can identify the direction of change for an adaptation. In other words, we assume that an amniotic egg is a later character state than non-amniotic eggs. We know this by reference to a group outside the clade: for example, insects have non-amniotic eggs; therefore, this is the older or ancestral character state.
Cladistics compares ingroups and outgroups. An ingroup (lizard, rabbit and human in our example) is the group of taxa being analyzed in Figure \(\PageIndex{10}\). An outgroup (lancelet, lamprey and fish in our example) is a species or group of species that diverged before the lineage containing the group(s) of interest. By comparing ingroup members to each other and to the outgroup members, we can determine which characteristics are evolutionary adaptations determining the branch points of the ingroup’s phylogeny.
If a characteristic is found in all members of a group, it is a shared ancestral character: there has been no change in the adaptation during the descent of each member of the clade. Although these traits appear interesting because they unify the clade, in cladistics they are considered not helpful when we are trying to determine the relationships of the members of the clade because every member is the same. In contrast, consider the amniotic egg characteristic of Figure \(\PageIndex{10}\). Only some of the organisms have this trait; to those that do, it is called a shared-derived character because this trait derived at some point but does not include all of the ancestors in the tree. This character tells us about the relationships among the members of the clade; it tells us that lizards, rabbits, and humans group more closely together than any of these organisms do with fish, lampreys, and lancelets.
The tricky aspect to shared-ancestral and shared-derived characters is the fact that these terms are relative. The same trait could be either ancestral or derived depending on the diagram being used and the organisms being compared. Scientists find these terms useful when distinguishing between clades during the building of phylogenetic trees, but it is important to remember that their meaning depends on context.
In this 13-minute video, learn how biologists use genetic data to determine relationships among organisms.
Question after watching: Are fungi closest to plants or animals, in evolutionary terms? What is the evidence for this?

Figure \(\PageIndex{11}\): All the organisms within a clade stem from a single point on the tree. A clade may contain multiple groups, as in the case of animals, fungi, and plants, or a single group, as in the case of flagellates. Groups that diverge at a different branch point, or that do not include all groups in a single branch point, are not considered clades.
What is true about organisms that are a part of the same clade?
- They all share the same basic characteristics.
- They evolved from a shared ancestor.
- They usually fall into the same classification taxa.
- They have identical phylogenies.
- Answer
-
b. They evolved from a shared ancestor.
This 6.5-minute video describes clades and their representation on phylogenetic trees.
Question after watching: How can you distinguish between a taxon and a clade?
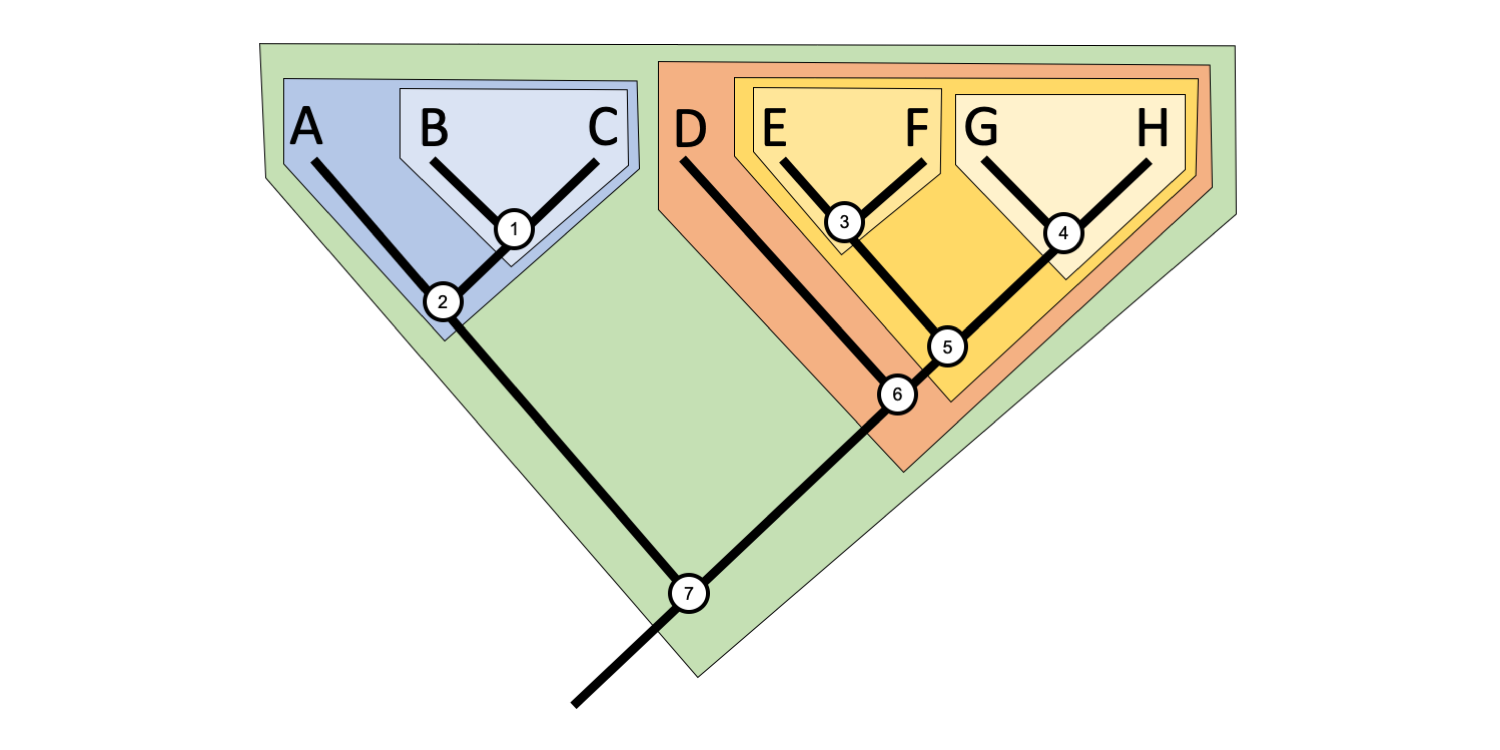
Clades are not mutually exclusive, but rather form nested sets on a tree. Thus, any given taxon can belong to many clades. For example, in the tree above, Taxon B belongs to three clades, a clade defined by Node 1, a more inclusive clade defined by Node 2, and an even more inclusive clade defined by Node 7. Taxon E belongs to four clades defined by Nodes 3, 5, 6, and 7, respectively.
Try to figure out how many clades Taxon A and Taxon H belong to, and determine which nodes define each clade. (Jonathan R. Hendricks; CC-BY-SA 4.0)
- Answer
-
Taxon A belongs to two clades and is defined by Node 2 and, more inclusively, Node 7. Taxon H belongs to four clades and is defined by Nodes (from least to most inclusive) 4, 5, 6, and 7.
Limitations of Phylogenetic Trees
It is easy to assume that more closely related organisms look more alike, and while this is often the case, it is not always true. If two closely related lineages evolved under significantly different surroundings or after the evolution of a major new adaptation, they may look quite different from each other, even more so than other groups that are not as closely related. For example, the phylogenetic tree in Figure \(\PageIndex{10}\) shows that lizards and rabbits both have amniotic eggs, whereas salamanders (within the frog lineage) do not. This means that evolutionarily, lizards and rabbits last shared a common ancestor more recently than lizards and salamanders. Superficially, however, lizards and salamanders appear more similar than lizards and rabbits.
Another aspect of phylogenetic trees is that, unless otherwise indicated, branches do not show length of time, they show only the order in time of evolutionary events. In other words, a long branch does not necessarily mean more time passed, nor does a short branch mean less time passed— unless specified on the diagram. For example, in Figure \(\PageIndex{9}\), the tree does not indicate how much time passed between the evolution of amniotic eggs and hair. What the tree does show is the order in which things took place. Again using Figure \(\PageIndex{9}\), the tree shows that the oldest trait is the vertebral column, followed by hinged jaws, and so forth. Remember that any phylogenetic tree is a part of the greater whole, and similar to a real tree, it does not grow in only one direction after a new branch develops. So, for the organisms in Figure \(\PageIndex{9}\), just because a vertebral column evolved does not mean that invertebrate evolution ceased, it only means that a new branch formed. Also, groups that are not closely related, but evolve under similar conditions, may appear more similar to each other than to a close relative.
Why Does Phylogeny Matter?
In addition to enhancing our understanding of the evolutionary history of species, our own included, phylogenetic analysis has numerous practical applications. Two of those applications include understanding the evolution and transmission of disease and making decisions about conservation efforts. A 2010 study3 of MRSA (methicillin-resistant Staphylococcus aureus), an antibiotic-resistant pathogenic bacterium, traced the origin and spread of the strain in the past 40 years. The study uncovered the timing and patterns in which the resistant strain moved from its point of origin in Europe to centers of infection and evolution in South America, Asia, North America, and Australasia. The study suggested that introductions of the bacteria to new populations occurred very few times, perhaps only once, and then spread from that limited number of individuals. This contrasts with the possibility that many individuals carried the bacteria from one place to another. This result suggests that public health officials should concentrate on quickly identifying the contacts of individuals infected with a new strain of bacteria to control its spread.
A second area of usefulness for phylogenetic analysis is in conservation. Biologists argue that it is important to protect species throughout a phylogenetic tree rather than just those from one branch of the tree. Doing this preserves more of the variation produced by evolution. This is important because genetic variation makes a species more robust to disruption by being more likely to have some individuals with the traits necessary to survive a change in the environment. For example, conservation efforts should focus on a single species without sister species rather than other species that have a cluster of close sister species that recently evolved. If a single evolutionarily distinct species goes extinct, a disproportionate amount of genetic variation from the tree will be lost compared to one species in a cluster of closely related species. Closely related species share more genetic information and, therefore, some of this genetic information will be retained in living organisms versus those who have no sister species.
A study published in 20074 made recommendations for the conservation of mammal species worldwide based on how evolutionarily distinct and at risk of extinction they are. The study found that their recommendations differed from priorities based on simply the level of extinction threat to the species. The study recommended protecting some threatened and valued large mammals such as the orangutans, the giant and lesser pandas, and the African and Asian elephants. But they also found that some much lesser-known species should be protected based on how evolutionary distinct they are. These include several rodents, bats, shrews, and hedgehogs. In addition, there are some critically endangered species that did not rate as very important in evolutionary distinctiveness including species of deer mice and gerbils. While many criteria affect conservation decisions, preserving phylogenetic diversity provides an objective way to protect the full range of diversity generated by evolution.
Choosing the Right Relationships
Constructing a phylogenetic tree, or cladogram, from the character data is a monumental task that is usually left up to a computer. The computer draws a tree such that all clades share the same list of derived characters. However, there are decisions to be made. For example, what if a species present in a clade is supported by all of the shared derived characters for that clade except one? One conclusion is that the trait evolved in the ancestor, but then changed back in that one species. Also, a character state that appears in two clades must be assumed to have evolved independently in those clades. These inconsistencies are common in trees drawn from character data and complicate the decision-making process about which tree most closely represents the real relationships among the taxa.
To aid in the tremendous task of choosing the best tree, scientists use maximum parsimony, which means they assume that events occurred in the simplest, most obvious way. This means that the “best” tree is the one with the fewest number of character reversals, the fewest number of independent character changes, and the fewest number of character changes throughout the tree. Computer programs search through all of the possible trees to find the small number of trees with the simplest evolutionary pathways.
Why do scientists apply the concept of maximum parsimony?
- to decipher accurate phylogenies
- to eliminate analogous traits
- to identify mutations in DNA codes
- to locate homoplasies
- Answer
-
a. to decipher accurate phylogenies
Footnotes
- 1 Gibbons, A. (2012, June 13). Science Now. Retrieved from news.sciencemag.org/scienceno...sequenced.html
- 2 Background on comparative genomic analysis. (2002, December). Retrieved from http://www.genome.gov/10005835
- 3 Harris, S.R. et al. 2010. Evolution of MRSA during hospital transmission and intercontinental spread. Science 327:469–474.
- 4 Isaac NJ, Turvey ST, Collen B, Waterman C, Baillie JE (2007) Mammals on the EDGE: Conservation Priorities Based on Threat and Phylogeny. PLoS ONE 2(3): e296. doi:10.1371/journal.pone.0000296