File:Nomogramm zum scheinbaren Einfallen nach Palmer.pdf
Jump to navigation
Jump to search

Size of this JPG preview of this PDF file: 430 × 599 pixels. Other resolutions: 172 × 240 pixels | 345 × 480 pixels | 551 × 768 pixels | 1,170 × 1,629 pixels.
Original file (1,170 × 1,629 pixels, file size: 165 KB, MIME type: application/pdf)
Captions
Captions
Add a one-line explanation of what this file represents
Summary[edit]
| Description |
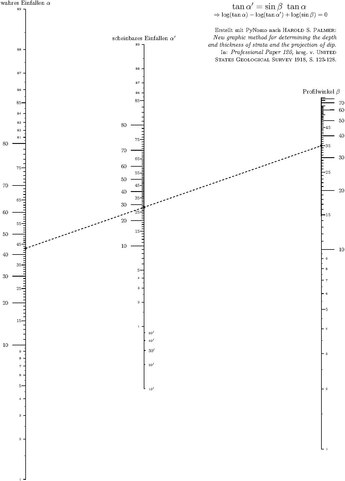
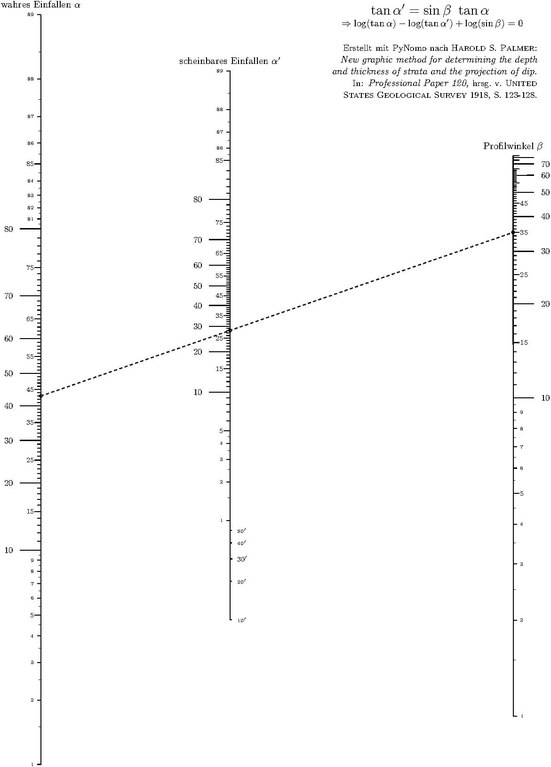
English: Created with PyNomo after Harold S. Palmer: New graphic method for determining the depth and thickness of strata and the projection of dip. In: Professional Paper 120, published by United States Geological Survey 1918, pp. 123-128.
Deutsch: Erstellt mit PyNomo nach Harold S. Palmer: New graphic method for determining the depth and thickness of strata and the projection of dip. In: Professional Paper 120, hrsg. v. United States Geological Survey 1918, S. 123-128. |
| Date | |
| Source | Own work |
| Author | Gallaiis |
Python code used to create this nomogram with PyNomo.
from pynomo.nomographer import *

N_params_1={
    'u_min':1.0,
    'u_max':89.0,
    'function':lambda u:log10(tan(u*pi/180.0)),
    'title':r'wahres Einfallen $\alpha$',
    'title_x_shift':0.0,
    'tick_levels':3,
    'tick_text_levels':2,
    'tick_side':'left',
    'extra_params':[
      {
        'u_min':1.0,
        'u_max':10.0,
        'tick_levels':4,
        'tick_text_levels':3,
      },
      {
        'u_min':80.0,
        'u_max':89.0,
        'tick_levels':4,
        'tick_text_levels':3,
      },
    ],
}

N_params_2={
    'u_min':0.5,
    'u_max':89.0,
    'function':lambda u:-log10(tan(u*pi/180.0)),
    'title':r'scheinbares Einfallen $\alpha^\prime$',
    'tick_levels':3,
    'tick_text_levels':2,
    'tick_side':'left',
    'extra_params':[
      {
        'u_min':(10.0/60.0),
        'u_max':(25.0/60.0),
        'scale_type':'manual line',
        'tick_side':'right',
        'grid_length_1':0.050,
        'manual_axis_data':{
          (10.0/60.0):r"\tiny $10'$",
          (20.0/60.0):r"\tiny $20'$",
        }
      },
      {
        'u_min':(25.0/60.0),
        'u_max':(35.0/60.0),
        'scale_type':'manual line',
        'tick_side':'right',
        'grid_length_1':0.070,
        'manual_axis_data':{
          (30.0/60.0):r"\scriptsize $30'$",
        }
      },
      {
        'u_min':(35.0/60.0),
        'u_max':1.0,
        'scale_type':'manual line',
        'tick_side':'right',
        'grid_length_1':0.050,
        'manual_axis_data':{
          (40.0/60.0):r"\tiny $40'$",
          (50.0/60.0):r"\tiny $50'$",
        }
      },
      {
        'u_min':1.0,
        'u_max':5.0,
        'tick_levels':4,
        'tick_text_levels':3,
      },
      {
        'u_min':85.0,
        'u_max':89.0,
        'tick_levels':4,
        'tick_text_levels':3,
      },
    ],
}

N_params_3={
    'u_min':1,
    'u_max':85.,
    'function':lambda u:log10(sin(u*pi/180.0)),
    'title':r'Profilwinkel $\beta$',
    'tick_levels':2,
    'tick_text_levels':0,
    'extra_params':[
      {
        'u_min':1.0,
        'u_max':10.0,
        'tick_levels':4,
        'tick_text_levels':3,
      },
      {
        'u_min':11.0,
        'u_max':20.0,
        'tick_levels':3,
        'tick_text_levels':2,
      },
      {
        'u_min':21.0,
        'u_max':50.0,
        'tick_levels':3,
        'tick_text_levels':2,
      },
      {
        'u_min':51.0,
        'u_max':65.0,
        'tick_levels':3,
        'tick_text_levels':1,
      },
      {
        'u_min':65.0,
        'u_max':70.0,
        'tick_levels':2,
        'tick_text_levels':1,
      },
    ],
}

block_1_params={
    'block_type':'type_1',
    'f1_params':N_params_1,
    'f2_params':N_params_2,
    'f3_params':N_params_3,
    'proportion':(6.25/9.35),
    'isopleth_values':[[43.0,'x',35.0]],
}

main_params={
    'filename':'Nomogramm_scheinbares_Einfallen_Palmer.pdf',
    'paper_height':27.0,
    'paper_width':17.0,
    'block_params':[block_1_params],
    'title_str':r'\Large $\tan\alpha^\prime=\sin\beta\ \tan\alpha$\par\
        \normalsize $\Rightarrow \log(\tan\alpha) - \log(\tan\alpha^\prime) + \log(\sin\beta) = 0$\par\
        \raggedright\small\vskip 0.3ex\
        Erstellt mit PyNomo nach H\scriptsize AROLD\small\ S.\ P\scriptsize ALMER\small:\
        \it New graphic method for determining the depth\
        and thickness of strata and the projection of dip.\rm\small\par\
        In: \it Professional Paper 120,\rm\small\ hrsg.\ v.\
        U\scriptsize NITED\small\ S\scriptsize TATES\small\
        G\scriptsize EOLOGICAL\small\ S\scriptsize URVEY\small\ 1918, S.\ 123-128.',
    'title_x':14.0,
}

Nomographer(main_params)
Licensing[edit]
I, the copyright holder of this work, hereby publish it under the following license:
This file is licensed under the Creative Commons Attribution-Share Alike 3.0 Unported license.
- You are free:
- to share – to copy, distribute and transmit the work
- to remix – to adapt the work
- Under the following conditions:
- attribution – You must give appropriate credit, provide a link to the license, and indicate if changes were made. You may do so in any reasonable manner, but not in any way that suggests the licensor endorses you or your use.
- share alike – If you remix, transform, or build upon the material, you must distribute your contributions under the same or compatible license as the original.
File history
Click on a date/time to view the file as it appeared at that time.
| Date/Time | Thumbnail | Dimensions | User | Comment | |
|---|---|---|---|---|---|
| current | 16:19, 9 August 2012 |  | 1,170 × 1,629 (165 KB) | Gallaiis (talk | contribs) |
You cannot overwrite this file.
File usage on Commons
The following page uses this file:
- File:Nomogramm zu scheinbaren Einfallen nach H. S. Palmer.pdf (file redirect)
File usage on other wikis
The following other wikis use this file:
- Usage on de.wikipedia.org