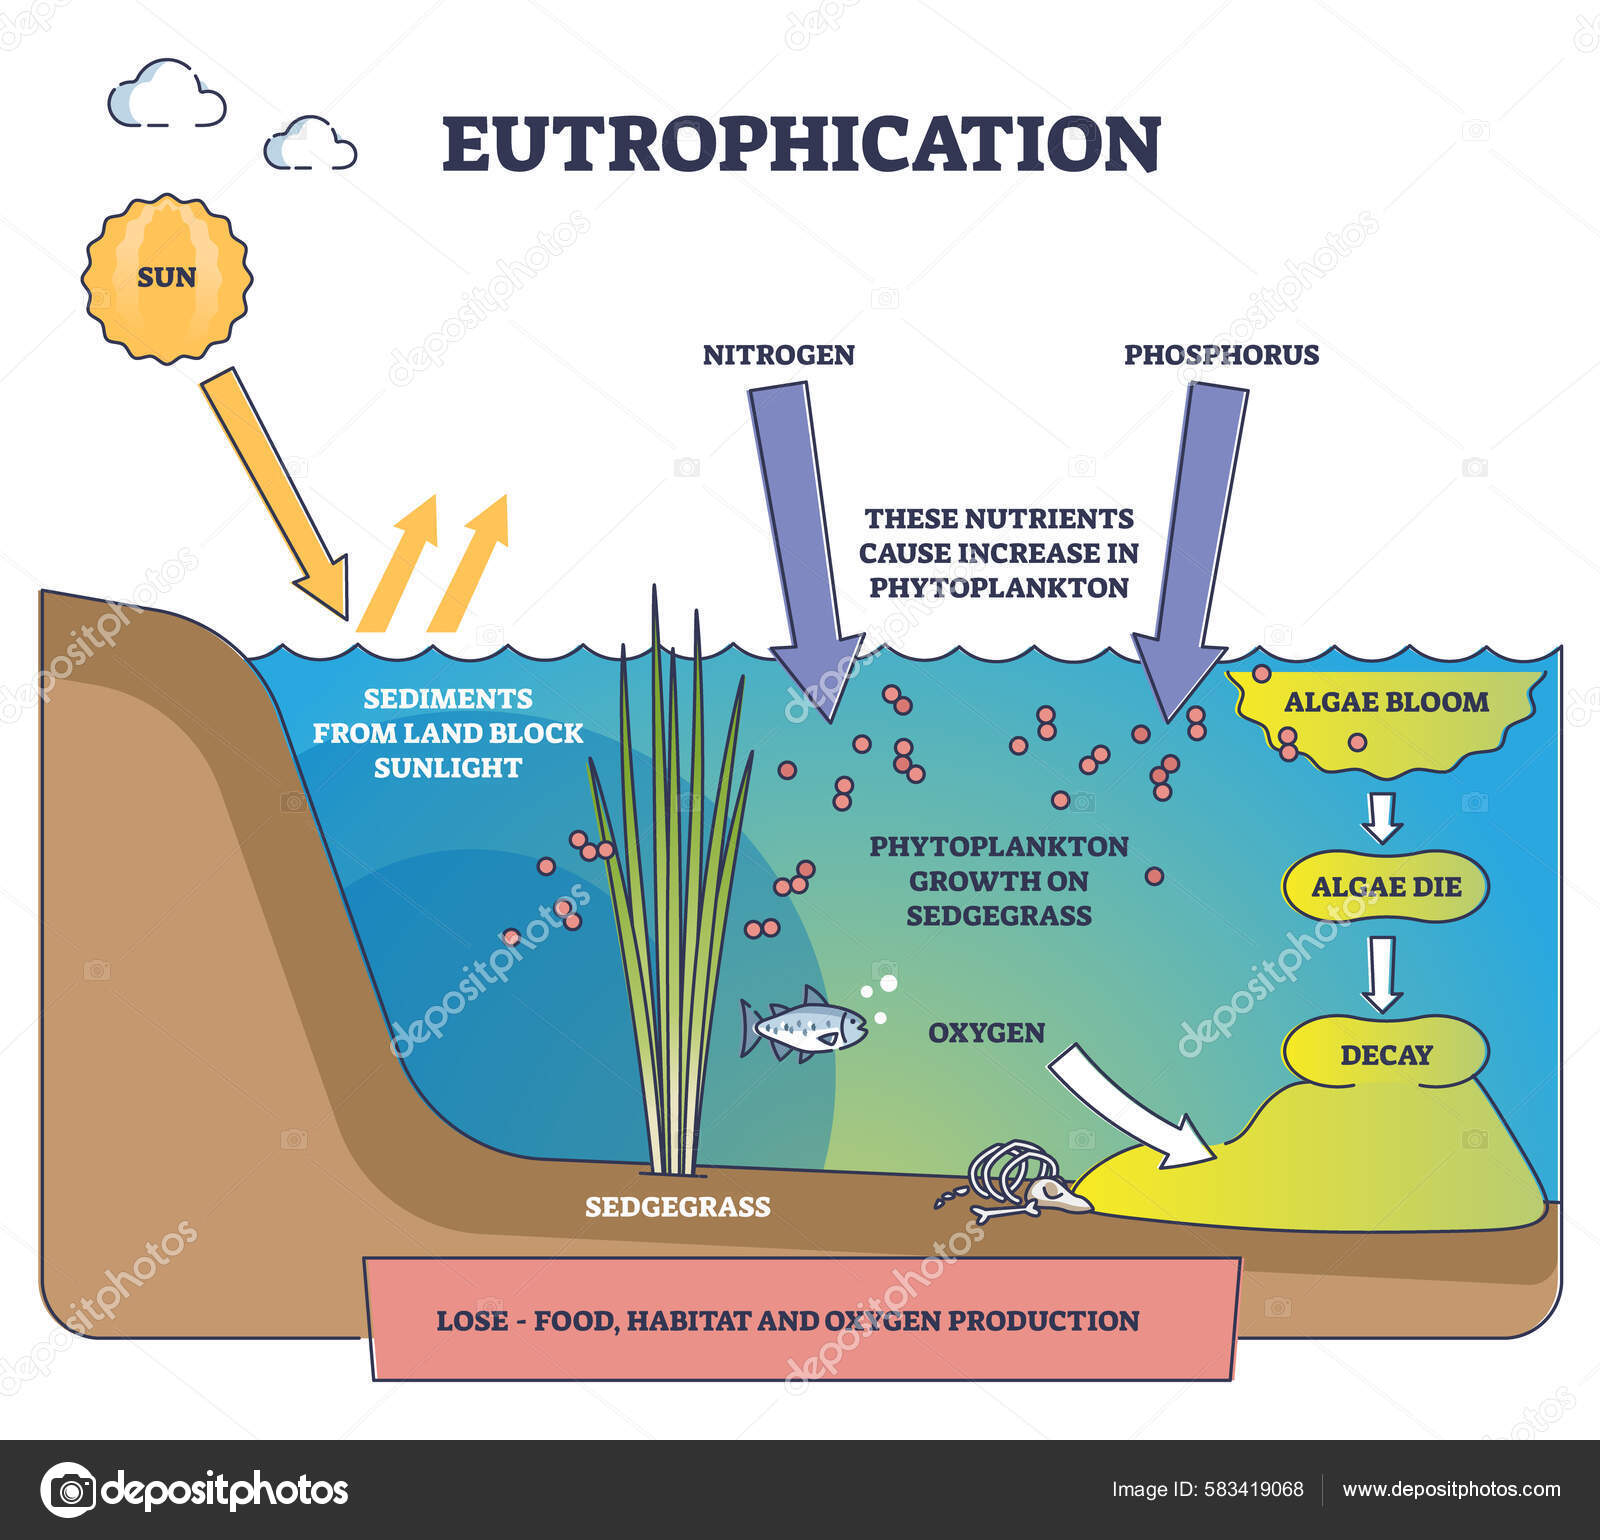
Eutrophication Process Explanation Water Pollution Stages Outline Diagram Labeled Educational — Stock Vector

Eutrophication process explanation and water pollution stages outline diagram. Labeled educational freshwater ecosystem contamination with nitrogen, phosphorus and algae bloom vector illustration. — Vector

Eutrophication process explanation and water pollution stages outline diagram. Labeled educational freshwater ecosystem contamination with nitrogen, phosphorus and algae bloom vector illustration.

 — Vector by VectorMine

Same Series:

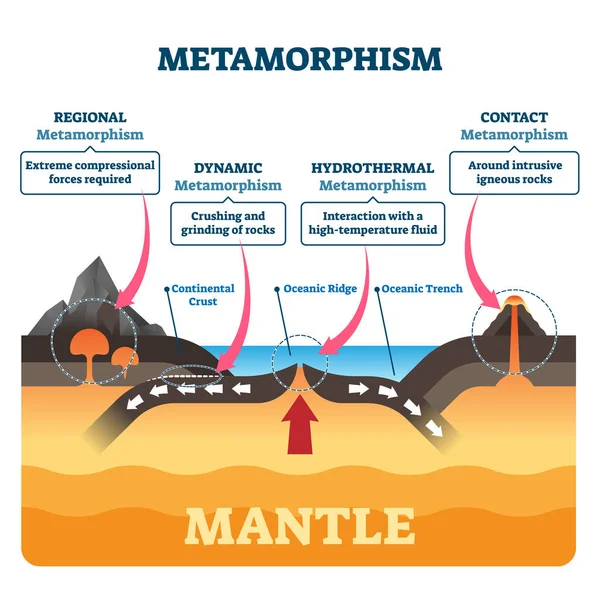
Metamorphism vector illustration. Labeled minerals geologic structure change process. Diagram with regional, dynamic, hydrothermal and contact forces. Tectonic volcano activity force types comparison
Metamorphism vector illustration. Labeled mineral geologic structure change — Stock Vector
Oxidative phosphorylation vector illustration. Labeled electron transport linked metabolism scheme. Educational diagram with cells use enzymes to oxidize nutrients process in explanation infographics.
Oxidative phosphorylation vector illustration. Labeled metabolism scheme. — Stock Vector
Photosynthesis biological vector illustration diagram with plan cell chloroplast kelvin cycle scheme. Conversion of light, water, carbon dioxide, oxygen and sugars.
Photosynthesis biological vector illustration diagram with plan cell scheme. — Stock Vector
Chloroplast vs mitochondria process educational scheme vector illustration. Labeled photosynthesis and cellular respiration interaction diagram. Graphic with green plant chemical formula or ATP energy
Chloroplast vs mitochondria process educational scheme vector illustration. — Stock Vector
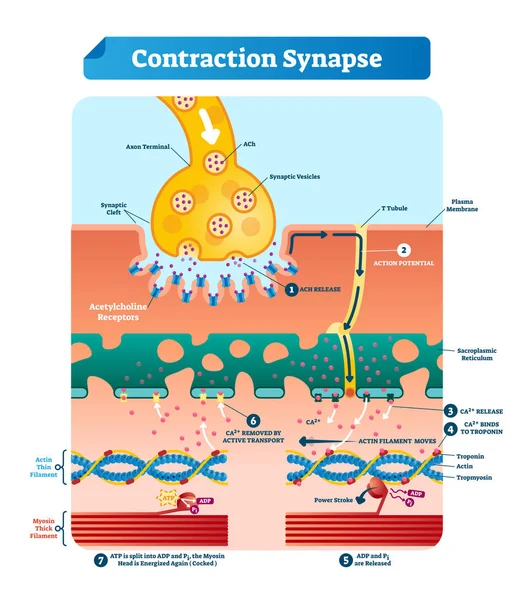
Contraction synapse vector illustration. Labeled closeup medical structure scheme. Diagram with full cycle of ACH release, action potential, troponin bonding and filament
Contraction synapse vector illustration. Labeled medical structure scheme. — Stock Vector
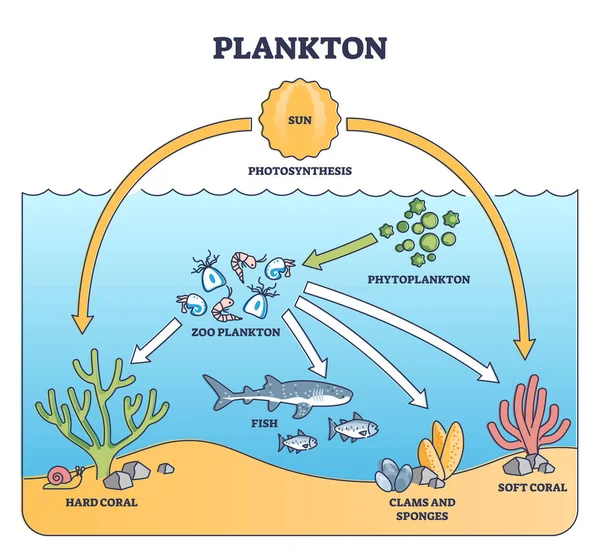
Plankton life and water organisms food chain role explanation outline diagram. Labeled educational underwater elements, like photoplankton, zoo fish, sponges, clams and corals vector illustration.
Plankton Life Water Organisms Food Chain Role Explanation Outline Diagram — Stock Vector
Western blot laboratory method for detecting specific protein molecules vector diagram. Illustrated scheme with stages of sampling, assembling device and connecting power supply to electrophoresis.
Western blot laboratory method for detecting specific proteins vector diagram — Stock Vector
Hydrophobic vs hydrophilic surface drop effect outline diagram. Labeled educational physical explanation with liquid contact angle and its tension force vector illustration. Water resistant material.
Hydrophobic vs hydrophilic surface effect on water drop outline diagram — Stock Vector
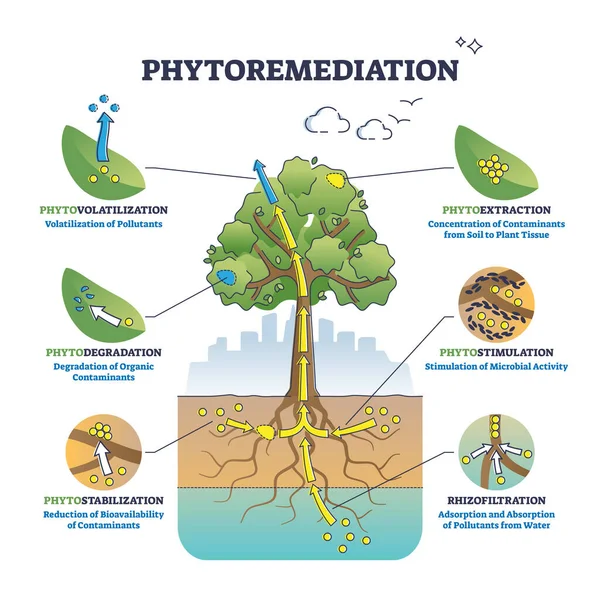
Phytoremediation as plant based approach for bioremediation outline diagram. Labeled educational soil and groundwater pollution solution scheme with tree usage to absorb pollutants vector illustration
Phytoremediation as plant based approach for bioremediation outline diagram — Stock Vector
Benthic zone in ocean as lowest and deepest ecological zone outline diagram. Labeled educational scheme with water body layers description and examples vector illustration. Pelagic geological division
Benthic zone in ocean as lowest and deepest ecological zone outline diagram — Stock Vector
Active vs passive transport vector illustration. Labeled educational cell scheme comparison. Diffusion and facilitated various concentration gradients and ATP explanation. Molecular substance movement
Active passive transport vector illustration. Labeled educational cell scheme — Stock Vector
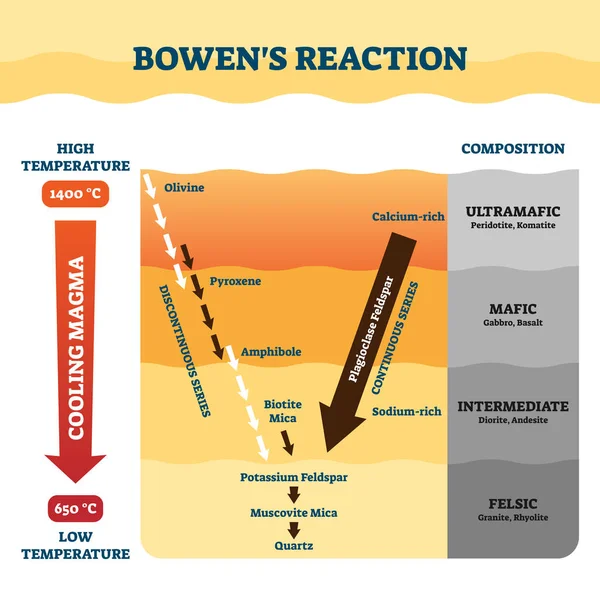
Bowens reaction vector illustration. Labeled petrology work explanation scheme. Educational diagram with cooling magma and composition process. Geological activity with rocks crystallization sequences
Bowens reaction vector illustration. Labeled petrology work explanation. — Stock Vector
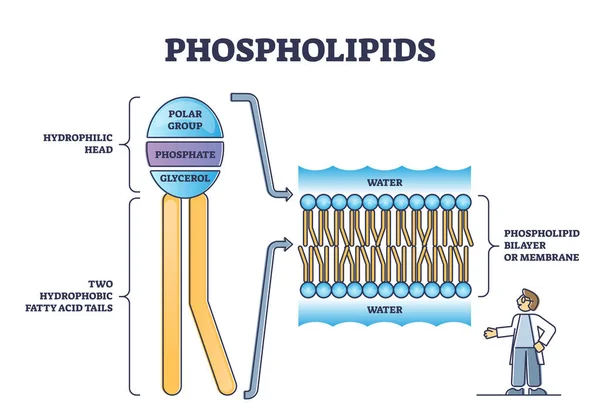
Phospholipid or phosphatides lipids head and tail structure outline diagram. Labeled educational inner description with polar group, phosphate or glycerol vector illustration. Bilayer membrane closeup
Phospholipid or phosphatides lipids head and tail structure outline diagram — Stock Vector
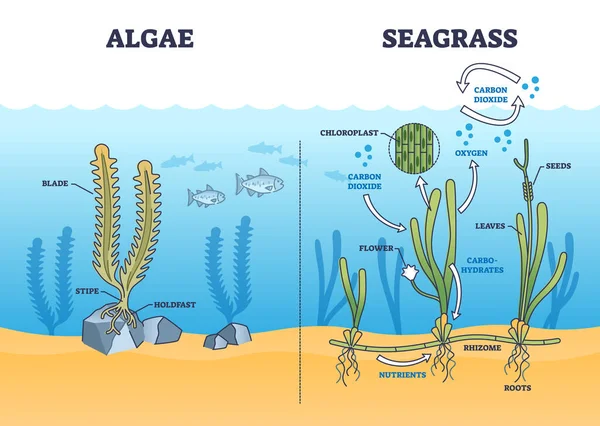
Algae and seagrass biological structure and dioxide exchange process outline diagram. Labeled educational scheme with aquatic plant botanical chloroplast and carbohydrates function vector illustration
Algae Seagrass Biological Structure Dioxide Exchange Process Outline Diagram Labeled — Stock Vector
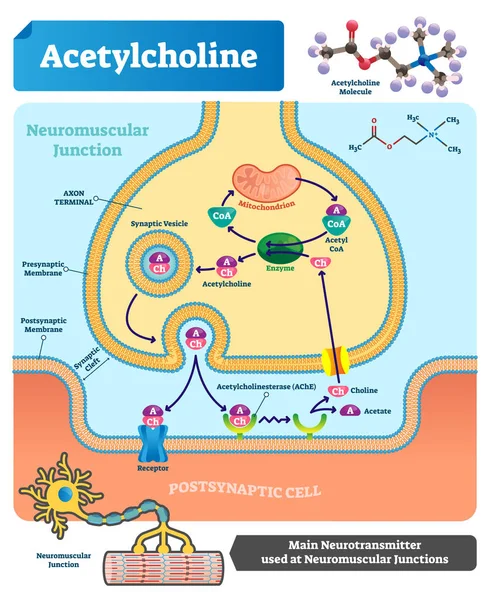
Acetylcholine vector illustration. Labeled scheme with structure of neurotransmitter, neuromuscular junction, synaptic vesicle, axon and cleft. Anatomical closeup diagram
Acetylcholine vector illustration. Labeled scheme with neurotransmitter. — Stock Vector
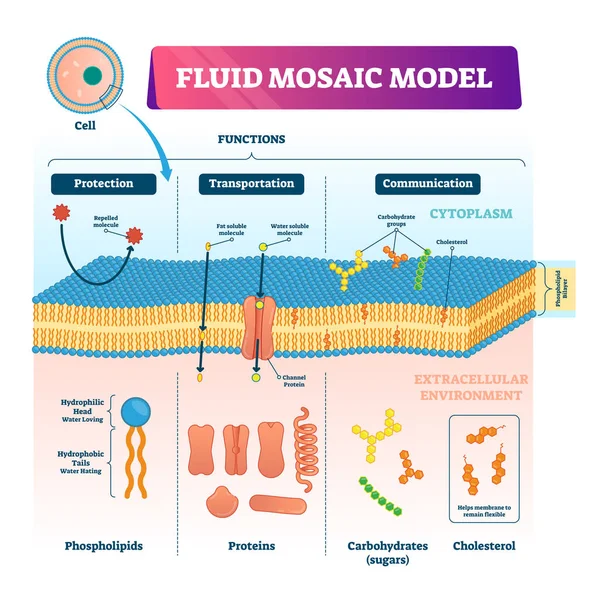
Fluid mosaic model vector illustration. Labeled cell membrane structure infographic. Educational scheme with phospholipids, protein, carbohydrates and cholesterol. Biological elastic functions graphic
Fluid mosaic model vector illustration. Cell membrane structure infographic — Stock Vector

Usage Information

You can use this royalty-free vector image "Eutrophication process explanation and water pollution stages outline diagram. Labeled educational freshwater ecosystem contamination with nitrogen, phosphorus and algae bloom vector illustration." for personal and commercial purposes according to the Standard or Extended License. The Standard License covers most use cases, including advertising, UI designs, and product packaging, and allows up to 500,000 print copies. The Extended License permits all use cases under the Standard License with unlimited print rights and allows you to use the downloaded vector files for merchandise, product resale, or free distribution.

This stock vector image is scalable to any size. You can buy and download it in high resolution up to 4400x3960. Upload Date: Jul 5, 2022