
03The impact of agglomeration on the economy
Agglomeration is the geographic concentration of economic activity. It is perhaps the most widely observed feature in the organisation of the spatial economy, and can be observed across the world, and throughout history, at a variety of different geographical levels. This phenomenon is evident in the existence and growth of cities, in the formation of industrial regions and districts, and in the clustering of related activities within the same neighbourhood of a town or city. It is why national economies aren’t evenly spread across their territories but are clustered in specific places.
This section sets out what the benefits of agglomeration are, how it affects different parts of the economy differently and what impact it has on productivity.
Agglomeration means that the world is not flat
Agglomeration occurs because of the benefits that firms and workers derive from being close to one another. There is now a great deal of empirical evidence consistent with the theory of agglomeration, which indicates superior economic performance for firms and workers in larger cities and industrial concentrations.
The consensus from the literature is that agglomeration economies exist and that they induce higher productivity for firms and workers. Figure 1 provides a histogram of estimates of the change in productivity that is brought about by change in agglomeration (‘agglomeration elasticities’) from the international empirical literature, comprising 47 empirical studies reporting over 1,000 estimates.2 The unweighted mean value of the distribution shown in Figure 1 is equal to 0.046. An elasticity of 0.046 implies that a creates a 4.6 per cent uplift in productivity levels.
In other words, the benefits of agglomeration increase with scale because, as the size of markets increases, opportunities to achieve better economic outcomes also increase. It is for this reason that cities become more productive as they get larger. In other words, the agglomeration benefits multiply. And it is part of the reason why London and Paris, Europe’s two mega cities, are the most productive large cities on the continent.3
Figure 1: On average, studies suggest that larger places are more productive

While this may appear to be a relatively small effect, productivity really matters for economic efficiency, so small increases in productivity can lead to substantial benefits across the economy in monetary terms. For example, the Elizabeth Line adds a net value of nearly £3.1 billion to the UK economy through agglomeration (firm productivity) gains. This is equivalent to 24 per cent of the direct user benefits normally quantified according to the previous official transport appraisal methodology.4
There is also some debate on whether these elasticities are underestimated due to the way that the literature has traditionally measured city size or because they get larger as cities get larger.5 More work needs to be done in this area though to test these findings.
Agglomeration benefits knowledge-based activities much more than routine ones
Activities that are centred around knowledge creation are the ones that tend to benefit the most from agglomeration. Estimates in the UK, which made use of extensive firm-level panel data for four broad sectors of the economy (manufacturing, construction, consumer services and business services) show the extent of this.6 It found that agglomeration had a 4.4 per cent uplift on productivity as city size doubled (consistent with the results above). For manufacturing and consumer services it estimated an elasticity of 2.4 per cent, for construction 3.4 per cent, but for business services it was much higher at 8.3 per cent (see Figure 2). The study also found that the effects of agglomeration diminish more rapidly with distance from source for service industries than for manufacturing, suggesting that the ‘learning’ benefit of agglomeration (see below) is particularly important to this type of activity.
Figure 2: Agglomeration has a bigger impact on more knowledge-focussed activities

There are three main production benefits to agglomeration, which play out over different distances
The main benefits that agglomeration has on production in a city (its consumption impacts are discussed in Box 2) can be classed into three categories: sharing, matching and learning:7
- Sharing: In larger markets fixed costs are reduced via sharing of indivisible facilities (e.g. roads, streetlights), intermediate suppliers, workers, and consumers. Sharing also encourages specialisation and allows firms to pool risks.
- Matching: In larger markets, it is easier for different types of worker and different types of employers to find each other, and more productive job-worker matches therefore occur at a faster rate (also known as labour market pooling).
- Learning (also known as knowledge spillovers): more dense environments facilitate the transfer of information, knowledge and skills and the creation of unconventional ideas.8 Even in a world of fast communication technologies, close connections between large groups of people and firms provide more opportunities for learning and the sharing of tacit knowledge through face-to-face contact, which tends to facilitate knowledge exchange and transfer of skills.9 Both the generation of knowledge and its diffusion benefit from these interactions.
This is particularly important for on-the-job learning, with proximity to colleagues serving as a sort of apprenticeship scheme for younger workers. Workers located next to each other can learn more easily from each other,10 while younger workers get larger wage gains when moving to the centres of cities.11
Figure 3: The benefits of agglomeration

These benefits play out over different distances. Matching plays out over large distances and varies depending on the distances that workers are prepared to commute.12 The size of London’s commuter area shows how deep the pool of potential workers that are available to businesses locating in the Capital is. For example, 5 million working age people live within an hour’s commute by public transport of Liverpool Street Station.13 And in 2011, 800,000 people commuted into the city. That represents four times the population of York crossing into the Capital every workday.14
The learning element of agglomeration plays out over a much smaller distance. For the advertising industry in Manhattan this has been estimated to have the greatest impact over 750 metres,15 while other research finds that these agglomeration effects are strongest over a distance of 1.6 kilometres.16 A recent study finds evidence of the co-location of similar businesses in neighbourhoods, buildings and even within the floors of buildings, demonstrating the importance of unplanned face-to-face interactions with near neighbours,17 while there is a drop off in collaboration even within a 10 minute walk between buildings within the same company.18
Box 2: The impact of agglomeration on consumption
As well as boosting production, on the demand side agglomeration creates positive externalities in consumption. This encourages customer-facing firms to locate closer to consumers and exploit the benefits of scale, while consumers enjoy lower prices and better opportunities for consumption of amenities and goods in larger markets.19 The collection of theatres in the West End (an example of ‘club goods’) and the much wider range of restaurants on offer in London are a reflection of this.20
Prior to the pandemic, these forces shaped the geography of London’s economy
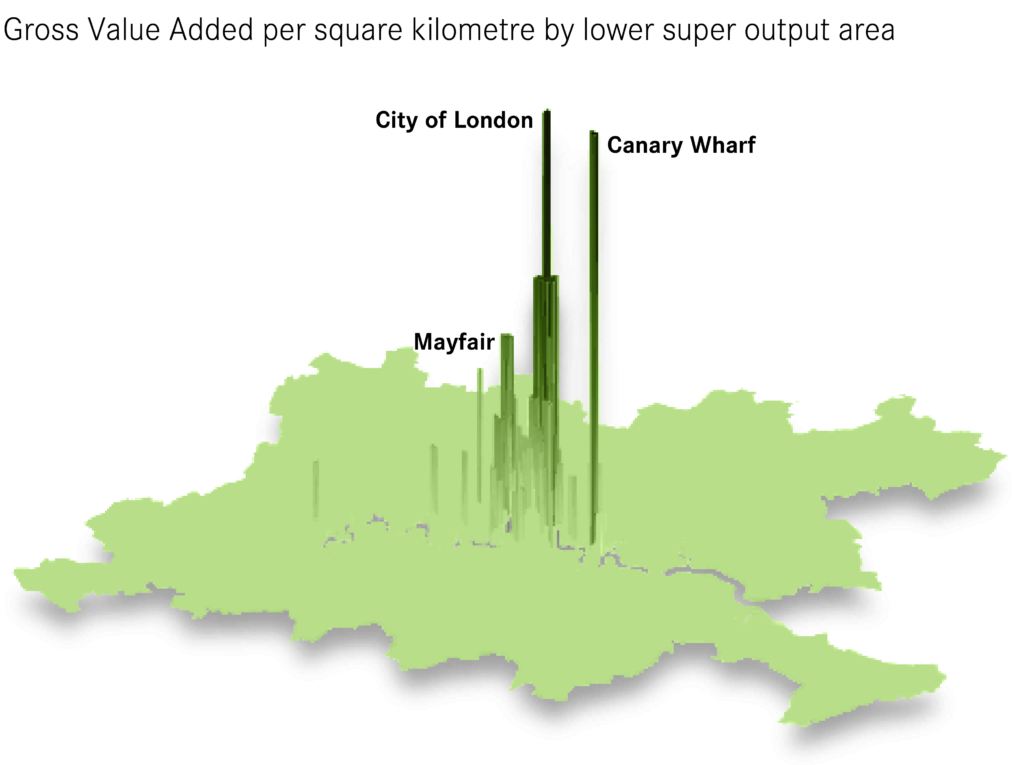
Looking at data for London shows how agglomeration influenced the geography of London’s economy on the eve of the pandemic, with the influence of the ‘learning’ element of agglomeration in particular becoming clear. In 2019, as Figure 4 and Figure 5 show, despite accounting for 1.7 per cent of the Capital’s land the centre of London accounted for:
- 9 per cent of all GVA in London. This activity was especially concentrated in the City of London, which accounted for 14.8 per cent of economic output.
- 5 per cent of all of London’s jobs.
- 7 per cent of all of the Capital’s private sector knowledge-intensive business services (KIBS) jobs.
Figure 4: London's economy is concentrated in its centre

Figure 5: A small part of London accounts for a large part of its economic output
Where firms locate is the result of a trade-off between the benefits and costs of agglomeration
Agglomeration does not come without its costs. Particularly, commercial (and residential) rents are more expensive, congestion is higher and air quality is worse.
Where firms locate depends on how they balance the trade-offs between the access to the benefits that agglomeration offers and the increased costs it creates. As shown above, the literature shows that more knowledge-intensive industries that undertake more bespoke activities see a net benefit from a central location. More routine activities (for example, call centre and back office operations) do not benefit from access to knowledge spillovers to the same extent because of the nature of their activities and so tend to locate further away from a city centre.21
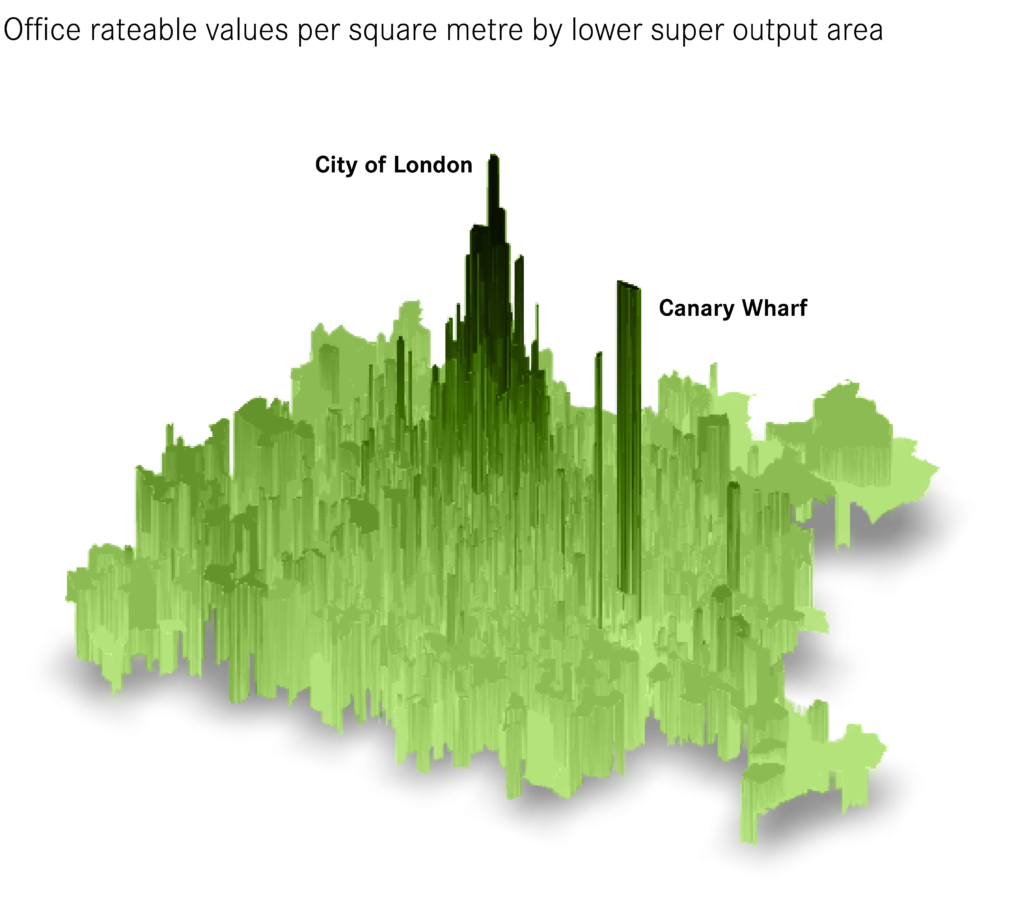
Reflecting this, the clustering of economic activity in London occurred pre-pandemic despite the higher costs of commercial space in the centre that result from higher demand. Office space per square metre in the centre of London (proxied by rateable values) was 224 per cent higher than in the rest of London, which itself was 147 per cent higher than for the rest of England and Wales. Figure 6 shows that the cost of space broadly falls the further from central London a location is, with the one clear exception being Canary Wharf (itself the result of the agglomeration of financial services companies in particular).
Figure 6: Office costs in central London are most expensive in the centre, and fall away with distance from it
The most productive parts of the UK economy have clustered in the centre of London
The result of this high-knowledge clustering in the city centre was that sectors in the centre of London in particular were more productive than elsewhere in the country. Figure 7 shows that central London was more productive than both the rest of London and the rest of Britain for almost every broad sector in the economy. This was especially the case for finance and insurance and information and communication. For finance output per job was £175,000, slightly higher than the rest of London (which was pulled up by Canary Wharf)22 and considerably higher than the £95,000 in the rest of the country.
Figure 7: Individual sectors, especially agglomeration sensitive ones, are more productive in central London than elsewhere

The digital age has not undermined agglomeration, and central London had been playing a growing role in the Capital’s economy in the two decades prior to the pandemic
The central paradox of the digital age is that the economy has increasingly concentrated in successful cities despite the rise of ever more sophisticated communications technologies through this time.23 Empirical evidence from the US highlights an increase in the employment share of interactive occupations over years 1880 to 2000 that is larger in urban than in suburban agglomerations24 because of the benefit that these industries get from the learning element of agglomeration.25 In case of less interactive tasks, there is widespread evidence of the opposite force – that is, the dispersion of manufacturing industries from core regions to peripheral regions in developed countries.26
Ever more sophisticated communications technologies have of course made home working more feasible, as Box 3 shows. But it did not reverse the increasing concentration of knowledge-based activities in city centres in the decades leading up to the pandemic.
Box 3: The rise of more sophisticated communications technologies and home working
The rise of better communications technologies appears to have facilitated more home working before Covid-19 struck. A 2012 US Census Bureau report found that the proportion of employees who mainly work from home had more than tripled between 1980 to 2010, from 0.75 per cent in 1980 to 2.4 per cent in 2010.27 Home workers spanned a wide spectrum of jobs, ranging from sales assistants to managers and engineers, with a correspondingly wide range of incomes.
In the UK, home workers constituted over 13 per cent of the national workforce in 2011, which corresponded to a growth of two percentage points since 2001.28 Most of these home workers were self-employed (63 per cent). The WFH rates in the UK were consistent with the EU average, but the Netherlands and Finland reported even higher maximum levels of WFH.29 According to the UK Labour Force Survey (LFS), the share of home workers rose to 14.5 per cent in the latter half of 2019, with London’s share (14.3 per cent) being very close to the UK average.30
The LFS also found systematic variation in the WFH rates by occupation and industry. The highest WFH rates were reported amongst skilled traders (25 per cent) and managers, directors and senior officials reported higher WFH rates (21 per cent), whereas sales and customer services (4.2 per cent) and elementary occupations e.g. cleaners (6 per cent) reported the lowest rates. This was reflected in home working by qualification. Another study found that almost half of graduates have worked from home, whilst just over 10 per cent of those with no qualifications have worked from home.31
These increases in home working though were both small, and have not stopped national economies continuing to concentrate in big cities.32 This suggests that either there was a rise in hybrid working pre-pandemic in jobs located in successful cities, or it was jobs located outside of cities that were more likely to move to a remote working pattern.
This was very clearly seen in London. Between 1998 (the earliest data available) and 2019, London (and the UK’s) economy became more concentrated in the centre of the Capital. The central London economy33 grew by 104 per cent in real terms over the period, faster than the 58.6 per cent that the rest of London expanded by, and 40.5 per cent for the rest of the country. This meant that 51 per cent of output from London’s economy was created in central London in 2019, up from 45 per cent in 1998 (see Figure 8).
Figure 8: London's economy has become more concentrated in its centre since 1998

This growth has been driven by knowledge-based industries that benefit the most from agglomeration. In 1998 the information and communication, professional, scientific and technical and finance and insurance industries already had more than 50 per cent of their output produced in the centre of London. And this increased throughout the period for all three. For information and communication and professional, scientific and technical, this was the result of their activities in central London growing almost constantly since 1998. For finance and insurance, growth in the centre outstripped that elsewhere before 2008, but the continued concentration in the centre since 2008 has been the result of the shrinking of the sector elsewhere in London (particularly Canary Wharf) – growth in the centre has flatlined since the Global Financial Crisis (see Figure 9).
Figure 9: Agglomeration sensitive industries have grown faster in central London than elsewhere in the Capital since 1998

The forces of agglomeration have long been present in London
The forces of agglomeration are not, though, factors that have emerged in the last two decades. Cities have always been places where people have been able to come together to exchange tacit knowledge face-to-face.34 The longevity of the forces of agglomeration sounds caution to predictions of the impact that the pandemic will have on the importance of them, and it should not be expected that they will be easily reversed.
Data from the 1911 census shows that this has been the case for at least 110 years (and likely much longer). While knowledge-based industries played a much smaller role in the national economy in 1911 than today, the benefits of a city location meant that these activities had a very particular geography. Knowledge-based jobs accounted for 6 per cent of all jobs in urban areas in England and Wales, compared to 2 per cent in non-urban areas, meaning they were home to four in every five of these jobs.35
This was most acutely the case in London. As is the case today, it accounted for a disproportionate share of knowledge-based jobs: in 1911 it was home to around 21 per cent of population and jobs in England and Wales, but 41 per cent of knowledge-based jobs.
Table 1: Knowledge-based jobs have long clustered in London
| Place | Share of population (%) | Share of all employment (%) | Share of knowledge jobs (%) | |||
| 1911 | 2019 | 1911 | 2019 | 1911 | 2019 | |
| Urban areas | 63.3 | 55.2 | 64.0 | 60.1 | 81.1 | 71.3 |
| London | 21.0 | 17.2 | 21.0 | 21.3 | 40.5 | 35.8 |
Because census data in 1911 was collected on a residence rather than a workplace basis, it does not reveal where in London these jobs were (and indeed may slightly undercount the total amount of jobs in London, especially the higher-paid ones that made a longer commute worth it). But analysis on data from a 1929 survey on commuting show that there were large commuter inflows into central London, and that wages increased with longer commutes, suggesting the jobs in the centre were paying higher wages, presumably to do higher-value work.36 The learning element of agglomeration played out then as it does now.
These long-lasting patterns have also stood up to several challenges before the latest threat from the Covid-19 pandemic. Box 4 looks at the impact of the first technological shock to threaten the forces of agglomeration: the Victorian commuter railway.
Box 4: Victorian railways - the first technological challenge to cities
Challenges to the importance of agglomeration are nothing new. There are a number of ‘shocks’ to cities that in principle should have weakened the impact of agglomeration, such as the development of video conferencing. The analysis above shows that the economy concentrated within central London despite this relatively recent development.
The first major technological challenge to the forces of agglomeration was the development of commuter railway lines into London.37 This development led to a decline in the population of the City of London as faster transport opened up the possibility of living further from the centre, and the Capital’s population dispersed. But it did not lead to an equivalent dispersal of jobs too. While the night time population of the City declined between 1851 and 1921, its daytime population continued to rise, and doubled over this period to close to 400,000.