Evidence for rapid divergence of sensory systems between Texas populations of the Mexican tetra (Astyanax mexicanus)
 Maya S. Enriquez1*
  Nathan Swanson2
  Rosalyn L. Putland3
  Ti Tait4
  Andrew G. Gluesenkamp5
  Suzanne E. McGaugh1
  Allen F. Mensinger4
- 1Department of Ecology, Evolution and Behavior, University of Minnesota, St. Paul, MN, United States
- 2Department of Ecology and Evolutionary Biology, University of California, Irvine, Irvine, CA, United States
- 3Centre for Environment, Fisheries and Aquaculture Science, Lowestoft, United Kingdom
- 4Department of Biology, University of Minnesota Duluth, Duluth, MN, United States
- 5Center for Conservation and Research, San Antonio Zoo, San Antonio, TX, United States
Population divergence is often quantified using phenotypic variation. However, because sensory abilities are more difficult to discern, we have little information on the plasticity and rate of sensory change between different environments. The Mexican tetra (Astyanax mexicanus) is a fish distributed throughout Southern Texas and Northern Mexico and has evolved troglomorphic phenotypes, such as vestigial eyes and reduced pigmentation, when surface ancestors invaded caves in the past several hundred thousand years. In the early 1900s, surface A. mexicanus were introduced to the karstic Edwards-Trinity Aquifer in Texas. Subsequent cave colonization of subterranean environments resulted in fish with phenotypic and behavioral divergence from their surface counterparts, allowing examination of how new environments lead to sensory changes. We hypothesized that recently introduced cave populations would be more sensitive to light and sound when compared to their surface counterparts. We quantified divergence using auditory evoked potentials (AEPs) and particle acceleration levels (PALs) to measure differences in sound sensitivity, and electroretinography (ERGs) to measure light sensitivity. We also compared these results to measurements taken from native populations and lab-born individuals of the introduced populations. Honey Creek Cave fish were significantly more sensitive than proximate Honey Creek surface fish to sound pressure levels between 0.6 and 0.8 kHz and particle acceleration levels between 0.4 and 0.8 kHz. Pairwise differences were found between San Antonio Zoo surface and the facultative subterranean San Pedro Springs and Blue Hole populations, which exhibited more sensitivity to particle acceleration levels between 0.5 and 0.7 kHz. Electroretinography results indicate no significant differences between populations, although Honey Creek Cave fish may be trending toward reduced visual sensitivity. Auditory thresholds between wild-caught and lab-raised populations of recently invaded fish show significant differences in sensitivity, suggesting that these traits are plastic. Collectively, while these results may point to the rapid divergence of A. mexicanus in cave habitats, it also highlights the responsive plasticity of A. mexicanus auditory system to disparate environments.
1. Introduction
Recent studies have documented rapid phenotypic evolution in organisms, detailing significant changes over time scales of a few generations rather than millions of years. Several studies have demonstrated rapid evolution in fishes, including color pattern selection based on predator presence over 15 generations in Trinidadian guppies (Endler, 1980), morphometric changes in South American cichlids within decades following river damming (Gilbert et al., 2020), and ecotype divergence in three-spine stickleback within a single generation (Laurentino et al., 2020). The sensory systems of organisms can evolve to match environmental conditions (Endler, 1980; Endler and Basolo, 1998) but it remains unclear how quickly sensory systems and their sensitivity to stimuli might adapt to changing conditions (Zakon, 2015; Dunlop et al., 2018) or may diverge between individuals within a population, resulting in speciation (Seehausen et al., 2008; Puechmaille et al., 2011; Tait et al., 2021).
Cave organisms offer a robust framework to study divergence, plasticity, and evolution. Due to the similarities of characteristics among cave systems, such as perpetual darkness, limited nutrient availability, and the general absence of predators, there is a convergence of phenotypic attributes observed in cave animals (Jeffery, 2001; Pipan and Culver, 2012; Bradic et al., 2013; Herman et al., 2018; Xiong et al, 2018; Recknagel and Trontelj, 2022). Globally, animal lineages have evolved to inhabit cave ecosystems in a process known as troglomorphic adaptation. Troglomorphy describes the phenotypic features associated with cave organisms and includes lack of pigmentation, tolerance to low nutrient availability, vision loss, and the enhancement of non-visual sensory systems to navigate dark environments (Yoshizawa et al, 2010; Protas and Jeffery, 2012; O’Quin et al., 2013; Yoshizawa, 2016). While comparisons between cave and surface species offer insight into how similar organisms adapt to extreme environments (Porter et al., 2007), little is known about how quickly these traits can evolve.
The Mexican tetra, Astyanax Mexicanus, provides a unique model for examining troglomorphic sensory adaptation, since it is found in two distinct environments: surface, abundant in many rivers in Northern Mexico and parts of Texas, United States, and subterranean, with approximately 30 known cave populations (Espinasa et al., 2018) in Mexico. The Mexican cave morphotype of this species has troglomorphic features, including lack of pigmentation and loss of eyes. However, they can interbreed with the surface morphotype and hybridize in the wild (Herman et al., 2018; Jeffery, 2020).
Surface A. mexicanus were introduced into the San Antonio River in Central Texas between 1908 and 1940 (Brown, 1953). Several populations were later established in both cave and surface waterways in the Edwards-Trinity Aquifer system, with A. mexicanus first observed in the Guadalupe River in 1953 (Constable et al., 2010). Thus, the populations in Central Texas likely diverged from proximate Rio Grande (Rio Bravo) surface populations within the last century. Although Mexican A. mexicanus have acquired troglomorphic characteristics over several hundred thousand years (Herman et al., 2018), a recent study indicated morphological and behavioral changes between the two ecotypes in Honey Creek and Honey Creek Cave, suggesting rapid divergence between cave and surface populations (McGaugh et al., 2020).
The cave environment differs from the surface streams and rivers in light availability and environmental soundscapes (Niemiller and Soares, 2015). Caves have been characterized using light availability and temperatures found within different cave zones (Pipan and Culver, 2012), but the soundscapes within caves are not well studied. The aquatic soundscapes of caves often lack atmospheric input, such as wind and rain, that are major contributors to marine (Parks et al., 2014) and freshwater surface environments (Putland and Mensinger, 2020), which may affect auditory sensitivity. In the karst cave systems inhabited by A. mexicanus, lower ambient sound is attributed to fewer abiotic and biotic sound sources, sound absorption by porous limestone, and dissipation by irregular surfaces within the caves (i.e., stalactites, stalagmites, concavities, tunnels; Iannace and Trematerra, 2014; Carvalho and Sousa, 2015; Badino and Chignola, 2019). The absence of light in cave systems has predictably resulted in the degradation of visual systems in troglomorphic fish (Wilkens, 1988; Wilkens and Strecker, 2017; Soares and Niemiller, 2020). This loss of vision is offset by increased sensitivity in other sensory modalities, such as increased hair cell density of the lateral line, which may lead to increased lateral line sensitivity (Yoshizawa et al., 2014; Lloyd et al., 2018). However, it is unclear if newly colonized cave populations, prior to undergoing visual degradation, may initially be under selection for increased retinal or auditory sensitivity (Krishnan and Rohner, 2017). Selection for increased retinal sensitivity and other traits is expected in troglophilic populations that occupy spring sites and other areas of resurgence (re-emergence of karst groundwater to surface areas).
Several studies have compared sensory systems between cave and surface ecotypes of A. mexicanus (Yoshizawa, 2016). Early studies of A. mexicanus found no significant difference in auditory sensitivity between Mexican cave and surface populations using classical conditioning approaches (Popper, 1970). More recent works have indicated that cave A. mexicanus have increased olfactory sensitivity (Protas et al., 2008; Blin et al., 2020) and increased number of tastebuds when compared to surface counterparts (Varatharasan et al., 2009; Yamamoto et al., 2009). Several studies also reveal increased wall following behavior (Sharma et al., 2009; Patton et al., 2010), which may be related to reliance on the lateral line. A recent study has even characterized sound production behaviors in both native cave and surface fish (Hyacinthe et al., 2019). However, these studies have been confined to Mexican populations that have diverged over hundreds of thousands of generations. The study of relatively recent colonization events in Texas, in which cave and surface populations remain similar in external morphology, allows investigation into potential early divergence of sensory systems. The goal of this study is to compare auditory and visual sensitivity between populations from recently invaded subterranean environments and surface populations of A. mexicanus in Texas.
The Mexican tetra is a member of the Characiae family, in the superorder Ostariophysi (Nakatani et al., 2011; Gross, 2012) which possess Weberian ossicles that connect the swim bladder to the inner ear, allowing for greater detection of sound pressure (Schulz-Mirbach et al., 2020). The increased auditory sensitivity and enhanced range of ostariophysans such as A. mexicanus provides an excellent model for investigating any changes in auditory thresholds. We hypothesize that the change in environmental pressures from surface systems to underwater caves have selected for increased auditory and visual sensitivity in recently introduced populations of A. mexicanus and expect to see these changes when comparing auditory and visual thresholds of surface, subterranean, and facultatively subterranean populations. To provide context to the direction of changes observed in the newly invaded populations, we also compare the auditory sensitivity of these recently introduced populations to lab-raised fish from the native range. We employ measurements of sound pressure via the auditory brainstem response (also known as the auditory evoked potential, or AEP) and measurements of particle acceleration of the presented sound stimuli to capture the two metrics of auditory sensitivity found in ostariophysan fish. We additionally measure visual sensitivity using electroretinography, a methodology that records the rapid electrical response of light-sensitive cells in the eye. Furthermore, to determine if these traits have a heritable (rather than plastic) mechanism, wild-caught and lab-raised fish from the recently introduced A. mexicanus populations are compared.
2. Methods
2.1. Population sampling
Previous work compared Honey Creek Cave fish to Honey Creek surface fish (McGaugh et al., 2020). Here, we examine this comparison, in addition to fish from a second river drainage within Texas. For this additional comparison, we collected fish from San Pedro Springs, Blue Hole, and the San Antonio Zoo. San Pedro Springs and Blue Hole fish reside underground during low aquifer conditions while San Antonio Zoo fish are exclusively surface dwellers in a portion of the river maintained by a groundwater well. A. mexicanus specimens were collected from five locations (Figure 1). Fish were obtained in Honey Creek which feeds into the nearby Guadalupe River in Comal Country, Texas, with cave fish obtained <100 m inside of the spring entrance of Honey Creek Cave (the source of Honey Creek) during June 2019 and February 2020, and surface fish were obtained from Honey Creek approximately 1,500 m downstream of the cave entrance in February 2020. San Pedro Spring fish were collected June 2019 from springs emerging from a bedrock headwall in San Pedro Springs Park, San Antonio, TX, which is a public recreational area with springs feeding into an outdoor pool. Blue Hole fish were collected June 2019 from the Blue Hole, a (formerly artesian) modified open spring that feeds into the nearby San Antonio River on the University of the Incarnate Word campus in San Antonio, TX. The Headwaters Sanctuary at University of the Incarnate Word houses the headwaters of the San Antonio River, with the Blue Hole serving as the centerpiece of the sanctuary. The spring is ephemeral: during periods of low aquifer levels, the population retreats to the subterranean portion of the spring. Above 204 asl, the spring flows into the San Antonio River via a short spring run. Fish do not appear to colonize the spring pool via the river, but rather from deeper in the spring system (A. Gluesenkamp, pers. observation).
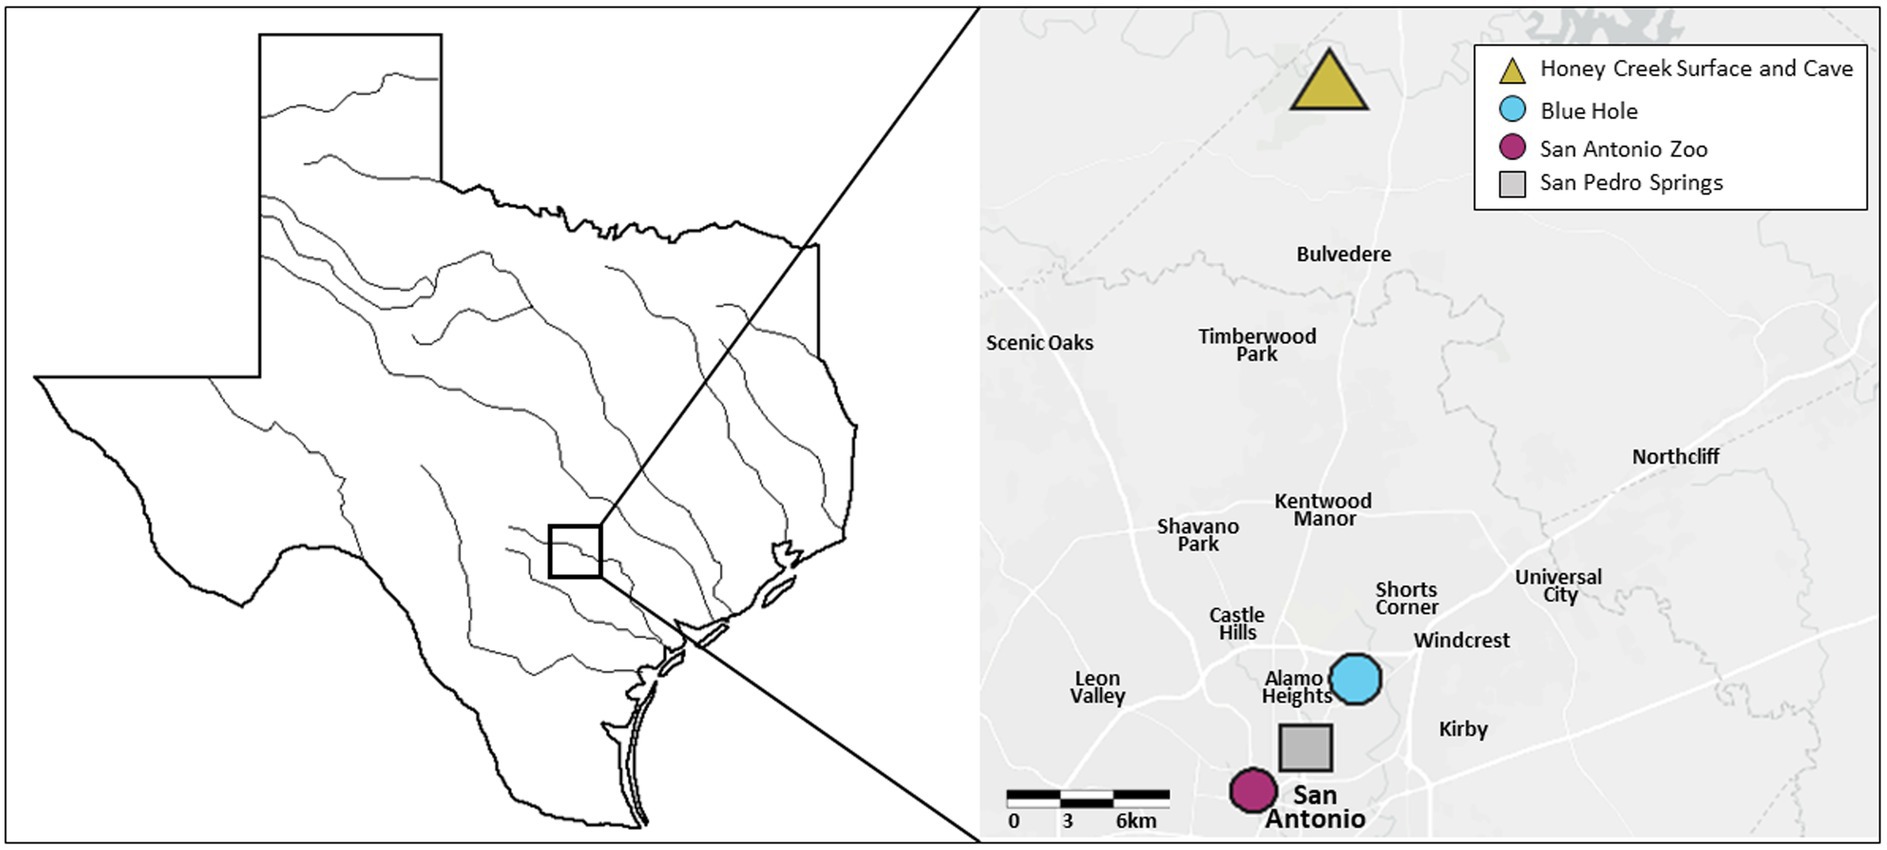
Figure 1. Geographic locations of recently invaded population sampling. Five recently invaded populations of Astyanax mexicanus found in the Edwards-Trinity Aquifier system were sampled for this study, with collection points indicated on the map. The triangle shape indicates both a surface and cave environment. Circles indicate intermediate environments, while a square indicates a surface environment.
In addition to collection, a SoundTrap STH 300 hydrophone (Ocean Instruments NZ; Warkworth, Aukland, NZ) was deployed for 24 h at each collection site. San Antonio Zoo surface fish were collected in June 2019 from a headwater branch of the San Antonio River that originates on San Antonio Zoo grounds. San Antonio Zoo, San Pedro Springs and Blue Hole are within 7 km from one another and connected by the San Antonio River. Individuals from all five populations were transported to the University of Minnesota (St. Paul Campus) within 7 days of collection via a direct flight by Delta Cargo. Fish were maintained at the University of Minnesota, St. Paul Campus between 3 months to 1 year before transport to the University of Minnesota Duluth. Aquariums at the St. Paul campus were kept between 21 and 23°C and on a 14:10 light cycle. All fish were fed frozen bloodworms, brine shrimp, or Tetra Cichlid flakes (Spectrum Brands Pet, LLC, Blacksburg, VA, United States) 1–2 times a day, ad libitum. Fish were transported to the University of Minnesota-Duluth in buckets filled with water conditioned using 0.5% API Stress Coat Plus (Mars Fishcare Inc., Chalfront, PA, United States) that were equipped with battery-operated air pumps for water circulation.
To test the lab-raised descendants of wild-caught fish, wild-caught Blue Hole, Honey Creek Cave, and Honey Creek Surface fish were bred in the lab and raised to at least 6 months post-fertilization prior to transportation to the University of Minnesota Duluth. Fish were bred following an adapted protocol from Borowsky (2008): larval fish were fed Hikari First Bites Fish Food (Hikari Sales USA, Inc., Hayward, CA, United States) for the first 30 days post-fertilization in small aquaria kept at room temperature. At approximately 30 days post-fertilization, larval fish were switched to a diet of crushed flake, frozen brine shrimp, and frozen bloodworms in heated (26°C) fully-filtered tanks at a density of one fish per 9–18 L. Heat was removed 6 months post-fertilization, and lab-born fish were treated as adults. Animal care and housing practices were carried out in accordance with all IACUC guidelines (UMN IACUC protocol 2002-37827A).
In addition to recently established populations, we tested descendants of wild-caught cave and surface fish from their native range. Fish were sourced from the Stowers Institute for Medical Research (Kansas City, MO) and included lab lineages of two cave populations (Pachón and Molino) and one surface population (Mexican surface river). These three populations were transported to the University of Minnesota via FedEx overnight shipment.
2.2. Animal husbandry
A total of eight separate populations were used in this study: Honey Creek Cave (n = 7), Honey Creek surface (n = 10), San Pedro Springs (n = 7), Blue Hole (n = 7), San Antonio Zoo surface (n = 11), lab-lineage Molino Cave (n = 5), lab-lineage Pachón Cave (n = 5) and lab-lineage Mexican surface (n = 5). In addition, we also tested lab-raised Blue Hole (n = 10), lab-raised Honey Creek Cave (n = 6), and lab-raised Honey Creek Surface fish (n = 5). Fish were maintained indoors at the University of Minnesota Duluth. Each population was housed separately in 75.7 L glass tanks filled with buffered pond water (0.56 g KCl, 0.44 g NaCl, and 2.6 g CaCl2 per 75.7 L, pH = 7.0) and equipped with mechanical, chemical, and biological filters. Water temperature was maintained between 20 and 22°C. Illumination was provided by a Marineland LED Light Hood (Spectrum Brands Pet, LLC., Blacksburg, VA, United States) on top of each tank containing surface fish on a 9 h light:15 h dark cycle. The cave tanks were not illuminated and separated from the surface tanks by opaque dividers but still received dim indirect light from the surface tanks. All populations were fed Tetra Cichlid Flakes daily. Prior to each experiment, standard length (SL, mm), total length (TL, mm) and wet weight (M, g) were recorded.
2.3. Auditory evoked potentials
Auditory evoked potentials (AEP) testing was conducted in a 375 L cylindrical fiberglass tank (88 cm inner diameter, 62 cm height, 57 cm water depth) seated on a 1 cm thick rubber mat on cinderblocks (41 × 20 × 10 cm) to reduce noise (Figure 2A). The experimental tank was housed within a galvanized angle iron frame (110 × 125 × 182 cm) surrounded on the top and three sides with FOAMULAR Insulation Sheathing 2.5 cm thick (Owens Corning; Toledo, OH, United States) to reduce background sound and prevent the fish from seeing the experimenter.
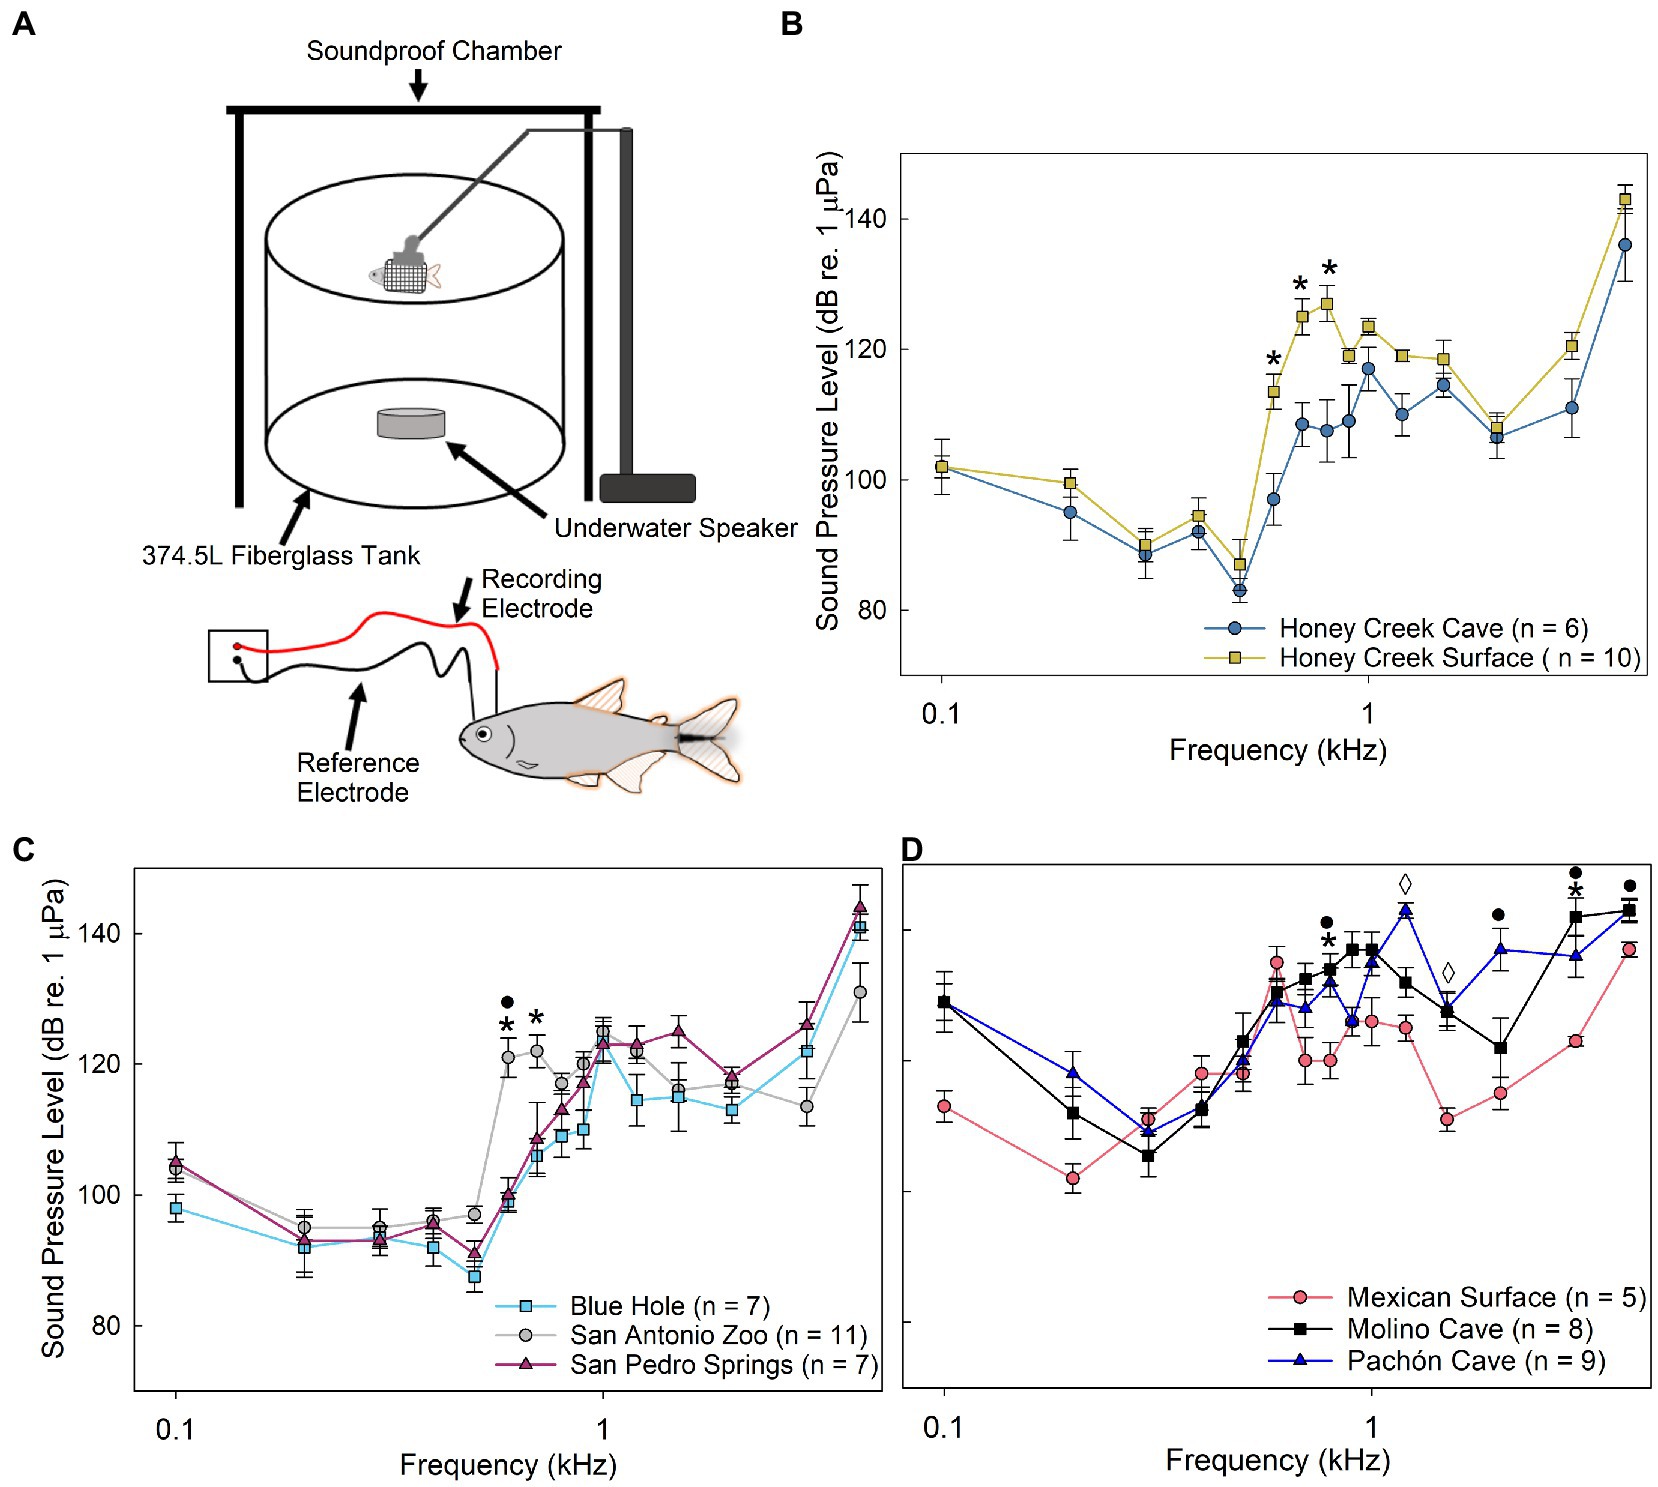
Figure 2. Auditory evoked potentials. (A) Schematic of auditory evoked potential (AEP) experimental setup. (B–D) Median auditory sound pressure level (±SE) sensitivity compared between populations. (B) Comparison between Honey Creek Cave (blue circle) and Honey Creek Surface (yellow square). Asterisks (*) indicate a significant difference (Mann-whitney U test, p < 0.05) between populations. (C) Comparison between San Antonio Zoo (grey circle), Blue Hole (cyan square) and San Pedro Springs (magnenta triangle). Asterisks (*) indicate a significant (Kruskal-Wallis with post-hoc pairwise Wilcox w/Holm correction, p < 0.05) difference between San Antonio Zoo and Blue Hole. A black circle (•) indicates a significant difference between San Antonio Zoo and San Pedro Springs. (D) Comparison between Mexican Surface (red circle), Molino Cave (black square) and Pachon Cave (blue traingle). A significant difference is defined as p < 0.05 using a Kruskal-Wallis test with post-hoc pairwise Wilcox w/ Holm adjustment. Asterisks (*) indicate a significant difference between Mexican surface and Pachon Cave. A black circle (•) indicates a significant difference between Mexican surface and Molino Cave. A diamond (◊) indicates significant differences between all pairwise population comparisons.
Prior to electrode implantation, fish were anesthetized for 5 min using phosphate buffered tricaine methanesulfonate (MS-222) at a concentration of 0.005%; (Western Chemical Inc., Ferndale, WA, United States) and then were suspended in a mesh sling using an adjustable Omano Microscope arm boom stand (Microscope LLC.; Roanoke, VA, United States) within a smaller plastic anesthetic chamber (26.5 × 18.5 × 19 cm) containing the anesthetic solution to maintain quiescence throughout the experiment. The dorsal surface of the fish was maintained 4 cm below the surface of the water and 42 cm above an underwater speaker Model UW-30 (Electro-Voice; Burnsville, MN, United States).
Stainless steel electrodes (Rochester Electro-Medical Inc.; Tampa, FL, United States) were insulated with acrylic paint to within 2 mm of the electrode tip and implanted subcutaneously. The recording electrode was positioned above the brainstem and placed medially on the dorsal surface of the head approximately 2 mm posterior to an imaginary line drawn between the anterior margins of the opercula. A reference electrode was placed medially between the nares (Figure 2A). AEP signals were amplified using a headstage (gain = 10×) connected to a Model EX1 extracellular differential amplifier with a gain of 100× (Dagan Corporation; Minneapolis, MN, United States) with a 0.02 kHz high-pass filter and a 5.0 kHz low-pass filter. A Micro-3 model 1401 data acquisition system (Cambridge Electronic Design [CED], Milton, Cambridge, United Kingdom) and Spike2 (Version 8, CED) script (file “fishabr v1.20.s2s”)1 were used to set sound signal parameters, calibrate sound pressure level (SPL) attenuation, and digitize the received AEP signals. A programmable attenuator (Model 3505, CED) and Model AS-35 amplifier (Accusonic Corp., Markham, Ontario, Canada) controlled the SPL of the presented signals. The attenuator and amplifier were calibrated using a Model 8103 hydrophone (Brüel & Kjaer; Virum, Denmark) placed in the same position as the experimental fish. The hydrophone was connected to a Nexus Model 2609-01s Conditioning Amplifier (Brüel & Kjaer; Virum, Denmark). Pure tone signals were attenuated in 3 dB 1 μPa SPLrms steps.
Auditory thresholds for 15 frequencies between 0.1 and 4.0 kHz were tested. For stimulus presentation, pure tone bursts for each frequency were broadcast (50 ms; 500 repetitions; 3 ms delay) and responses were collected and averaged using the same Spike2 script as mentioned above. The presence of AEPs were verified by two means: (1) through the observation of the characteristic wave visible above the background noise (≥0.001 mV) at the second harmonic of the stimulation frequency (Supplementary Figure S1) and (2) by fast Fourier transform power spectrum analysis (FFT, Hanning window = 1,024) (Supplementary Figure S2) to calculate power spectra of the average waveforms at two times the stimulus frequency (Vetter et al., 2018). Visual AEPs with FFT peaks above the background noise (≥0.001 mV) at the second harmonic of the stimulation frequency were considered evoked potentials. The auditory threshold at each tested frequency was defined as the minimum SPL that elicited an observable AEP response and a FFT peak at the second harmonic of the stimulus frequency. Threshold measurements were conducted by gradually increasing SPLrms until AEPs were detected or the maximum output of the speaker at a given frequency was reached.
2.4. Particle acceleration thresholds
Particle acceleration level (PAL) thresholds were determined by running a playback experiment which used the experimentally determined sound pressure threshold levels to then measure and calculate particle acceleration thresholds for each fish tested. PALs were calculated using a Model W356A12/NC (PCB Piezotronics Inc.; Depew, NY, United States) triaxial accelerometer (sensitivity, x = 10.47 mVms−2, y = 10.35 mVms−2, z = 10.29 mVms−2) modified to be neutrally buoyant and connected to a signal conditioner (482C15; Piezotronics Inc.) and positioned within the AEP experimental tank in the same position as the fish head. For each frequency, corresponding PAL measurements were made for each SPL throughout the attenuation range. The accelerometer was positioned with its x-axis in the rostral-caudal, the y-axis in the lateral, and the z-axis to the dorsal-ventral planes of the fish. To calculate the PAL, the Vrms was determined for each axis (x, y, and z) and then converted into individual magnitude vectors. The following equation was used to calculate PAL thresholds:
2.5. Electroretinography
All electroretinography (ERG) testing was conducted in a room illuminated by dim red light (15 W light bulbs with Kodak GBX-2 dark red safelight filter). Each fish was anesthetized with MS-222 solution between 0.0075 and 0.0085%, buffered with sodium bicarbonate to a pH of 7.0, for 5 min prior to placement in experimental chamber. The fish was then placed on a moist sponge in the acrylic experimental tank (13 × 18 × 8 cm) and covered with a wet Kimwipe (Kimberly-Clark Professional; Roswell, GA, United States). The experimental tank was housed within an opaque metal faraday cage (77 × 67 × 97 cm) to prevent equipment light from reaching the fish (Supplementary Figure S3). The buffered MS-222 solution was delivered to the fish via a gravity-fed tube placed in the buccal cavity of the fish to maintain the surgical plane of anesthesia.
A small incision through the limbus of the eye was made with a 0.3 mm 15° stab knife (Surgical Specialties; Westwood, MA, United States). A 0.64 mm diameter silver-silver chloride electrode was inserted into the incision, with the reference electrode placed within the nostril of the ipsilateral side. ERG waveforms were amplified using a DAM50 (World Precision, Inc.; Sarasota, FL, United States) bioamplifier (1,000× gain; 1 Hz high pass, 3 kHz low pass), filtered with a digital 60 Hz notch filter to reduce electrical noise in the system, and recorded with a Powerlab 4SP (AD Instruments, Inc.; Colorado Springs, CO, United States) using Lab Chart7 Software (AD Instruments) on a Dell laptop.
A 100 W quartz tungsten-halogen Model 6333 lamp (Newport Corp.; Stratford, CT, United States) powered by a constant current power supply (Model 68938; Newport) produced the light stimulus. Stimulus duration (200 ms) was regulated with an electronic shutter (Model 76994; Newport) and controller (Model 76995; Newport). A dual filter wheel (Model 7736; Newport) containing neutral density filters from 0.1 to 3.0 regulated light intensity, with wavelength controlled by a monochromator (Model 77250; Newport). Light intensity was determined using a radiant power energy meter (Model 70260; Newport) and probe (Model 70268; Newport). A fiber optic light pipe (Model 77632; Newport) transmitted the light from the monochromator to the eye, completely illuminating it.
All fish were dark adapted for 30–60 min. Test flashes were initiated at the 30 min mark to determine if the retina was dark adapted, which was defined as the absence of a negative inflection (also known as the “a-wave”) prior to the positive inflection (“b-wave,” see Supplementary Figure S4) in the ERG response waveform. If the a-wave remained, the fish was allowed to dark adapt for an additional 10 min, and the process was repeated until the a-wave was undetectable. Wavelengths between 425 and 700 nm were presented to the fish in random order with flash duration of 200 ms and interflash interval of 10 to 30 s. Experiments were conducted during the fish’s light cycle to avoid circadian rhythm effects.
The response criterion was set as the b-wave amplitude (baseline to peak) at 425 nm and averaged approximately 30 mV (Supplementary Figure S4). Other wavelengths were reduced in intensity using neutral density filters until the response equaled to the b-wave amplitude at 425 nm. Upon completion of the ERG, fish were revived by delivering buffered pondwater to the fish via a separate gravity-fed tube until gilling resumed, and fish were returned to home aquaria.
2.6. Statistics
To determine if Honey Creek Cave fish were more sensitive to auditory and visual stimuli than Honey Creek surface fish, the SPL, PAL and ERG threshold data were analyzed using a T-test. Because the SPL, PAL and ERG data were not normally distributed (Shapiro–Wilk test: SPL data [W = 0.99, p < 0.001], PAL [W = 0.98, p < 0.001], ERG [W = 0.81, p < 0.001]), non-parametric tests were used. Similarly, lab-raised populations were compared to wild-caught fish using a non-parametric T-test. If the dataset had equal variance as determined by Levene’s test, a Welch’s T test was conducted; otherwise, a Mann–Whitney U test was used.
To test for differences in auditory and visual sensitivity between the surface San Antonio Zoo population and the facultative Blue Hole and San Pedro Springs populations, the SPL, PAL and ERG threshold data were analyzed via a Kruskal-Wallis H. To determine if native cave populations were more sensitive to auditory stimuli than native surface populations, the SPL and PAL values of lab-raised fish derived from wild caught fish sampled from Pachón Cave, Molino Cave and a Mexican surface site were also compared using a Kruskal-Wallis H test. If significant differences (p < 0.05) were found between groups, post hoc pairwise Wilcoxon Rank-Sum tests with Holm adjustment were conducted.”
Statistical analysis was completed using R Version 4.2.2 “Innocent and Trusting” (R Core Team, 2022). Graphs were created in both R and SigmaPlot (Version 15.0). Data are reported as median ± SE.
3. Results
3.1. Sound pressure thresholds
All populations responded to frequencies between 0.1 and 4.0 kHz, with the highest sensitivity detected between 0.2 and 0.5 kHz. Honey Creek Cave populations displayed significantly more sensitive sound pressure thresholds (Mann–Whitney U test, p < 0.05) than surface conspecifics between 0.6 and 0.8 kHz (Figure 2B). Blue Hole and San Pedro Springs populations were significantly more sensitive (Pairwise Wilcox with Holm Adj., p < 0.05) than San Antonio Zoo surface fish at 0.6–0.7 kHz and 0.6 kHz, respectfully (Figure 2C). Mexican surface fish were most sensitive of all the native populations at 0.2 kHz while Molino Cave and Pachón Cave were more sensitive between 0.3 and 0.4 kHz (Figure 2D), although these thresholds are not significantly different from Mexican surface fish.
Sound pressure sensitivity also differed between wild-caught and lab raised fish. Only Honey Creek Surface exhibited similar thresholds between wild-caught and lab-raised fish at 0.3–0.7 kHz (p < 0.05) and 1.2–3.0 kHz (p < 0.01) (Figure 3A). Wild-caught fish were significantly more sensitive to sound pressure than lab-raised descendants at all frequencies except 3.0–4.0 kHz in Honey Creek Cave (Welch’s T test; p < 0.05) and Blue Hole (Mann–Whitney U test, p < 0.05) population fish (Figures 3B,C). While it appears that sound pressure threshold is highly dependent on developmental environment, higher sensitivity in wild-caught fish suggests that the soundscape of these recently colonized cave-like areas hold ecological information relevant to A. mexicanus.
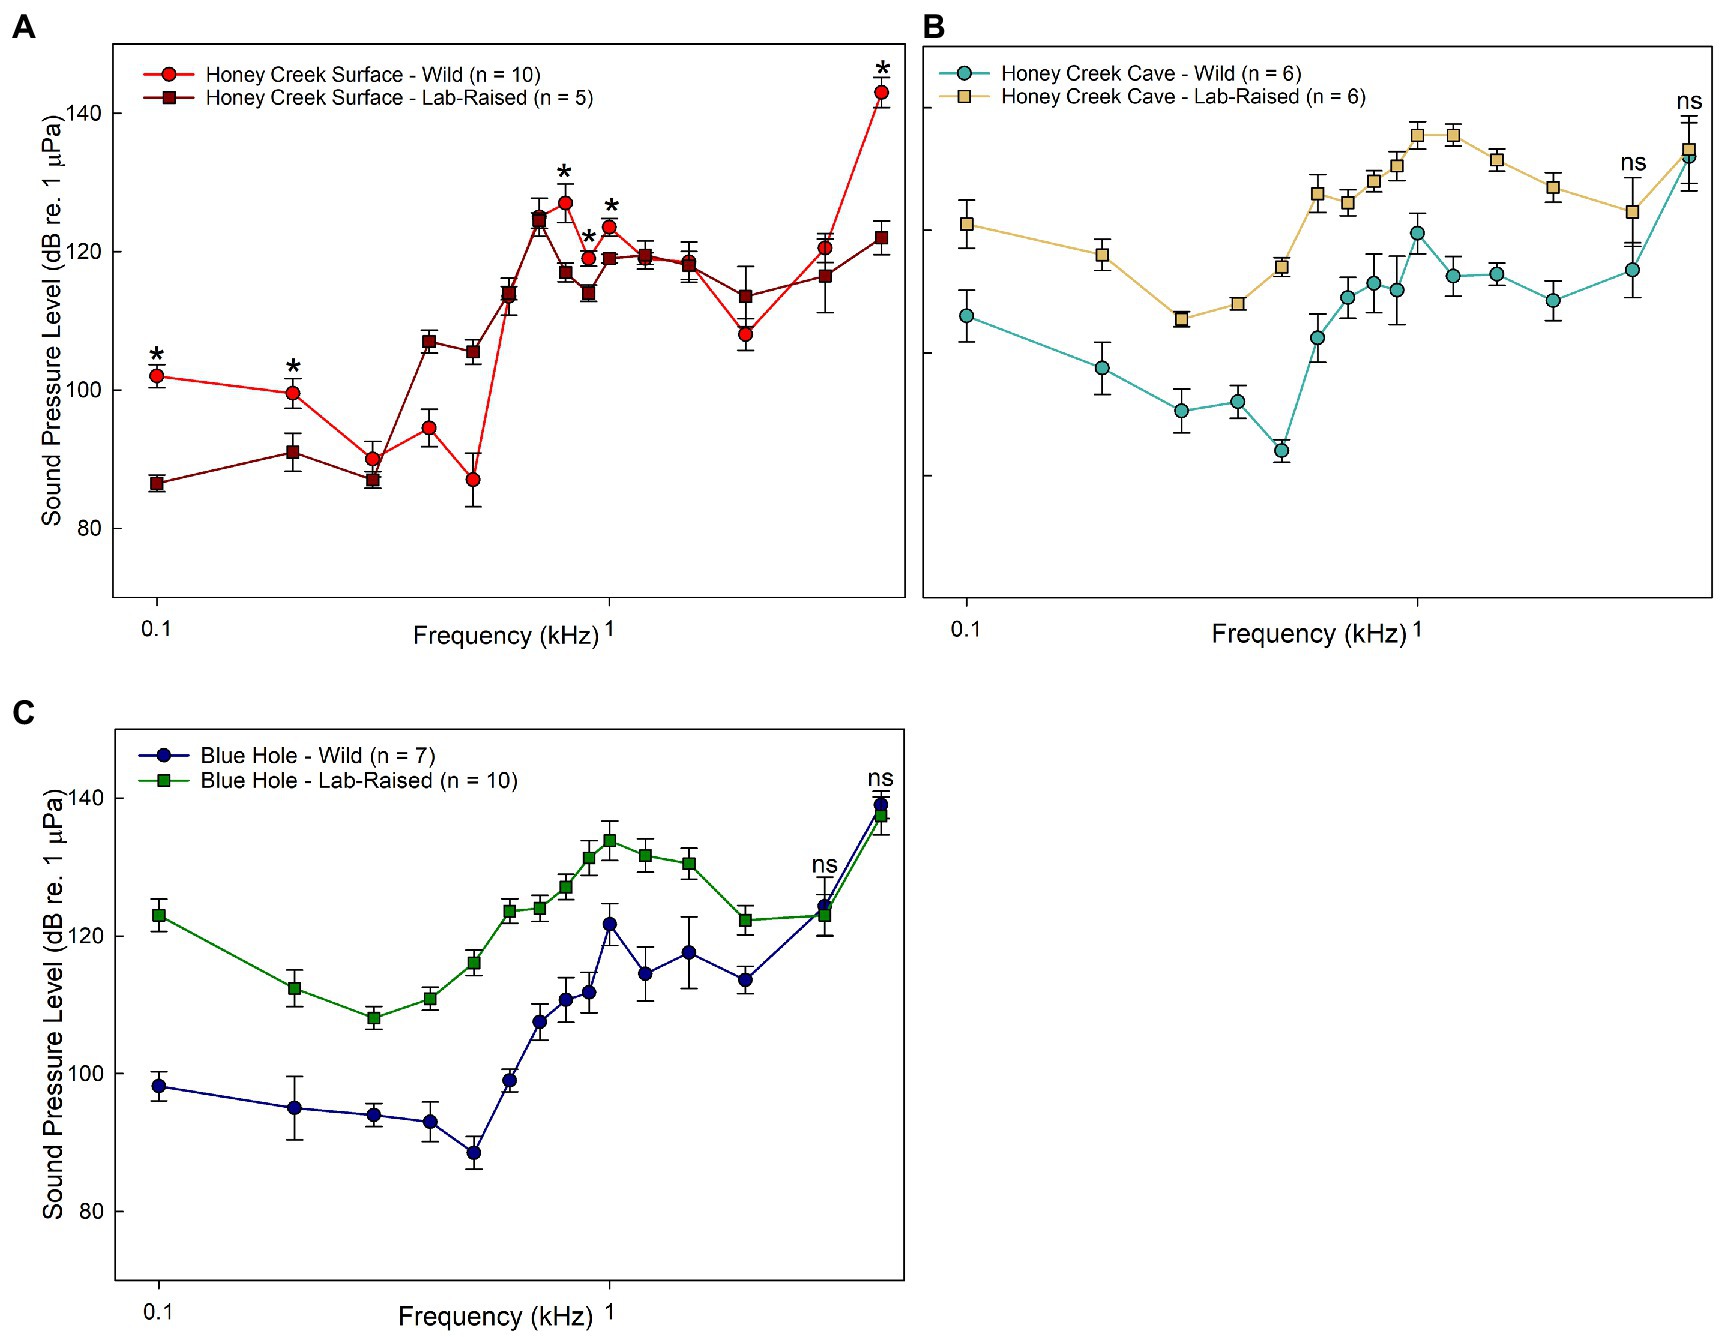
Figure 3. Wild caught and lab-raised AEP Thresholds. (A–C) Median auditory sound pressure level (±SE) sensitivity compared between populations. (A) Comparison between wild-caught (red circle) and lab-raised (brown square) Honey Creek Surface fish. Asterisks (*) indicates significant (Mann-whitney U test, p < 0.05) difference between populations. (B-C) All frequencies tested show significant differences (Welch’s T test, p < 0.05) between populations unless marked with “ns”, indicating no significant difference. (B) Comparison between wild-caught (light blue) and lab-raised (beige square) Honey Creek Cave fish. (C) Comparison between wild-caught (dark blue circle) and lab-raised (green square) Blue Hole fish.
Native cave and surface populations exhibited overall less sensitivity to sound pressure than the recently invaded populations (Figure 2D). Fish inhabiting subterranean environments appear to consistently detect frequencies between 600 and 700 kHz at lower sound pressure levels when compared to surface fish, indicating increased auditory sensitivity.
3.2. Particle acceleration thresholds
The threshold values determined from playback particle acceleration experiments (Figure 4A) revealed additional differences between populations. Honey Creek Cave fish were significantly more sensitive (Mann–Whitney U test, p < 0.05) to particle acceleration than Honey Creek surface fish between 0.4–0.8 kHz and at 3.0–4.0 kHz (Figure 4B). Wild-caught Blue Hole and San Pedro Springs fish both had significantly lower particle acceleration thresholds than wild-caught San Antonio Zoo surface fish between 0.5–0.7 (Pairwise Wilcox w/ Holm Adj., p < 0.05) (Figure 4C). In addition to this range, among wild-caught fish, Blue Hole fish were significantly more sensitive than San Antonio Zoo at 1.2 kHz (Pairwise Wilcox w/ Holm adjustment, p < 0.01), and San Pedro Springs fish were significantly more sensitive than San Antonio Zoo at 3.0 kHz (Pairwise Wilcox w/ Holm adjustment, p < 0.01).
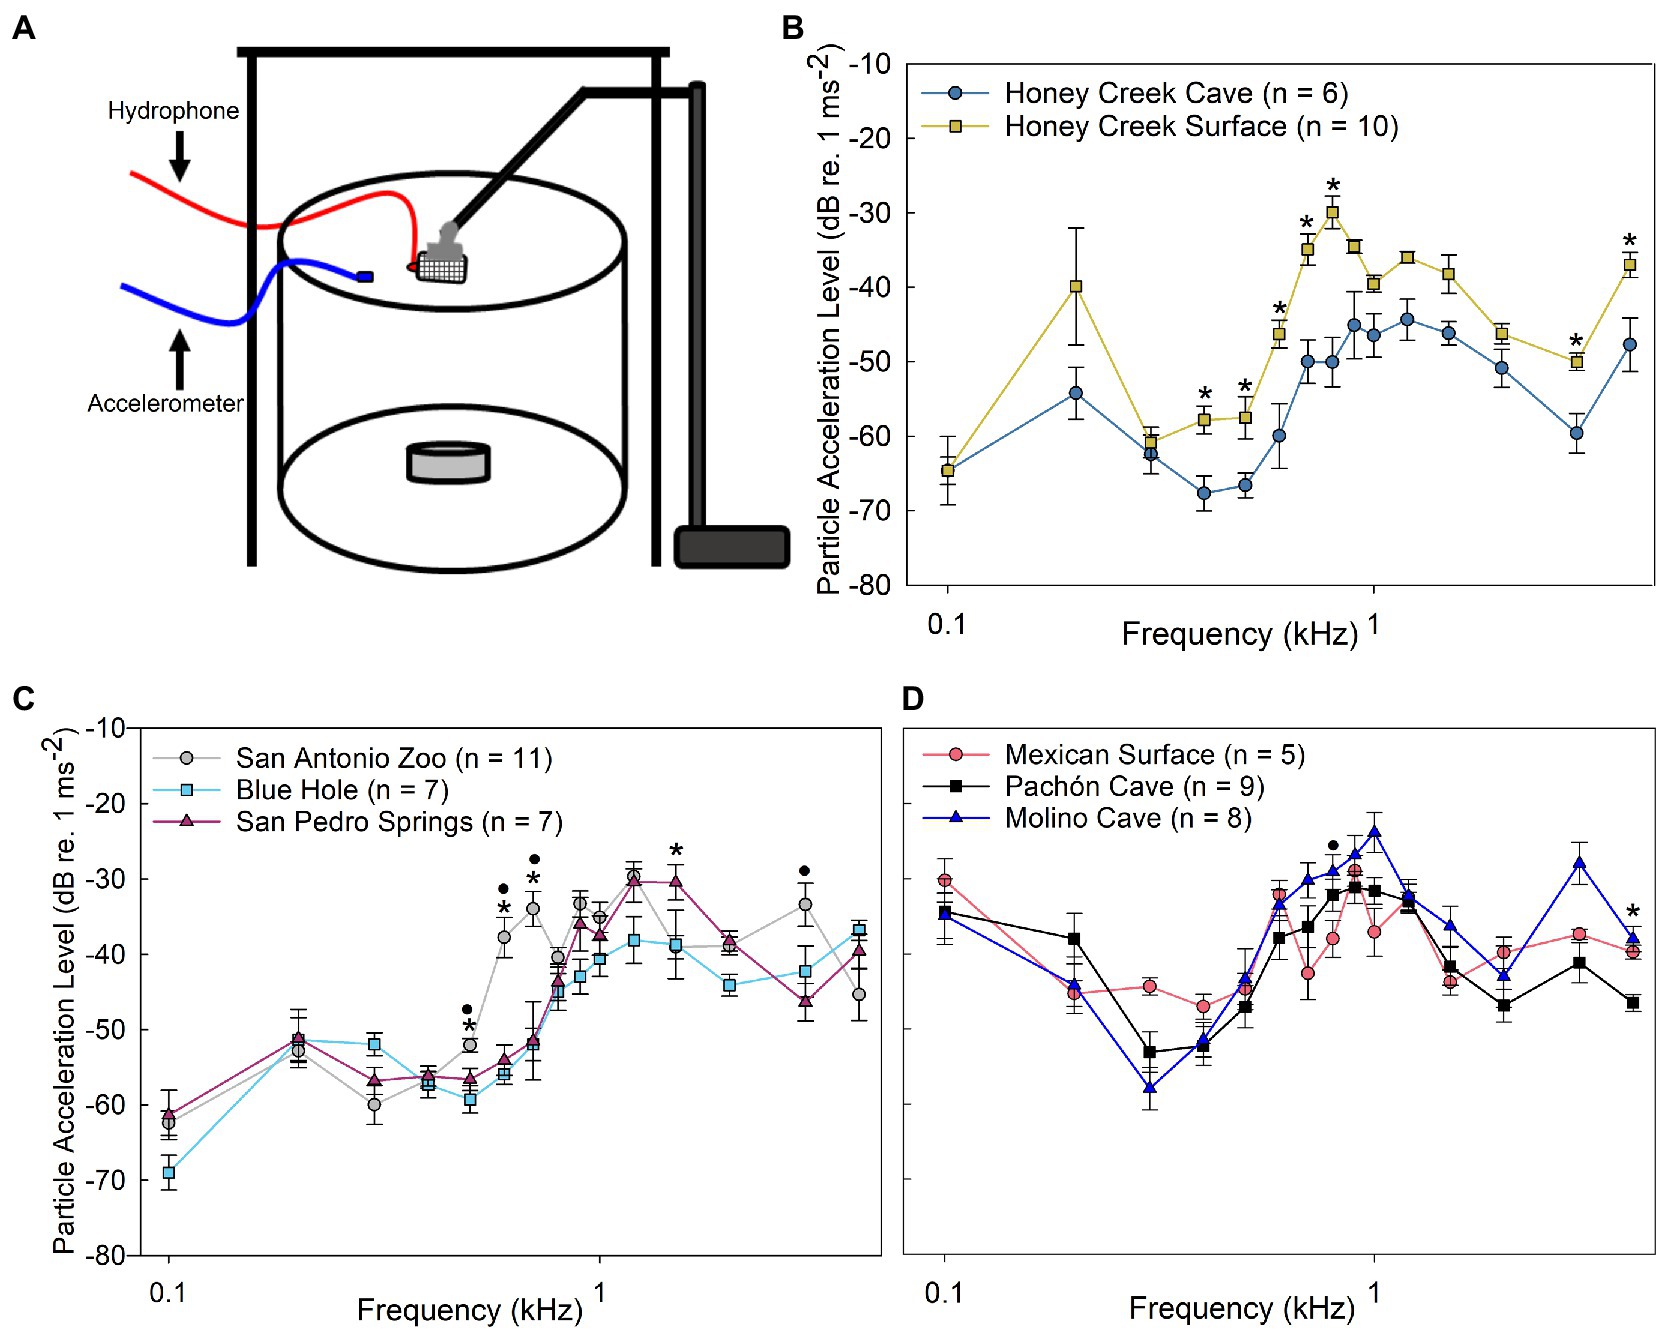
Figure 4. Particle acceleration levels. (A) Schematic of particle acceleration level (PAL) experimental setup. (B–D) Median auditory particle acceleration level (±SE) sensitivity compared between populations. (B) Comparison between Honey Creek Cave (dark blue circle) and Honey Creek surface (yellow square); asterisks (*) indicates a significant difference (Mann-Whitney U Test, p < 0.05) between populations. (C) Comparison between San Antonio Zoo (grey circle), Blue Hole (cyan square) and San Pedro Springs (magnenta triangle); A significant difference is defined as p < 0.05 using a Kruskal-Wallis test with post-hoc pairwise Wilcox w/ Holm Adjustment. Asterisks (*) indicate a significant difference between San Antonio Zoo and Blue Hole. A black circle (•) indicates a significant difference between San Antonio Zoo and San Pedro Springs. (D) Comparison between Mexican Surface (red circle), Molino Cave (black square) and Pachon Cave (blue traingle). A significant difference is defined as p < 0.05 using a Kruskal-Wallis test with post-hoc pairwise Wilcox w/ Holm adjustment. Asterisks (*) indicate a significant difference between Mexican surface and Pachon Cave. A black circle (•) indicates a significant difference between Mexican surface and Molino Cave.
Similar to the results seen in sound pressure level thresholds, all native Mexican cave and surface fish exhibited less overall particle acceleration level sensitivity than the recently invaded fish from Texas. While both Molino and Pachón cave fish demonstrated qualitatively higher sensitivities at lower frequencies (0.3–0.4 kHz), though this difference was not statistically significant from surface fish (Figure 4D). However, Molino cave fish were significantly more sensitive to particle acceleration at 0.8 kHz than Mexican surface (Pairwise Wilcox w/ Holm adjustment, p < 0.05), while Pachón cave fish were more sensitive than Mexican surface fish at 4.0 kHz (Pairwise Wilcox w/ Holm adjustment, p < 0.05).
When compared to wild-caught populations, lab-raised fish were less sensitive than wild-caught fish, especially in the Honey Creek Surface (Figure 5A) and Honey Creek Cave (Figure 5B) comparisons. At most frequencies wild-caught Blue Hole fish were more sensitive than the lab-raised individuals; however, lab-raised Blue Hole fish were significantly more sensitive than wild-caught fish at 4.0 kHz (Mann–Whitney U test, p < 0.05) (Figure 5C).
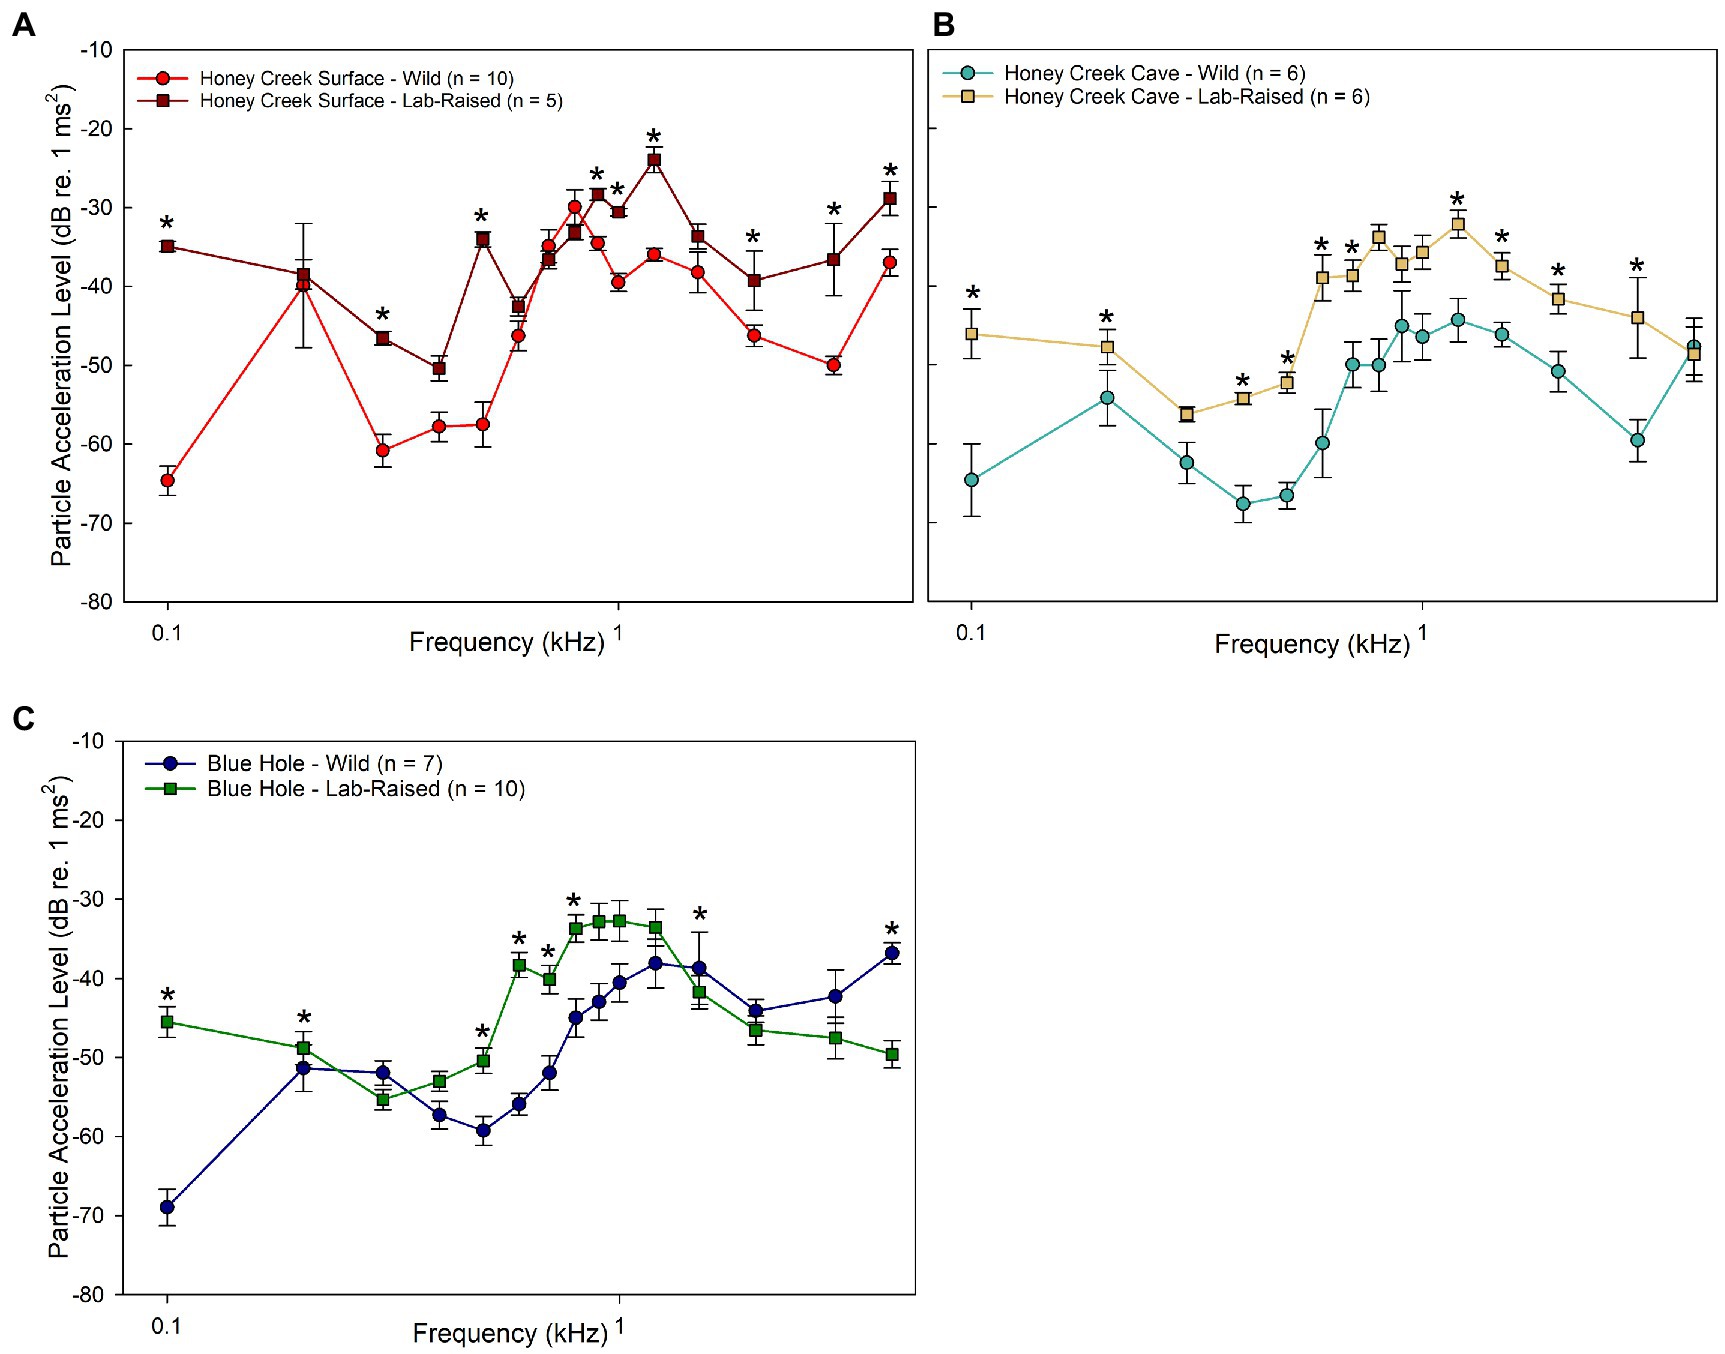
Figure 5. Wild-caught and lab-raised PAL thresholds. (A–C) Median auditory particle acceleration sensitivity (±SE) between wild-caught and lab-raised populations. Asterisks (*) indicate significant (Mann–Whitney U Test, p < 0.05) differences between populations. (A) Comparison between wild-caught (red circle) and lab-raised (brown square) Honey Creek Surface fish. (B) Comparison between wild-caught (light blue) and lab-raised (beige square) Honey Creek Cave fish. (C) Comparison between wild-caught (dark blue circle) and lab-raised (green square) Blue Hole Fish.
Taken holistically, it appears that wild-caught fish from subterranean environments were more sensitive to particle acceleration detection than wild-caught fish from surface habitats or those raised in the lab. The pattern of greater sensitivity among wild-caught cave-dwelling individuals than surface conspecifics is upheld both when comparing both sound pressure sensitivity in auditory evoked potentials thresholds and particle acceleration sensitivity in particle acceleration level thresholds. However, this sensitivity appears to be highly dependent on developmental environment.
3.3. Electroretinography thresholds
All populations were maximally sensitive to wavelengths between 500 and 600 nm. There were no significant differences between Honey Creek Cave and surface populations. There were also no significant differences in spectral sensitivity found between San Antonio Zoo surface, San Pedro Springs, and Blue Hole populations. We had expected cave-dwelling fish to be the less sensitive to light levels, which is maintained in the Honey Creek Cave and Honey Creek surface sensitivity curve comparison at 530 and 560 nm, albeit not at a significant level (Mann–Whitney U test, p = 0.054 at 530 nm, p = 0.055 at 560 nm; Supplementary Figure S5). However, comparisons between the surface population of San Antonio Zoo and the intermediate populations of San Pedro Springs and Blue Hole suggest that cave-dwelling fish were more sensitive than those living in surface habitats, as sensitivity curves (Supplementary Figure S5) seem to indicate that the San Pedro Springs population is the most sensitive to all wavelengths of light, followed by Blue Hole population, and ending with San Antonio Zoo population as the least sensitive of the three. Lab-raised populations were not tested since these wild-caught population differences were not significant.
4. Discussion
Phenotypic divergence is often contextualized using morphological features as indicators of change (Kozak et al., 2011). However, few studies examine changes in sensory thresholds due to the difficulty in quantifying the phenotypic features underlying sensory systems (Partan, 2017; Kelley et al., 2018). Recently diverged populations allow us to examine both precursors to evolution as well as phenotypic plasticity of sensory systems in response to environmental pressures. Here, we show clear auditory sensory divergence between two fish populations: Honey Creek Cave fish are significantly more sensitive to several frequencies of sound than Honey Creek surface fish. The two facultatively subterranean populations (San Pedro Springs and Blue Hole) were also more sensitive to certain frequencies than San Antonio Zoo surface fish. However, when comparing wild-caught fish to lab-raised progeny, it was evident that these traits are non-heritable and that auditory sensitivity is likely a plastic trait influenced by developmental environment. While most comparisons of retinal sensitivity were not statistically significant, qualitative examination of the ERG curves showed both recently introduced and partially subterranean populations trended toward increased sensitivity compared to surface fish. Taken together, these results delineate a relationship between sensory thresholds and environmental pressures in these recently established A. mexicanus populations.
4.1. Sound pressure and particle acceleration sensitivity
Few studies have been conducted on auditory sensitivities of cavefishes (Soares et al., 2016), and previous investigations examining auditory sensitivity between cave and surface fish have not found many physiological differences. For example, a previous study using avoidance conditioning techniques to determine sound thresholds indicated no significant differences in auditory sensitivities between cave and surface populations of Mexican A. mexicanus (Popper, 1970). Although a separate study between cave and surface populations of the Atlantic Molly (Poecilia mexicana) showed differences in otolith morphology, AEP experiments were unable to detect any differences in auditory sensitivity (Schulz-Mirbach et al., 2010). However, while both cave and surface amblyopsid fish exhibit similar auditory sensitivity to pure tones up to 800 Hz, only surface fish were able to detect frequencies >800 Hz, suggesting cave amblyopsids may have lost higher frequency sensitivity in response to high frequency noise in caves (Niemiller et al., 2013). Our data corroborates and provides additional evidence of this low-frequency sensitivity, while also showing significant differences between cave and subterranean dwelling fish.
While many previous AEP experiments only reported sound pressure measurements, it is imperative to report particle motion as all fish can detect the particle motion component of sound (Ladich and Fay, 2013), therefore both methods are included here to allow comparison with previous studies. Our results indicate that wild-caught cave populations are more sensitive to particle acceleration than sound pressure when compared to surface conspecifics. The only previous study which has measured cave fish particle motion sensitivity was done comparing cave and surface ecotypes of P. mexicana and found no significant difference in particle motion sensitivity between the two ecotypes (Schulz-Mirbach et al., 2010). Further examination of particle motion sensitivity should be pursued to better understand the relevancy of this modality of sound detection in cave soundscapes. While we acknowledge the limitations of AEPs since physiological responses do not necessarily equate to active perception or match with thresholds found in behavioral studies (Popper et al., 2019), we used this methodology because it is minimally invasive and can still provide important insights on sensory perception (Ladich and Fay, 2013).
When comparing auditory sensitivity, we found that wild-caught fish were generally more sensitive to particle acceleration and sound pressure level than their lab-raised descendants, with the exception being that both lab-raised and wild-caught Honey Creek Surface population fish had similar sound pressure level sensitivity thresholds. However, we observed no consistent patterns when comparing lab-raised and wild-caught populations. We suggest that auditory sensitivity is a trait that exhibits phenotypic plasticity, and that the differences observed among populations in this study are not likely the result of genetic differences. Behavioral and phenotypic plasticity has been suggested as an evolutionary adaptation to environmental variation (Sommer, 2020). Adaptive plasticity is well studied across several organisms in response to both sensory deprivation and sensory stimulation in lab environments (Bharmauria et al., 2022). Additionally, previous studies have demonstrated that both A. mexicanus surface and cave ecotypes express rapid behavioral and morphological responses to environmental conditions (Bilandžija et al., 2020; Espinasa et al., 2021). While the results presented do not indicate that auditory sensitivity is an adaptive phenotype in recently established populations, highly plastic organisms may be better suited to colonize novel selective landscapes and sensory plasticity may play a role in convergent troglomorphic traits.
It should be noted that this data is presented with the caveat that individual fish were not of the same age during data collection. Wild-caught fish were maintained in the lab for over a year prior to testing and aging of these individuals was prohibitive due to the large sample sizes needed for accurate age validation (Campana, 2001).The age of experimental organisms can critically affect results when collecting neurological data (McCutcheon and Marinelli, 2009), therefore we encourage future iterations of this work to control for age between tested individuals.
4.2. Visual sensitivity trends
Honey Creek Cave fish showed no significant difference in sensitivity when compared to Honey Creek surface fish, although Honey Creek Cave fish did have readings that indicated less visual sensitivity. While the Blue Hole population, San Pedro Springs populations, and San Antonio Zoo surface fish have remarkably similar ERG curves, at wavelengths greater than 575 nm, San Pedro Springs were most sensitive to light stimuli, followed by Blue Hole, then San Antonio Zoo. The genetic underpinnings of vision in A.mexicanus has been heavily studied in order to trace back the eyeless phenotype seen in cave ecotype fish (Dowling et al., 2002; O’Quin et al., 2013; McGaugh et al., 2014; Krishnan and Rohner, 2017). However, such studies have not explored the plasticity of the visual system. In general, there exists a gap in the literature exploring candidate genes that control plastic traits. The authors propose that methods using genomic sequencing and QTL mapping to characterize traits such as metabolic function (Carlson et al., 2018; Riddle et al., 2021) can be similarly applied to questions regarding sensory trait plasticity.
While newly invaded cave populations have not previously been examined for eye function, deep water fish similarly inhabit low-light environments. Unlike cave organisms, who have lost use of their visual system in dark cave environments, deep water oceanic fish have evolved elaborate retinal specialization to detect downwelling light (Collin and Partridge, 1996; Warrant and Locket, 2004) and bioluminescent organisms (Locket, 1970). Similarly, the dim light, found in the transition (twilight) zone between the cave mouth and perpetually dark recesses may select initially for increased scotopic vision.
4.3. Environmental factors of sensory divergence
The geology of Honey Creek Cave may play a large role in the divergence seen between Honey Creek Cave fish and their surface counterparts. Honey Creek Cave is the longest cave system in Texas (Veni, 1994) and its current surveyed length exceeds 30 km, with extensive subterranean stream habitat (Reddell, 1964), although A. mexicanus have only been observed in the first 200 m of stream passage (A. Gluesenkamp, pers. observation). Our results suggest that there are changes in both auditory and visual sensitivity between Honey Creek surface and Honey Creek Cave populations. The amount of change in sensitivity may be tempered by both the recent colonization of this environment and potential continual gene flow between cave and surface populations. While surface individuals were collected 1,500 m from the cave mouth, the cave population was sampled within 100 m of the cave entrance. Further studies on the migration of cave and surface fish between environments need to be conducted. Additionally, while Honey Creek Cave and Honey Creek surface populations may experience physical barriers to gene flow between surface and subterranean habitats, populations at the other sites enjoy ephemeral to perennial access to subterranean and surface environments. Therefore, it is not surprising that San Pedro Springs and Blue Hole populations displayed intermediate auditory sensitivities compared to Honey Creek cave and San Antonio surface fish.
The recent establishment of A. mexicanus populations in Central Texas provides a unique opportunity to observe potential rapid sensory divergence occurring over a period of less than a century. Our data suggests that divergence is primarily influenced by environment and is more pronounced in auditory sensitivity rather than vision, with increased auditory sensitivity in subterranean populations compared to surface conspecifics. However, further genetic and genomic work will be necessary to exclude the genetic determination of such traits and better characterize the plasticity of the adaptable A.mexicanus.
Data availability statement
The raw data supporting the conclusions of this article will be made available by the authors, without undue reservation.
Ethics statement
The animal study was reviewed and approved by the University of Minnesota the Institutional Animal Care and Use Committee (IACUC).
Author contributions
AM, SM, RP, and ME contributed to the conception and design of the study. RP, AM, and AG significantly contributed to the methodology. AG, NS, and SM conducted specimen collection. ME and TT performed data collection and analysis. ME wrote the first draft of the manuscript. All authors contributed to manuscript revision, read, and approved the submitted version.
Funding
Funds from NSF IOS-1933076 and IOS-1933428 were used to support ME during manuscript writing process and data analysis. The Diversity of Views and Experiences (DOVE) Fellowship from the University of Minnesota funded ME during data collection.
Acknowledgments
We thank Loranzie Rogers for advice regarding electroretinography methodology. We thank Joyce Moore for generously providing access to Honey Creek Cave and Texas Parks and Wildlife Department for providing access to Honey Creek State Natural Area. Aimee Beveridge, Jessica Gordon, Geoff Hoese, Bennett Lee, and Jack, Leah, and Ruby Gluesenkamp aided in the field. Ariana Duffey, Bekky Muscher-Hodges, Mason Lee, Brittany Nunn, and Kamryn Richard provided invaluable logistical support for fieldwork. Amanda Kistner, Alex Donny, and Catherine Rossman assisted with fish care and transportation.
Conflict of interest
The authors declare that the research was conducted in the absence of any commercial or financial relationships that could be construed as a potential conflict of interest.
Publisher’s note
All claims expressed in this article are solely those of the authors and do not necessarily represent those of their affiliated organizations, or those of the publisher, the editors and the reviewers. Any product that may be evaluated in this article, or claim that may be made by its manufacturer, is not guaranteed or endorsed by the publisher.
Supplementary material
The Supplementary material for this article can be found online at: https://www.frontiersin.org/articles/10.3389/fevo.2023.1085975/full#supplementary-material
Footnotes
References
Badino, G., and Chignola, R. (2019). Fluctuations of atmospheric pressure and the sound of underground karst systems: the Antro del Corchia case (Apuane Alps, Italy). Front. Earth Sci. 7:147. doi: 10.3389/feart.2019.00147
Bharmauria, V., Ouelhazi, A., Lussiez, R., and Molotchnikoff, S. (2022). Adaptation-induced plasticity in the sensory cortex. J. Neurophysiol. 128, 946–962. doi: 10.1152/jn.00114.2022
Bilandžija, H., Hollifield, B., Steck, M., Meng, G., Ng, M., Koch, A. D., et al. (2020). Phenotypic plasticity as a mechanism of cave colonization and adaptation. eLife 9:e51830. doi: 10.7554/eLife.51830
Blin, M., Fumey, J., Lejeune, C., Policarpo, M., Leclercq, J., Père, S., et al. (2020). Diversity of olfactory responses and skills in Astyanax mexicanus cavefish populations inhabiting different caves. Diversity 12, 1–21. doi: 10.3390/d12100395
Borowsky, R. (2008). Breeding Astyanax mexicanus through natural spawning. CSH protocols. 2008:pdb.prot5091. doi: 10.1101/pdb.prot5091
Bradic, M., Teotónio, H., and Borowsky, R. L. (2013). The population genomics of repeated evolution in the blind cavefish Astyanax mexicanus. Mol. Biol. Evol. 30, 2383–2400. doi: 10.1093/molbev/mst136
Brown, W. H. (1953). Introduced fish species of the Guadalupe River Basin. Texas J. Sci. 5, 245–251.
Campana, S. E. (2001). Accuracy, precision and quality control in age determination, including a review of the use and abuse of age validation methods. J. Fish Biol. 59, 197–242. doi: 10.1111/j.1095-8649.2001.tb00127.x
Carlson, B. M., Klingler, I. B., Meyer, B. J., and Gross, J. B. (2018). Genetic analysis reveals candidate genes for activity QTL in the blind Mexican tetra, Astyanax mexicanus. PeerJ 6:e5189. doi: 10.7717/peerj.5189
Carvalho, A. P., and Sousa, J. I. (2015). Acoustical characterization of touristic caves in Portugal. Proc. Meetings Acoustics 25, 1–10. doi: 10.1121/2.0000115
Collin, S. P., and Partridge, J. C. (1996). Retinal specializations in the eyes of deep-sea teleosts. J. Fish Biol. 49, 157–174. doi: 10.1111/j.1095-8649.1996.tb06073.x
Constable, H., Guralnick, R., Wieczorek, J., Spencer, C., Peterson, A. T., Bart, H., et al. (2010). VertNet: a new model for biodiversity data sharing. PLoS Biol. 8:e1000309. doi: 10.1371/journal.pbio.1000309
Dowling, T. E., Martasian, D. P., and Jeffery, W. R. (2002). Evidence for multiple genetic forms with similar eyeless phenotypes in the blind cavefish, Astyanax mexicanus. Mol. Biol. Evol. 19, 446–455. doi: 10.1093/oxfordjournals.molbev.a004100
Dunlop, E. S., McLaughlin, R., Adams, J. V., Jones, M., Birceanu, O., Christie, M. R., et al. (2018). Rapid evolution meets invasive species control: the potential for pesticide resistance in sea lamprey. Can. J. Fish. Aquat. Sci. 75, 152–168. doi: 10.1139/cjfas-2017-0015
Endler, J. A. (1980). Natural selection on color patterns in Poecilia reticulata. Evolution 34, 76–91. doi: 10.1111/j.1558-5646.1980.tb04790.x
Endler, J. A., and Basolo, A. L. (1998). Sensory ecology, receiver biases and sexual selection. Trends Ecol. Evol. 13, 415–420. doi: 10.1016/S0169-5347(98)01471-2
Espinasa, L., Heintz, C., Rétaux, S., Yoshisawa, M., Agnès, F., Ornelas-Garcia, P., et al. (2021). Vibration attraction response is a plastic trait in blind Mexican tetra (Astyanax mexicanus), variable within subpopulations inhabiting the same cave. J. Fish Biol. 98, 304–316. doi: 10.1111/jfb.14586
Espinasa, L., Legendre, L., Fumey, J., Blin, M., Rétaux, S., and Espinasa, M. (2018). A new cave locality for Astyanax cavefish in Sierra de El Abra, Mexico. Subterr. Biol. 26, 39–53. doi: 10.3897/subtbiol.26.26643
Gilbert, M. C., Akama, A., Fernandes, C. C., and Albertson, R. C. (2020). Rapid morphological change in multiple cichlid ecotypes following the damming of a major clearwater river in Brazil. Evol. Appl. 13, 2754–2771. doi: 10.1111/eva.13080
Gross, J. B. (2012). The complex origin of Astyanax cavefish. BMC Evol. Biol. 12:105. doi: 10.1186/1471-2148-12-105
Herman, A., Brandvain, Y., Weagley, J., Jeffery, W. R., Keene, A. C., Kono, T. J. Y., et al. (2018). The role of gene flow in rapid and repeated evolution of cave-related traits in Mexican tetra, Astyanax mexicanus. Mol. Ecol. 27, 4397–4416. doi: 10.1111/mec.14877
Hyacinthe, C., Attia, J., and Rétaux, S. (2019). Evolution of acoustic communication in blind cavefish. Nat. Commun. 10:4231. doi: 10.1038/s41467-019-12078-9
Iannace, G., and Trematerra, A. (2014). The acoustics of the caves. Appl. Acoust. 86, 42–46. doi: 10.1016/j.apacoust.2014.05.004
Jeffery, W. R. (2001). Cavefish as a model system in evolutionary developmental biology. Dev. Biol. 231, 1–12. doi: 10.1006/dbio.2000.0121
Jeffery, W. R. (2020). Astyanax surface and cave fish morphs. EvoDevo 11:14. doi: 10.1186/s13227-020-00159-6
Kelley, J. L., Grierson, P. F., Collin, S. P., and Davies, P. M. (2018). Habitat disruption and the identification and management of functional trait changes. Fish Fish. 19, 716–728. doi: 10.1111/faf.12284
Kozak, M., Bocianowski, J., Liersch, A., Tartanus, M., Bartkowiak-Broda, I., Piotto, F. A., et al. (2011). Genetic divergence is not the same as phenotypic divergence. Mol. Breed. 28, 277–280. doi: 10.1007/s11032-011-9583-9
Krishnan, J., and Rohner, N. (2017). Cavefish and the basis for eye loss. Philos. Trans. R. Soc. Lond. B Biol. Sci. 372:20150487. doi: 10.1098/rstb.2015.0487
Ladich, F., and Fay, R. R. (2013). Auditory evoked potential audiometry in fish. Rev. Fish Biol. Fish. 23, 317–364. doi: 10.1007/s11160-012-9297-z
Laurentino, T. G., Moser, D., Roesti, M., Ammann, M., Frey, A., Ronco, F., et al. (2020). Genomic release-recapture experiment in the wild reveals within-generation polygenic selection in stickleback fish. Nat. Commun. 11:1928. doi: 10.1038/s41467-020-15657-3
Lee, N. M., Meisinger, D. B., Aubrecht, R., Kovačik, L., Saiz-Jimenez, C., Baskar, S., et al. (2012). “Caves and karst environments” in Life at extremes: environments, organisms and strategies for survival. ed. E. M. Bell (Wallingford: CABI Publishing), 320–344.
Lloyd, E., Olive, C., Stahl, B. A., Jaggard, J. B., Amaral, P., Duboué, E. R., et al. (2018). Evolutionary shift towards lateral line dependent prey capture behavior in the blind Mexican cavefish. Dev. Biol. 441, 328–337. doi: 10.1016/j.ydbio.2018.04.027
Locket, N. A. (1970). Deep sea fish retinas. Br. Med. Bull. 26, 107–111. doi: 10.1093/oxfordjournals.bmb.a070759
McCutcheon, J. E., and Marinelli, M. (2009). Age matters. Eur. J. Neurosci. 29, 997–1014. doi: 10.1111/j.1460-9568.2009.06648.x
McGaugh, S., Gross, J., Aken, B., Blin, M., Borowsky, R., Chalopin, D., et al. (2014). The cavefish genome reveals candidate genes for eye loss. Nat. Commun. 5:5307. doi: 10.1038/ncomms6307
McGaugh, S. E., Weaver, S., Gilbertson, E. N., Garrett, B., Rudeen, M. L., Grieb, S., et al. (2020). Evidence for rapid phenotypic and behavioural shifts in a recently established cavefish population. Biol. J. Linn. Soc. 129, 143–161. doi: 10.1093/biolinnean/blz162
Nakatani, M., Miya, M., Mabuchi, K., Saitoh, K., and Nishida, M. (2011). Evolutionary history of Otophysi (Teleostei), a major clade of the modern freshwater fishes: Pangaean origin and Mesozoic radiation. BMC Evol. Biol. 11:177. doi: 10.1186/1471-2148-11-177
Niemiller, M. L., Higgs, D. M., and Soares, D. (2013). Evidence for hearing loss in amblyopsid cavefishes. Biol. Lett. 9:20130104. doi: 10.1098/rsbl.2013.0104
Niemiller, M. L., and Soares, D. (2015). “Cave environments” in Extremophile fishes: ecology, evolution, and physiology of teleosts in extreme environments. eds. M. Plath, R. Rüdiger, and M. Tobler (Cham: Springer International Publishing), 161–191.
O’Quin, K. E., Yoshizawa, M., Doshi, P., and Jeffery, W. R. (2013). Quantitative genetic analysis of retinal degeneration in the blind cavefish Astyanax mexicanus. PLoS One 8:e57281. doi: 10.1371/journal.pone.0057281
Parks, S. E., Miksis-Olds, J. L., and Denes, S. L. (2014). Assessing marine ecosystem acoustic diversity across ocean basins. Eco. Inform. 21, 81–88. doi: 10.1016/j.ecoinf.2013.11.003
Partan, S. R. (2017). Multimodal shifts in noise: switching channels to communicate through rapid environmental change. Anim. Behav. 124, 325–337. doi: 10.1016/j.anbehav.2016.08.003
Patton, P., Windsor, S., and Coombs, S. (2010). Active wall following by Mexican blind cavefish (Astyanax mexicanus). J. Comp. Physiol. A Neuroethol. Sens. Neural Behav. Physiol. 196, 853–867. doi: 10.1007/s00359-010-0567-8
Pipan, T., and Culver, D. C. (2012). Convergence and divergence in the subterranean realm: a reassessment. Biol. J. Linn. Soc. 107, 1–14. doi: 10.1111/j.1095-8312.2012.01964.x
Popper, A. N. (1970). Auditory capacities of the Mexican blind cavefish (Astyanax jordani) and its eyed ancestor (Astyanax mexicanus). Anim. Behav. 18, 552–562. doi: 10.1016/0003-3472(70)90052-7
Popper, A. N., Hawkins, A. D., Sand, O., and Sisneros, J. A. (2019). Examining the hearing abilities of fishes. J. Acoust. Soc. Am. 146, 948–955. doi: 10.1121/1.5120185
Porter, M. L., Dittmar, K., and Pérez-Losada, M. (2007). How long does evolution of the troglomorphic form take? Estimating divergence times in Astyanax mexicanus. Acta Carsol. 36, 173–182. doi: 10.3986/ac.v36i1.219
Protas, M., and Jeffery, W. R. (2012). Evolution and development in cave animals: from fish to crustaceans. Wiley Interdiscip. Rev. Dev. Biol. 1, 823–845. doi: 10.1002/wdev.61
Protas, M., Tabansky, I., Conrad, M., Gross, J. B., Vidal, O., Tabin, C. J., et al. (2008). Multi-trait evolution in a cave fish, Astyanax mexicanus. Evol. Dev. 10, 196–209. doi: 10.1111/j.1525-142X.2008.00227.x
Puechmaille, S. J., Gouilh, M. A., Piyapan, P., Yokubol, M., Mie, K. M., Bates, P. J., et al. (2011). The evolution of sensory divergence in the context of limited gene flow in the bumblebee bat. Nat. Commun. 2:573. doi: 10.1038/ncomms1582
Putland, R. L., and Mensinger, A. F. (2020). Exploring the soundscape of small freshwater lakes. Eco. Inform. 55:101018. doi: 10.1016/j.ecoinf.2019.101018
R Core Team (2022). R: A language and environment for statistical computing. R Foundation for Statistical Computing, Vienna, Austria. Available at: https://www.R-project.org/
Recknagel, H., and Trontelj, P. (2022). From cave dragons to genomics: advancements in the study of subterranean Tetrapods. Bioscience 72, 254–266. doi: 10.1093/biosci/biab117
Riddle, M. R., Aspiras, A., Damen, F., McGaugh, S. E., Tabin, J. A., and Tabin, C. J. (2021). 2021 genetic mapping of metabolic traits in the blind Mexican cavefish reveals sex-dependent quantitative trait loci associated with cave adaptation. BMC Ecol Evol. 21:94. doi: 10.1186/s12862-021-01823-8
Schulz-Mirbach, T., Ladich, F., Mittone, A., Olbinado, M., Bravin, A., Maiditsch, I. P., et al. (2020). Auditory chain reaction: effects of sound pressure and particle motion on auditory structures in fishes. PLoS One 15:e0230578. doi: 10.1371/journal.pone.0230578
Schulz-Mirbach, T., Ladich, F., Riesch, R., and Plath, M. (2010). Otolith morphology and hearing abilities in cave- and surface-dwelling ecotypes of the Atlantic molly, Poecilia mexicana (Teleostei: Poeciliidae). Hear. Res. 267, 137–148. doi: 10.1016/j.heares.2010.04.001
Seehausen, O., Terai, Y., Magalhaes, I. S., Carleton, K. L., Mrosso, H. D. J., Miyagi, R., et al. (2008). Speciation through sensory drive in cichlid fish. Nature 455, 620–626. doi: 10.1038/nature07285
Sharma, S., Coombs, S., Patton, P., and de Perera, T. B. (2009). The function of wall-following behaviors in the Mexican blind cavefish and a sighted relative, the Mexican tetra (Astyanax). J. Comp. Physiol. A Neuroethol. Sens. Neural Behav. Physiol. 195, 225–240. doi: 10.1007/s00359-008-0400-9
Soares, D., and Niemiller, M. L. (2020). Extreme adaptation in caves. Anat. Rec. 303, 15–23. doi: 10.1002/ar.24044
Soares, D., Niemiller, M. L., and Higgs, D. M. (2016). Hearing in cavefishes. Adv. Exp. Med. Biol. 877, 187–195. doi: 10.1007/978-3-319-21059-9_9
Sommer, R. J. (2020). Phenotypic plasticity: from theory and genetics to current and future challenges. Genetics 215, 1–13. doi: 10.1534/genetics.120.303163
Tait, C., Kharva, H., Schubert, M., Kritsch, D., Sombke, A., Rybak, J., et al. (2021). A reversal in sensory processing accompanies ongoing ecological divergence and speciation in Rhagoletis pomonella. Proc. R. Soc. B Biol. Sci. 288:20210192. doi: 10.1098/rspb.2021.0192
Varatharasan, N., Croll, R. P., and Franz-Odendaal, T. (2009). Taste bud development and patterning in sighted and blind morphs of Astyanax mexicanus. Dev. Dyn. 238, 3056–3064. doi: 10.1002/dvdy.22144
Veni, G. (1994). “Hyrdogeology and evolution of caves and karst in the Southwestern Edwards Paleau, Texas” in The caves and karst of Texas. eds. W. R. Elliott and G. Veni (Huntsville, AL: National Speleological Society), 13–30.
Vetter, B. J., Brey, M. K., and Mensinger, A. F. (2018). Reexamining the frequency range of hearing in silver (Hypophthalmichthys molitrix) and bighead (H. nobilis) carp. PLoS One 13:e0192561. doi: 10.1371/journal.pone.0192561
Warrant, E. J., and Locket, N. A. (2004). Vision in the deep sea. Biol. Rev. Cam. Philos. Soc. 79, 671–712. doi: 10.1017/S1464793103006420
Wilkens, H. (1988). “Evolution and genetics of epigean and cave Astyanax fasciatus (Characidae, Pisces): support for the neutral mutation theory” in Evolutionary Biology. eds. M. K. Hecht and B. Wallace (Boston, MA: Plenum Publishing Corporation), 271–367.
Wilkens, H., and Strecker, U. (2017). “Regressive and constructive traits in Astyanax surface and cave fish” in Evolution in the dark: Darwin’s loss without selection (Berlin Heidelberg: Springer), 79–189.
Xiong, S., Krishnan, J., Peuß, R., and Rohner, N. (2018). Early adipogenesis contributes to excess fat accumulation in cave populations of Astyanax mexicanus. Dev. Biol. 441, 297–304. doi: 10.1016/j.ydbio.2018.06.003
Yamamoto, Y., Byerly, M. S., Jackman, W. R., and Jeffery, W. R. (2009). Pleiotropic functions of embryonic sonic hedgehog expression link jaw and taste bud amplification with eye loss during cavefish evolution. Dev. Biol. 330, 200–211. doi: 10.1016/j.ydbio.2009.03.003
Yoshizawa, M. (2016). “The evolution of sensory adaptation in Astyanax mexicanus” in Biology and evolution of the Mexican cavefish. eds. A. C. Keene, M. Yoshizawa, and S. E. McGaugh (Amsterdam: Elsevier Inc.), 247–267.
Yoshizawa, M., Gorički, Š., Soares, D., and Jeffery, W. R. (2010). Evolution of a behavioral shift mediated by superficial neuromasts helps cavefish find food in darkness. Curr. Biol. 20, 1631–1636. doi: 10.1016/j.cub.2010.07.017
Yoshizawa, M., Jeffery, W. R., van Netten, S. M., and McHenry, M. J. (2014). The sensitivity of lateral line receptors and their role in the behavior of Mexican blind cavefish (Astyanax mexicanus). J. Exp. Biol. 217, 886–895. doi: 10.1242/jeb.094599
Keywords: Astyanax mexicanus, auditory, vision, divergence, phenotype, environment, sensory ecology
Citation: Enriquez MS, Swanson N, Putland RL, Tait T, Gluesenkamp AG, McGaugh SE and Mensinger AF (2023) Evidence for rapid divergence of sensory systems between Texas populations of the Mexican tetra (Astyanax mexicanus). Front. Ecol. Evol. 11:1085975. doi: 10.3389/fevo.2023.1085975
Edited by:
Enrico Lunghi, University of L'Aquila, ItalyReviewed by:
Nicholas Planidin, UMR5175 Centre d'Ecologie Fonctionnelle et Evolutive (CEFE), FranceCristiano Bertolucci, University of Ferrara, Italy
Copyright © 2023 Enriquez, Swanson, Putland, Tait, Gluesenkamp, McGaugh and Mensinger. This is an open-access article distributed under the terms of the Creative Commons Attribution License (CC BY). The use, distribution or reproduction in other forums is permitted, provided the original author(s) and the copyright owner(s) are credited and that the original publication in this journal is cited, in accordance with accepted academic practice. No use, distribution or reproduction is permitted which does not comply with these terms.
*Correspondence: Maya S. Enriquez, ✉ enriq074@umn.edu