De novo Transcriptome Assembly of the Clown Anemonefish (Amphiprion percula): A New Resource to Study the Evolution of Fish Color
 Alexander K. Maytin
 Sarah W. Davies
 Gabriella E. Smith
 Sean P. Mullen
 Peter M. Buston
- Department of Biology and Marine Program, Boston University, Boston, MA, United States
A fundamental question of evolutionary biology is, why are some animals conspicuously colored? This question may be addressed from both a proximate (genetic and ontogenetic) and ultimate (adaptive value and evolutionary origins) perspective, and integrating these perspectives can provide further insights. Over the last few decades we have made great advances in understanding the causes of conspicuous coloration in terrestrial systems, e.g., birds and butterflies, but we still know relatively little about the causes of conspicuous, “poster” coloration in coral reef fishes. Of all coral reef fishes, the clownfish Amphiprion percula, is perhaps the most conspicuously colored, possessing a bright orange body with three iridescent white bars bordered with pitch black. Here, we review what is known about the proximate and ultimate causes of the conspicuous coloration of clownfishes Amphiprion sp.: coloration has a heritable genetic basis; coloration is influenced by development and environment; coloration has multiple plausible signaling functions; there is a phylogenetic component to coloration. Subsequently, to provide new insights into the genetic mechanisms and potential functions of A. percula coloration we (i) generate the first de novo transcriptome for this species, (ii) conduct differential gene expression analyses across different colored epidermal tissues, and (iii) conduct gene ontology (GO) enrichment analyses to characterize function of these differentially expressed genes. BUSCO indicated that transcriptome assembly was successful and many genes were found to be differentially expressed between epidermal tissues of different colors. In orange tissue, relative to white and black, many GO terms associated with muscle were over-represented. In white tissue, relative to orange and black tissue, there were very few over- or under-represented GO terms. In black tissue, relative to orange and white, many GO terms related to immune function were over-represented, supporting the hypothesis that black (melanin) coloration may serve a protective function. Overall, this study presents the assembly of the A. percula transcriptome, and represents a first step in an integrative investigation of the proximate and ultimate causes of conspicuous coloration of this iconic coral reef fish.
Introduction
Conspicuous coloration is widespread throughout the animal kingdom, yet represents an evolutionary paradox because high visibility should increase predation risk (Ruxton et al., 2004). Decades of research on coloration, however, has produced compelling insights into both the proximate (genetic and ontogenetic; Hoekstra et al., 2006; Rosenblum et al., 2010; Reed et al., 2011; Gallant et al., 2014; Kunte et al., 2014) and the ultimate (Guilford, 1988; Alatalo and Mappes, 1996; Joron and Mallet, 1998; Sherratt and Beatty, 2003; Dale et al., 2015; adaptive value and evolutionary origins) causes of animal coloration (Hill and McGraw, 2006a,b; Hubbard et al., 2010; Kronforst et al., 2012; Cuthill et al., 2017; Endler and Mappes, 2017). The vast majority of work on color pattern formation has been conducted in terrestrial systems, despite the fact that some marine groups, e.g., coral reef fishes (Longley, 1917; Lorenz, 1962), express a tremendous diversity of color pattern variation paralleling that of the most diverse terrestrial groups. Among the coral reef fishes, the clownfishes of the genus Amphiprion are perhaps the best known and most conspicuously colored (Figure 1).
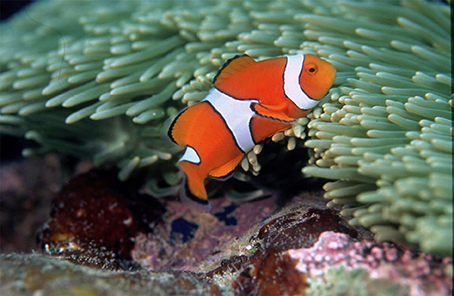
Figure 1. Photo of the clown anemonefish Amphiprion percula, illustrating the conspicuous orange, white and black coloration of the genus. In fishes, chromatophores, containing either colored droplets (xanthophores and erythrophores) reflecting organelles (iridophores) or pigment granules (melanophores), are responsible for skin coloration. In Amphiprion, the orange color is carotenoid based, the white color (which also reflects in the UV) is likely a structural color based on intracellular stacks of guanine crystals, and the black color is melanin based. Coloration of other members of the genus can be seen on FishBase (Froese and Pauly, 2018). [http://www.fishbase.org/identification/SpeciesList.php?genus=Amphiprion].
Considering the proximate causes of variation in Amphiprion coloration, various lines of evidence indicate it has a heritable genetic basis. First, substantial interspecific variation in color pattern exists among the 29 species (Allen, 1972; Fautin and Allen, 1992; Froese and Pauly, 2018): the coloration of the body and fins ranges from yellow to orange, pink to red, brown to black; the fish have zero to three distinct white bars on the body, that can reflect UV (Buston, unpublished data). Second, hybrids, found in the wild and produced in the lab, have intermediate or unusual color patterns (Marliave, 1985; Litsios and Salamin, 2014; Pedersen, 2014a; Dibattista et al., 2015; Gainsford et al., 2015; Balamurugan et al., 2017). Third, there is substantial intraspecific variation in color pattern associated with genetic divergence among populations (A. clarkii, Moyer, 1976; Bell et al., 1982; A. melanopus, Drew et al., 2008). Finally, unusual color patterns arising spontaneously via mutation can be artificially selected in the lab (Pedersen, 2014b; Talbot, 2014).
Developmental color variation also occurs in Amphiprion (Fautin and Allen, 1992). In A. percula, larval settlers are pinkish in color with a single white bar, and only acquire the conspicuous orange coloration, with three white bars, bordered with black, once the fish have successfully recruited to a group (Buston, personal observation). In A. percula and A. ocellaris, the development of the white bars is influenced by diet and stocking density (Avella et al., 2007; Chambel et al., 2015); in A. ocellaris, dietary carotenoids influence orange hue, saturation and brightness (Tanaka et al., 1992; Yasir and Qin, 2010; Ho et al., 2014; also A. frenatus, Hekimoglu et al., 2017), as does the light environment in which the fish are kept (Yasir and Qin, 2009a,b); in multiple species (A. chrysopterus, A. clarkii, A. percula, A. polymnus) a varying combination of island location, depth, anemone species, anemone size, and social rank are associated with variation in melanism (Moyer, 1976; Militz et al., 2016).
The ultimate causes of coloration in Amphiprion are less clear because there have been no explicit tests of alternative hypotheses for the adaptive value of the color pattern traits, e.g., quality, attractiveness, strategy, genetic compatibility, kinship, individual identity or presence (Dale, 2006). It is possible, however, to gain some preliminary insights by considering signal properties (Dale, 2006). In A. percula, the pinkish color of settlers may be a dishonest signal of presence (i.e., camouflage) to residents (McDonald, 1993; Buston, 2003a). In A. clarkii and others, the differences in coloration associated with social rank may be a signal of reproductive strategy, either female vs. male or breeder vs. non-breeder (Moyer, 1976; Fautin and Allen, 1997; Militz et al., 2016). In A. percula and A. ocellaris, the highly variable orange, black and white patterning may be a signal of individual identity to other group members (Fricke, 1973; Nelson et al., 1994; Dale et al., 2001; Buston, 2003b; Tibbetts, 2004).
Finally, turning to consider the evolutionary origins of the various components of the color pattern, close inspection of the clownfish phylogeny reveals a likely phylogenetic component (Litsios et al., 2014; Rolland et al., 2018). Within the genus there are two main clades which separated 11–12 million years ago (MYA): a smaller clade that is bright orange with three white bars (A. percula and others); a larger clade that is dominated by species with two white bars (A. clarkii and others). Within the larger clade there are three other small clades of note: the first, which diverged 5–6 MYA, tends to have one or zero wide white bars (A. melanopus and others); the second, which also diverged around 5–6 MYA, tends to be more pinkish in color with one or zero narrow white bars and a dorsal white stripe (A. perideraion and others); the third, which diverged 2–3 MYA, tends to be more blotchy in its color patterns (A. polymnus and A. sebae).
In sum, the clownfishes of the genus Amphiprion present a wonderful opportunity to investigate the proximate and ultimate causes of coloration in coral reef fishes. This opportunity is enhanced by the recent development of transcriptomic (Amphiprion bicinctus, Casas et al., 2016) and genomic (Amphiprion frenatus, Marcionetti et al., 2018; Amphiprion ocellaris, Tan et al., 2018) resources for the genus. Here, we used a combination of RNA sequencing, transcriptome annotation, differential gene expression analyses and gene ontology enrichment analyses to (i) generate a de novo transcriptome for A. percula, (ii) identify over-represented genes associated with orange, white, and black epidermal tissues, and (iii) identify potential functions of those genes in A. percula. We found patterns consistent with over-representation of GO terms associated with muscles in orange regions, as well as over-representation of GO terms involved in immune response in black regions. While our results, by design, represent only a preliminary assessment of color-specific gene expression in the epidermis of Amphiprion, they represent a first step in identifying the genetic mechanisms underlying color pattern formation in this iconic group of coral reef fishes.
Materials and Methods
Source Population
All work was conducted with the approval of Boston University IACUC. Research was carried out at Boston University (Boston, MA). Clownfish used in the study, Amphiprion percula, all originated from wild populations in Papua New Guinea and were supplied by Quality Marine and Sea Dwelling Creatures. At the time of sampling all individuals had fully developed white bars, bordered with black and all individuals were non-reproductive—A. percula is a sequential, protandrous hermaphrodite and all individuals start out as non-reproductive, then transition to male and female in their lifetime. Experimental fish were housed in 1 L tanks, which were part of a larger re-circulating saltwater aquarium system. Flow through each tank was approximately 9 L/h ± 0.5 L. Abiotic conditions were maintained as constant as possible: pH = 8.1 ± 0.1, temperature = 26.1 ± 0.6°C, salinity = 32 ± 0.5 ppt with ambient light. Water samples were tested every 2 weeks for nitrate, nitrite, and ammonia (Salifert test kits, Amsterdam, The Netherlands; Red Sea test kits). These measurements were 0 ppm for the entirety of the experiment.
Sequencing
In 2015, epidermal tissue samples were taken from nine, cold-anesthetized, A. percula. From each individual, nine samples were taken: three different colored epidermal tissues (orange, black, white) from three different body positions (anterior, middle, posterior; see Figure 1). This procedure yielded 81 samples in total (9 individuals × 3 colors × 3 positions). Samples were immediately submerged in RNAlater for preservation. Samples of the same color, from all body positions and all individuals, were later pooled, yielding three libraries for RNA-sequencing: orange, white, black. In an ideal world, we would have kept these samples separate, maximizing our sample size and enabling us to examine variation within and among individuals, but funding constraints prevented us from adopting this strategy. Pooling tissue samples by color reduced our sample size and meant that we could not examine variation within and among individuals, but enabled us to investigate patterns of gene expression in different colored epidermal tissues against multiple backgrounds in a cost effective manner.
Following preservation, RNase-free microcentrifuge tubes with 1 ml of TRIzol Reagent (Invitrogen) were used for RNA isolation. Samples were homogenized, followed by a 5-min incubation period at room temperature. Phase separation was carried out with 0.2 ml of chloroform and centrifugation at 12,000 g for 15 min at 4°C (following Casas et al., 2016). Ethanol (200 proof) was added in equal volume to each sample, and samples were loaded onto a Purelink RNA minikit column (Life Technologies), washed three times, and eluted into 50 μl of RNase-free water. Each total RNA sample was then treated with DNAse followed by a final clean up using Qiagen's RNeasy Plus kit. An Agilent Bioanaylzer 2100 in conjunction with flurometry (Qubit) were used to assess total RNA quality and concentration. All samples scored an RNA integrity number (RIN) of at least eight and were used for library construction.
From the chosen samples, Dynabeads Oligo (dT) kit (Life Technologies) was used to isolate Poly-A mRNA from 1 to 3 μg of total RNA. Following mRNA capture, 2 × 100 bp RNAseq libraries were created using NEBNext Ultra library prep kits (New England Biolabs). 12 PCR cycles were used for library enrichment. Libraries were quality checked using KAPA's library quantification kit on the Bioanalyzer 2100 (with DNA 1000 chips). Using these results, individually-barcoded mRNA sequence libraries were multiplexed in equal proportion (10 nM) and sequenced across four lanes of Illumina's HiSeq 2000 platform on rapid run mode. All sequencing was performed at Tufts Genomics.
Transcriptome Assembly, Assessment and Annotation
For transcriptome assembly purposes, all sequencing data were pooled, yielding over 289 million PE reads. Read quality was assessed using FastQC and raw reads were quality filtered and trimmed at the first base with mean quality score (Q-score) < 20. Sequence adaptors were removed using trimmomatic, leading and trailing bases with a Phred quality score below 3 were trimmed and each sequence was scanned with a 4 bp sliding window and trimmed when average Phred quality dropped below 15, resulting sequences < 36 bp were discarded and the remaining reads were then normalized in silico using the normalize_reads function in the Trinity bioinformatics pipeline (Haas et al., 2013). Trinity 2.2.0 (Grabherr et al., 2011) with bowtie v1.2.0 (Langmead et al., 2009) was used to construct the de novo transcriptome on Boston University's Shared Computing Cluster with a 100 Gb memory node and 12 cores.
The resulting transcriptome assembly was trimmed with a custom perl script to remove contigs under 500 base pairs. Ribosomal RNA contamination was controlled by finding sequences exhibiting significant nucleotide similarity (BLASTN, e-value ≤ 1 × 10⁻⁸) to the SILVA LSU and SSU rRNA databases (http://www.arb-silva.de/). A total of 288 contigs from the A. percula transcriptome, each of which matched an identifiable rRNA, were identified and removed from the transcriptome. BUSCO was then used to evaluate transcriptome completeness. BUSCO detects the presence of single-copy orthologs universal to all Actinopterygii (ray-finned fishes) as an overall measure of transcriptome quality. The ortholog dataset was provided by BUSCO (Simão et al., 2015) and BUSCO v3, augustus v3.2.3, hmmer v3.1b2 and blast+ v2.6.0 were used. Contigs were then annotated by BLAST sequence homology searches against UniProt and Swiss-Prot NCBI NR protein databases, using an e-value cutoff of e−5 and annotated sequences were then assigned to Gene Ontology (GO) categories (Blake et al., 2015). The annotation pipeline used here is described in detail at: https://github.com/z0on/annotatingTranscriptomes.
Read Mapping, Differential Analysis and GO Enrichment
Across the three RNA tissue libraries, raw reads ranged from 114 to 143 million PE reads (Table 1). Fastx_toolkit removed Illumina TruSeq adapters and poly(A)+ tails. Sequences < 20 bp in length with < 90% of bases having quality cutoff scores >20 were trimmed. Resulting filtered reads (R1 and unpaired reads only) were then mapped to the de novo A. percula transcriptome described above using bowtie 2.3.2 (Langmead and Salzberg, 2012). Raw counts were then used as input into differential expression analyses (Supplemental Table 1).
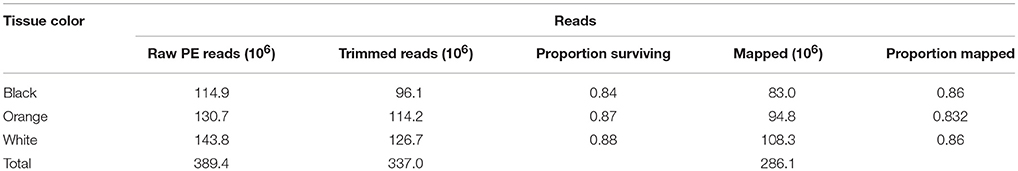
Table 1. Summary of RNA libraries, including the tissue color, raw 100 bp paired-end reads (“PE Reads”), trimmed reads, proportion of reads surviving quality control, mapped reads and the proportion of reads that mapped to the Amphiprion percula transcriptome.
Differential gene expression analyses were performed using edgeR v3.20.8 (Robinson et al., 2010) in R v3.4.1 (R Development Core Team., 2008). Three unique pairwise comparisons were carried out between the three tissue color libraries: orange vs. white, orange vs. black, white vs. black). Using edgeR, samples were used to create a DGEList object. Normalization factors to scale library sizes were acquired using the calcNormFactors function. Next, the exactTest function was used with a large dispersion value of 0.4, as no biological replicate libraries were available to control for variation (Chen et al., 2017). We used EdgeR's suggested large dispersion values since larger dispersion values minimize the ability to detect differentially expressed genes and the typical value for the common biological coefficient of variation (BCV; square-root-dispersion) for outbred human populations has been found to be 0.4 (Robinson et al., 2010). That is, we chose a large dispersion value as a conservative measure, being aware of the limitations of our sampling strategy. Data were then compiled into tables of normalized counts, log fold change, log counts per million, p-values, and false discovery rate- adjusted p-values for each pairwise comparison (Supplemental Tables 2–4).
Given the limitations of our sampling strategy, no specific candidate genes or metabolic pathways were explored. Rather, p-values resulting from the exactTest function were used to implement a standard “GO enrichment” analysis, based on ranking of signed log p-values (Dixon et al., 2015; Wright et al., 2015; https://github.com/z0on/GO_MWU). Results were plotted in nine separate dendrograms, each representing one of three GO domains [biological processes (BP), cellular component (CC), molecular function (MF)] for one of the three pairwise comparisons. Using data acquired from GO enrichment, GO categories that were significantly enriched at a p-value < 0.1 were noted and recorded. Given the limitations, only GO categories that were consistently up or down regulated in both pairwise comparisons were considered significantly enriched. These categories were then explored for common trends and functions, and grouped together in “GO subdomains” using their biological relatedness as explained by the Gene Ontology Consortium's definition for each term (Blake et al., 2015; http://www.geneontology.org/page/ontology-documentation). We treat these results as plausible hypotheses for future investigation.
Results
Amphiprion percula Transcriptome
To compare gene expression between tissue colors, a de novo transcriptome was constructed. Trimmomatic quality trimmed the reads before assembly and 97.13% of both read pairs survived, in 0.89% of instances only forward reads survived and in 0.00% of instances did only reverse reads survive. In all, 1.99% of read pairs were dropped. Sequencing produced a total of 389 million paired reads after adapter trimming and quality filtering. The preliminary transcriptome held a total of 217,325 transcripts which were manually trimmed to remove contigs under 500 base pairs. The resulting transcriptome had a mean GC content of 45.91% and produced 88,074 contigs with an average length of 1,517.56 bp (N50 = 1,969) and a median contig length of 1,119. These contigs corresponded to 18,618 unique isogroups, of which 12,062 had gene annotations when searched against NCBI's nr database. Furthermore, 12,153 of these isogroups had GO annotations. Of the 4,584 Benchmarking Universal Single-Copy Orthologs (BUSCOs) for Actinopterygii, 70% were complete, and a further 15.4% were fragmented, suggesting that the de novo assembly was relatively successful (Supplemental Figure 1). All raw reads are archived in the National Center for Biotechnology Information (NCBI) Short Read Archive (SRA) under accession number PRJNA471968, with transcriptome assembly and annotation files available at http://sites.bu.edu/davieslab/data-code/.
Preliminary Investigation of Differential Gene Expression and GO Enrichment
For individual tissue RNA libraries, raw reads ranged from 114 to 143 million reads (Table 1). After quality control with fastx_toolkit and fastq_quality_filter this number was reduced to 96–126 million reads. Reads that successfully mapped to the de novo transcriptome ranged from 83 to 108 million for each library (Table 1). Out of 18,618 isogroups, edgeR's analysis of pairwise comparisons found 327 (1.76%) differentially expressed genes (DEGs; p = 0.1) in the orange vs. white tissue comparison, 374 DEGs (2.01%) in the black vs. white tissue comparison, and 320 DEGs (1.72%) in the orange vs. black tissue comparison. EdgeR results can be found in Supplemental Tables 2–4.
In orange epidermal tissue, Gene Ontology (GO) enrichment analysis revealed, an over-representation of GO terms associated with muscle in all three GO domains: “biological process” (BP), “Molecular Function” (MF), and “cellular component” (CC) (Supplemental Figures 2–7). This enrichment was most abundant in CC (Supplemental Figures 3, 6). The terms included striated muscle contraction (GO:0006941), structural constituent of muscle (GO:0008307), and myosin filament (GO:0032982) (Figure 3).
In white tissue, there were few enriched GO categories, but all fell under the “cellular component” domain (Supplemental Figures 3, 9). Several dealt with the extracellular matrix: proteinaceous extracellular matrix (GO:0005578) and extracellular matrix (GO:0031012) and all of these categories dealing with extracellular matrix were underrepresented (Figure 3).
In black epidermal tissue, many GO terms dealing with immunity (immune function, response to wounding/stress), were over-represented in BP (Supplemental Figures 5, 8; Figure 2). These included GO terms associated with generalized immune function such as positive regulation of immune response (GO:0050778), and response to wounding (GO:0009611), and terms associated with leukocyte movement such as positive regulation of leukocyte migration (GO:0002687), regulation of leukocyte chemotaxis (GO:0002688), and lymphocyte migration (GO:0072676) (Figure 2). Inflammatory response genes, including positive regulation of inflammatory response (GO:0050729), regulation of inflammatory response to antigenic stimulus (GO:0002861), as well as genes related to wounding, response to wounding (GO:0009611), were also over-represented in BP (Figure 2). A small number of terms dealing with immunity were also over-represented in MF in black tissue (Supplemental Figures 7, 10) and the majority of these dealt with cytokine function, including cytokine receptor activity (GO:0004896), and chemokine receptor binding (GO:0042379) (Figure 4). No genes were enriched in CC in black tissue (Supplemental Figures 6, 9).
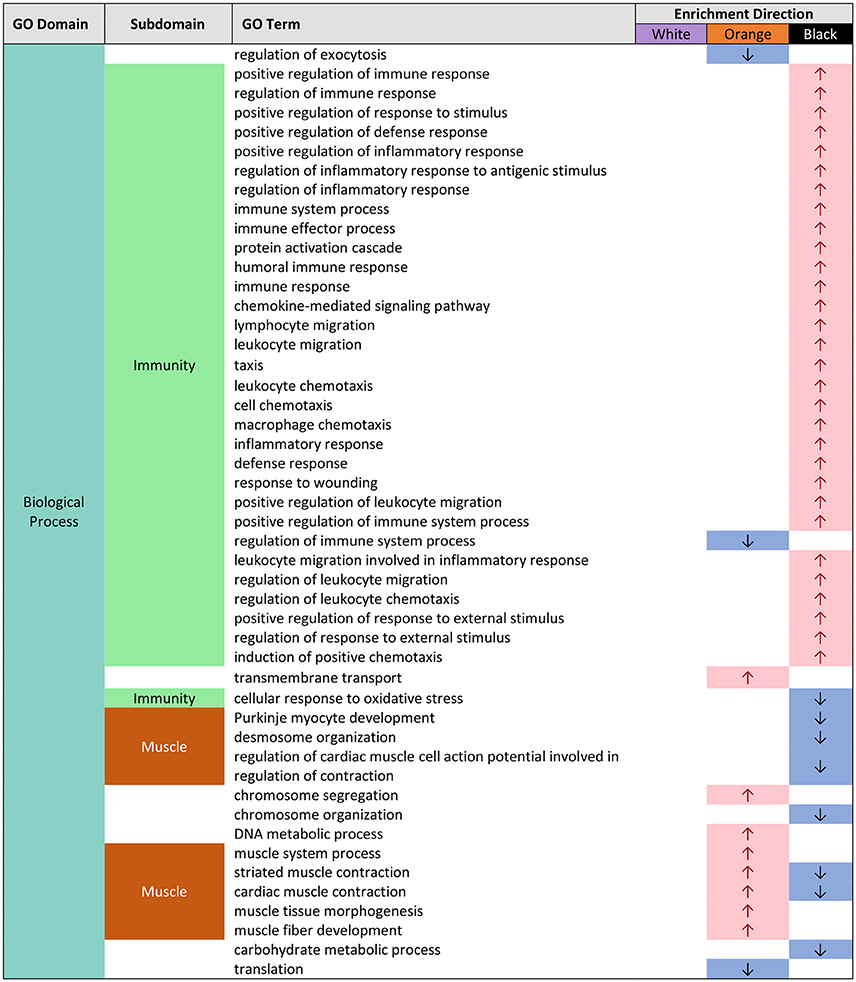
Figure 2. Gene ontology (GO) categories significantly enriched for both pairwise color comparisons for each epidermal tissue by “biological process” (BP) using Mann-Whitney U tests based on ranking of signed log p-values computed using EdgeR. Results indicate the GO domain (BP), the subdomains discussed in text (“immunity” and “muscle”), the specific GO terms, and enrichment direction observed consistently in each epidermal tissue color.
Discussion
While typically attributed to aposematism (i.e.,-warning coloration), the evolution of bold, striking colors can arise via many other mechanisms, including those related to signaling (e.g., individual identity, social status, behavioral strategy, etc; Tibbetts et al., 2017). Differentiating among these competing hypotheses is complex, however, and requires detailed knowledge of the underlying genetic mechanisms responsible for color-pattern variation at multiple levels of organizations (e.g., individual, population, species). Here we assembled and annotated the first de novo reference transcriptome for the clownfish Amphiprion percula, characterized patterns of differential gene expression across colored epidermal tissue, and conducted GO enrichment analysis to characterize evidence of functional differences among differentially colored epidermal tissues as a first step toward elucidating the molecular basis of color pattern formation in Amphiprion.
Several lines of evidence indicate that our de novo transcriptome is robust. First, although our Trinity assembly produced a large number of contigs initially, filtering for contigs longer than 500 bp dramatically reduced this number and resulted in a N50 contig length approaching 2 kb, typical of full length ESTs in vertebrates (Fong et al., 2013). Additionally, these filtered contigs represent ~18 K unique isogroups corresponding closely to typical estimates of gene number in vertebrates (Prachumwat and Li, 2008; Howe et al., 2013). Benchmarking against single-copy vertebrate genes found evidence for 85% of known orthologs, which is typical of other successful transcriptome assemblies (Simão et al., 2015; Theissinger et al., 2016). For comparison, the recently completed Amphiprion bicinctus transcriptome (Casas et al., 2016), which was derived from brain and gonadal tissues, found evidence for completeness of 95.6% of core eukaryotic genes but looked at a smaller gene set (CEGs, n = 248), had a median contig length of 603 bp, and an N50 value approximately 25% smaller (N 50–1,563 bp) than our assembly. Taken together, these statistics strongly suggest that the transcriptome produced here was robust.
Our gene expression analyses, using the reference transcriptome, revealed striking differences among colored epidermal tissues. However, because we pooled samples from multiple individuals, our sample size is limited and these results are best viewed as preliminary. Despite this caveat, the strong differences in observed levels of expression across tissue samples is interesting for two reasons. First, pooling tissue samples from different body regions and different individuals by epidermal tissue color is expected to increase the variance in background gene expression within each pool, making it less likely to detect differences between color types. This suggests that differences between color types may have biological significance, enabling us to generate some plausible hypotheses regarding their function that will require more rigorous testing in the future. Second, variation in patterns of gene expression among epidermal tissue colors suggests that coloration is actively maintained in adults and not simply the result of differences in gene regulation during development.
In orange epidermal tissue, we observed many over-represented GO terms associated with muscle (Figures 2–4). Previous research has shown that smooth muscle proteins are a cellular component of the chromatophores that are responsible for fish skin coloration and suggested that they may control the movement of intracellular bodies (melanophores, xanthophores, and erythrophores) within the chromatophore (Meyer-Rochow et al., 2001). The over-representation of muscle related GO terms in orange tissue might suggest greater motility control of the intracellular bodies in this skin type (Li et al., 2015), which might facilitate changes in orange coloration. This may explain how A. percula are able to rapidly adjust their orange coloration in response to light intensity and background color (Yasir and Qin, 2009a,b).
In white epidermal tissue, we detected few over- or under-represented GO terms, consistent with the relative paucity of knowledge regarding the genetic basis of structural coloration in vertebrates (Hubbard et al., 2010). The few GO terms that were consistently enriched were associated with cellular components and within this GO ontology several GO terms associated with extracellular matrix were consistently underrepresented in white tissue (Figure 3). It seems plausible that these over- and under-represented categories might be related to the formation of the white/UV structural color, which is formed by stacks of intracellular guanine crystals in other fishes (Levy-Lior et al., 2010; Zhao et al., 2012; Gur et al., 2015).
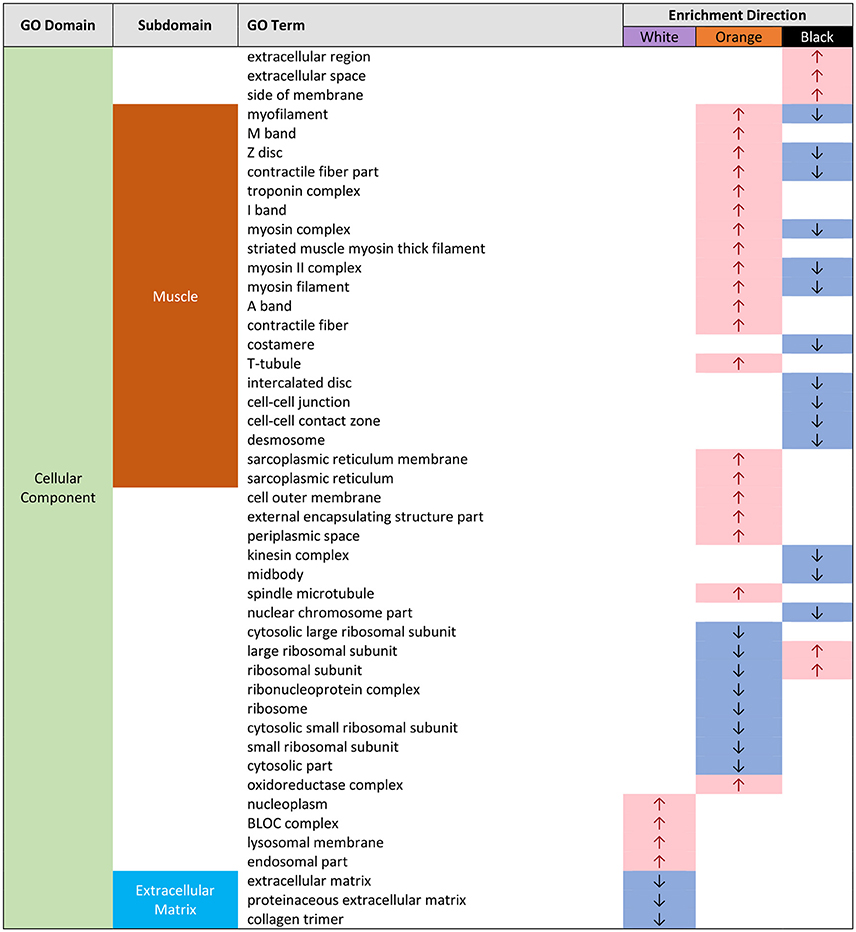
Figure 3. Gene ontology (GO) categories significantly enriched for both pairwise color comparisons for each epidermal tissue by “cellular component” (CC) using Mann-Whitney U tests based on ranking of signed log p-values computed using EdgeR. Results indicate the GO domain (CC), the subdomains discussed in text (“muscle” and “extracellular matrix”), the specific GO terms, and enrichment direction observed consistently in each epidermal tissue color.
In black epidermal tissue, we observed an over-representation of many GO terms associated with immune function: leukocyte/lymphocyte movement, cytokines, inflammation, immune response, and wounding response (Figures 2, 4). Upregulation of immune defense in melanic tissue is consistent with previous research: in invertebrates, melanin has been shown to act in defense reactions and wound healing (Sugumaran, 2002; McGraw, 2005); in vertebrates, melanocytes and melanosomes are known to inhibit skin infection by microorganisms, and melanin may play a role in the regulation of immunological cytokines (Mackintosh, 2001). This raises the question of why A. percula exhibit black, melanin-based pigments and its associated up-regulation of immune system function? Some insights may be gained by examining the distribution of melanistic A. percula in nature. Militz et al. (2016) found that melanistic A. percula are much more frequent in the gigantic sea anemone Stichodactyla gigantea when compared to the magnificent sea anemone Heteractis magnifica. S. gigantea is a more aggressive anemone that can sting badly and remove skin from fingers (Buston personal observation). It seems plausible that melanin pigments and associated up-regulation of immune defense may facilitate wound-healing and allow A. percula to tolerate these aggressive host anemones.
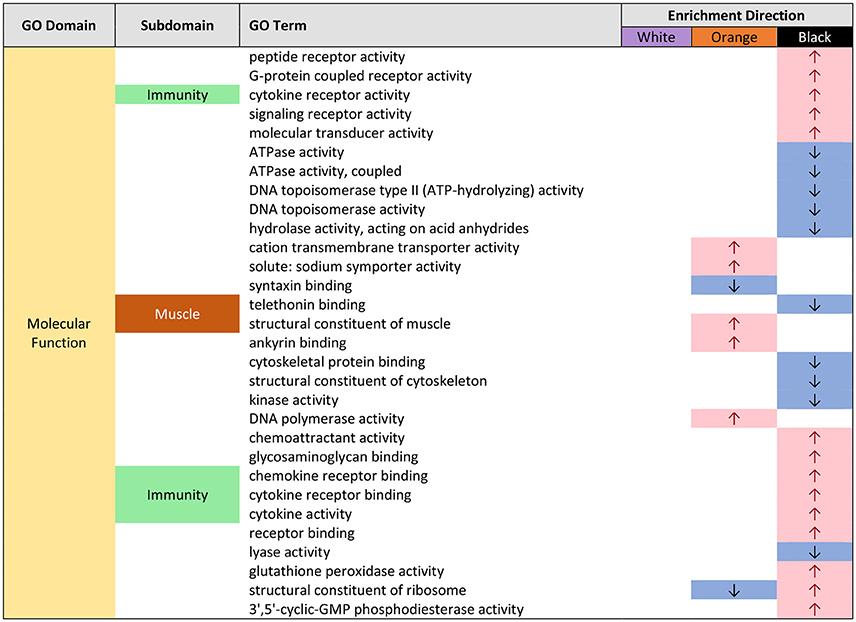
Figure 4. Gene ontology (GO) categories significantly enriched for both pairwise color comparisons for each epidermal tissue by “molecular function” (MF) using Mann-Whitney U tests based on ranking of signed log p-values computed using EdgeR. Results indicate the GO domain (MF), the subdomains discussed in text (“immunity” and “muscle”), the specific GO terms, and enrichment direction observed consistently in each epidermal tissue color.
In conclusion, here we have reviewed the proximate and ultimate causes of conspicuous coloration in clownfishes of the genus Amphiprion. The conspicuous coloration of this genus (i) has a heritable genetic basis, (ii) exhibits developmental and environmental plasticity, (iii) has multiple plausible signaling functions, and (iv) exhibits a strong phylogenetic component. By generating a de novo transcriptome for A. percula, conducting differential gene expression analyses and GO enrichment analyses, we have revealed an over-representation of transcripts associated with immune function associated with melanin pigments, a pattern previously observed in many other vertebrates and invertebrates. Relating this to what is known about the distribution of melanistic morphs in the wild, suggests that melanism may serve a protective function when these fishes are associated with more noxious anemones. This study represents a first step in an integrative investigation of the proximate and ultimate causes of conspicuous coloration of these iconic coral reef fishes.
Data Availability Statement
All raw reads are archived in the National Center for Biotechnology Information (NCBI) Short Read Archive (SRA) under accession number PRJNA471968, with transcriptome assembly and annotation files available at http://sites.bu.edu/davieslab/data-code/. Additional count data and EdgeR output files can be found in Supplementary Materials.
Author Contributions
SD, SM, and PB designed the project; AM, GS and SM acquired the data; AM, SD, and SM analyzed the data; AM, SD, SM, and PB wrote the manuscript.
Funding
Funding for the research was provided by start-up awards to PB and SM from the Trustees of Boston University and by Undergraduate Research Opportunities Program awards to AM and GS. Funding for publication in Frontiers in Marine Science was provided by Kilachand Honors College for AM's Kilachand Honors College Keystone Project.
Conflict of Interest Statement
The authors declare that the research was conducted in the absence of any commercial or financial relationships that could be construed as a potential conflict of interest.
Acknowledgments
This research formed AM's Kilachand Undergraduate Keystone Project at Boston University We thank J. Seymour and C. Johnson for their assistance in the lab. We also thank J. Dale and C. Martone for stimulating discussions about clownfish coloration over the years.
Supplementary Material
The Supplementary Material for this article can be found online at: https://www.frontiersin.org/articles/10.3389/fmars.2018.00284/full#supplementary-material
References
Alatalo, R. V., and Mappes, J. (1996). Tracking the evolution of warning signals. Nature 382, 708–710. doi: 10.1038/382708a0
Allen, G. R. (1972). The Anemonefishes: Their Classification and Biology. Neptune City, NJ: T.F.H. Publications.
Avella, M. A., Olivotto, I., Gioacchini, G., Maradonna, F., and Carnevali, O. (2007). The role of fatty acids enrichments in the larviculture of false percula clownfish Amphiprion ocellaris. Aquaculture 273, 87–95. doi: 10.1016/j.aquaculture.2007.09.032
Balamurugan, J., Ajith Kumar, T. T., Kathiresan, K., and Meenakumari, B. (2017). Determination of growth, colour and other traits in F1 hybrid of Amphiprion percula (male) × A. ocellaris (female). Aquac. Res. 48, 2989–3003. doi: 10.1111/are.13132
Bell, L. J., Moyer, J. T., and Numachi, K. (1982). Morphological and genetic variation in Japanese populations of the anemonefish Amphiprion clarkii. Mar. Biol. 72, 99–108. doi: 10.1007/BF00396909
Blake, J. A., Christie, K. R., Dolan, M. E., Drabkin, H. J., Hill, D. P., Ni, L., et al. (2015). Gene ontology consortium: going forward. Nucleic Acids Res. 43, D1049–D1056. doi: 10.1093/nar/gku1179
Buston, P. (2003a). Forcible eviction and prevention of recruitment in the clown anemonefish. Behav. Ecol. 14, 576–582. doi: 10.1093/beheco/arg036
Buston, P. (2003b). Size and growth modification in clownfish. Nature 424, 145–146. doi: 10.1038/424145a
Casas, L., Saborido-Rey, F., Ryu, T., Michell, C., Ravasi, T., and Irigoien, X. (2016). Sex change in clownfish: molecular insights from transcriptome analysis. Sci. Rep. 6:35461. doi: 10.1038/srep35461
Chambel, J., Severiano, V., Baptista, T., Mendes, S., and Pedrosa, R. (2015). Effect of stocking density and different diets on growth of Percula Clownfish, Amphiprion percula (Lacepede, 1802). Springerplus 4:183. doi: 10.1186/s40064-015-0967-x
Chen, Y., Mccarthy, D., Ritchie, M., Robinson, M., and Smyth, G. K. (2017). edgeR: Differential Expression Analysis of Digital Gene Expression Data User's Guide. Available online at: http://bioconductor.riken.jp/packages/release/bioc/vignettes/edgeR/inst/doc/edgeRUsersGuide.pdf
Cuthill, I. C., Allen, W. L., Arbuckle, K., Caspers, B., Chaplin, G., Hauber, M. E., et al. (2017). The biology of color. Science 357:eaan0221. doi: 10.1126/science.aan0221
Dale, J. (2006). “Intraspecific variation in coloration,” in Bird Coloration: Function, and Evolution, Vol. 2, eds G. E. Hill and K. J. McGraw (Cambridge, MA: Harvard University Press), 36–86.
Dale, J., Dey, C. J., Delhey, K., Kempenaers, B., and Valcu, M. (2015). The effects of life history and sexual selection on male and female plumage colouration. Nature 527, 367–370. doi: 10.1038/nature15509
Dale, J., Lank, D. B., and Reeve, H. K. (2001). Signaling individual identity versus quality: a model and case studies with ruffs, queleas, and house finches. Am. Nat. 158, 75–86. doi: 10.1086/320861
Dibattista, J. D., Rocha, L. A., Hobbs, J. P. A., He, S., Priest, M. A., Sinclair-Taylor, T. H., et al. (2015). When biogeographical provinces collide: hybridization of reef fishes at the crossroads of marine biogeographical provinces in the Arabian Sea. J. Biogeogr. 42, 1601–1614. doi: 10.1111/jbi.12526
Dixon, G. B., Davies, S. W., Aglyamova, G. A., Meyer, E., Bay, L. K., and Matz, M. V (2015). Genomic determinants of coral heat tolerance across latitudes. Science 348, 1460–1462. doi: 10.1126/science.1261224
Drew, J., Allen, G. R., Kaufman, L., and Barber, P. H. (2008). Endemism and regional color and genetic differences in five putatively cosmopolitan reef fishes. Conserv. Biol. 22, 965–975. doi: 10.1111/j.1523-1739.2008.01011.x
Endler, J. A., and Mappes, J. (2017). The current and future state of animal coloration research. Philos. Trans. R. Soc. B Biol. Sci. 372:20160352. doi: 10.1098/rstb.2016.0352
Fautin, D. G., and Allen, G. R. (1992). Field Guide to Anemonefishes and their Host Sea Anemones. Perth: Western Australian Museum.
Fautin, D. G., and Allen, G. R. (1997). Anemonefishes and their Host Sea Anemones. Perth: Western Australia Museum.
Fong, J. H., Murphy, T. D., and Pruitt, K. D. (2013). Comparison of RefSeq protein-coding regions in human and vertebrate genomes. BMC Genomics 14:654. doi: 10.1186/1471-2164-14-654
Fricke, H. W. (1973). Individual partner recognition in fish: field studies on Amphiprion bicinctus. Naturwissenschaften 60, 204–205. doi: 10.1007/BF00599441
Froese, R., and Pauly, D. (eds),. (2018). FishBase. World Wide Web Electronic Publication. Available online at: www.fishbase.org. (Accessed February, 2018).
Gainsford, A., van Herwerden, L., and Jones, G. P. (2015). Hierarchical behaviour, habitat use and species size differences shape evolutionary outcomes of hybridization in a coral reef fish. J. Evol. Biol. 28, 205–222. doi: 10.1111/jeb.12557
Gallant, J. R., Imhoff, V. E., Martin, A., Savage, W. K., Chamberlain, N. L., Pote, B. L., et al. (2014). Ancient homology underlies adaptive mimetic diversity across butterflies. Nat. Commun. 5:4817. doi: 10.1038/ncomms5817
Grabherr, M. G., Haas, B. J., Yassour, M., Levin, J. Z., Thompson, D. A., Amit, I., et al. (2011). Full-length transcriptome assembly from RNA-Seq data without a reference genome. Nat. Biotechnol. 29, 644–652. doi: 10.1038/nbt.1883
Guilford, T. (1988). The evolution of conspicuous coloration. Am. Nat. 131, S7–S21. doi: 10.2307/2678832
Gur, D., Palmer, B. A., Leshem, B., Oron, D., Fratzl, P., Weiner, S., et al. (2015). The mechanism of color change in the neon tetra fish: a light-induced tunable photonic crystal array. Angew. Chemie Int. Ed. 54, 12426–12430. doi: 10.1002/anie.201502268
Haas, B. J., Papanicolaou, A., Yassour, M., Grabherr, M., Blood, P. D., Bowden, J., et al. (2013). De novo transcript sequence reconstruction from RNA-seq using the trinity platform for reference generation and analysis. Nat. Protoc. 8, 1494–1512. doi: 10.1038/nprot.2013.084
Hekimoglu, M. A., Firat, K., Saka, S., Süzer, C., Kop, A., and Durmaz, Y. (2017). Effect of supplemented algal carotenoid diets on skin color of tomato clownfsh, Amphiprion frenatus. Pak. J. Zool. 49, 663–668. doi: 10.17582/journal.pjz/2017.49.2.663.668
Hill, G. E., and McGraw, K. J. (2006a). Bird Coloration: Mechanisms and Measurements, Vol. 1. Cambridge, MA: Harvard University Press.
Hill, G. E., and McGraw, K. J. (2006b). Bird Coloration: Function and Evolution, Vol, 2. Cambridge, MA: Harvard University Press.
Ho, A. L. F. C., Zong, S., and Lin, J. (2014). Skin color retention after dietary carotenoid deprivation and coloration in clown anemonefish, Amphiprion ocellaris. AACL Bioflux 7, 103–115.
Hoekstra, H. E., Hirschmann, R. J., Bundey, R. A., Insel, P. A., and Crossland, J. P. (2006). A single amino acid mutation contributes to adaptive beach mouse color pattern. Science 313, 101–104. doi: 10.1126/science.1126121
Howe, K., Clark, M. D., Torroja, C. F., Torrance, J., Berthelot, C., Muffato, M., et al. (2013). The zebrafish reference genome sequence and its relationship to the human genome. Nature 496, 498–503. doi: 10.1038/nature12111
Hubbard, J. K., Uy, J. A. C., Hauber, M. E., Hoekstra, H. E., and Safran, R. J. (2010). Vertebrate pigmentation: from underlying genes to adaptive function. Trends Genet. 26, 231–239. doi: 10.1016/j.tig.2010.02.002
Joron, M., and Mallet, J. L. B. (1998). Diversity in mimicry: paradox or paradigm? Trends Ecol. Evol. 13, 461–466. doi: 10.1016/S0169-5347(98)01483-9
Kronforst, M. R., Barsh, G. S., Kopp, A., Mallet, J., Monteiro, A., Mullen, S. P., et al. (2012). Unraveling the thread of nature's tapestry: the genetics of diversity and convergence in animal pigmentation. Pigment Cell Melanoma Res. 25, 411–433. doi: 10.1111/j.1755-148X.2012.01014.x
Kunte, K., Zhang, W., Tenger-Trolander, A., Palmer, D. H., Martin, A., Reed, R. D., et al. (2014). Doublesex is a mimicry supergene. Nature 507, 229–232. doi: 10.1038/nature13112
Langmead, B., and Salzberg, S. L. (2012). Fast gapped-read alignment with Bowtie 2. Nat. Methods 9, 357–359. doi: 10.1038/nmeth.1923
Langmead, B., Trapnell, C., Pop, M., and Salzberg, S. L. (2009). Ultrafast and memory-efficient alignment of short DNA sequences to the human genome. Genome Biol. 10:R25. doi: 10.1186/gb-2009-10-3-r25
Levy-Lior, A., Shimoni, E., Schwartz, O., Gavish-Regev, E., Oron, D., Oxford, G., et al. (2010). Guanine-Based biogenic photonic-crystal arrays in fish and spiders. Adv. Funct. Mater. 20, 320–329. doi: 10.1002/adfm.200901437
Li, X. M., Song, Y. N., Xiao, G. B., Zhu, B. H., Xu, G. C., Sun, M. Y., et al. (2015). Gene expression variations of red-white skin coloration in common carp (Cyprinus carpio). Int. J. Mol. Sci. 16, 21310–21329. doi: 10.3390/ijms160921310
Litsios, G., Pearman, P. B., Lanterbecq, D., Tolou, N., and Salamin, N. (2014). The radiation of the clownfishes has two geographical replicates. J. Biogeogr. 41, 2140–2149. doi: 10.1111/jbi.12370
Litsios, G., and Salamin, N. (2014). Hybridisation and diversification in the adaptive radiation of clownfishes. BMC Evol. Biol. 14:245. doi: 10.1186/s12862-014-0245-5
Longley, W. H. (1917). Studies upon the biological significance of animal coloration. I. The colors and color changes of West Indian reef-fishes. J. Exp. Zool. 23, 533–601. doi: 10.1002/jez.1400230305
Lorenz, K. (1962). The function of colour in coral reef fishes. Proc. R. Inst. Gt. Brit. 39, 282–296.
Mackintosh, J. A. (2001). The antimicrobial properties of melanocytes, melanosomes and melanin and the evolution of black skin. J. Theor. Biol. 211, 101–113. doi: 10.1006/jtbi.2001.2331
Marcionetti, A., Rossier, V., Bertrand, J. A. M., Litsios, G., and Salamin, N. (2018). First draft genome of an iconic clownfish species (Amphiprion frenatus). Mol. Ecol. Resour. 2018, 1–10. doi: 10.1111/1755-0998.12772
Marliave, J. B. (1985). Color polymorphism in sibling Amphiprion: is the reef-fish lottery rigged? Environ. Biol. Fishes 12, 63–68. doi: 10.1007/BF00007711
McDonald, D. B. (1993). Delayed plumage maturation and orderly queues for status: a manakin mannequin experiment. Ethology 94, 31–45. doi: 10.1111/j.1439-0310.1993.tb00545.x
McGraw, K. J. (2005). The antioxidant function of many animal pigments: are there consistent health benefits of sexually selected colourants? Anim. Behav. 69, 757–764. doi: 10.1016/j.anbehav.2004.06.022
Meyer-Rochow, V. B., Royuela, M., Fraile, B., and Paniagua, R. (2001). Smooth muscle proteins as intracellular components of the chromatophores of the Antarctic fishes Pagothenia borchgrevinki and Trematomus bernacchii (Nototheniidae). Protoplasma 218, 24–30. doi: 10.1007/BF01288357
Militz, T. A., McCormick, M. I., Schoeman, D. S., Kinch, J., and Southgate, P. C. (2016). Frequency and distribution of melanistic morphs in coexisting population of nine clownfish species in Papua New Guinea. Mar. Biol. 163:200. doi: 10.1007/s00227-016-2972-1
Moyer, J. T. (1976). Geographical variation and social dominance in Japanese populations of the Anemonefish Amphiprion clarkii. Japanese J. Ichthyol. 23, 12–22. doi: 10.11369/jji1950.23.12
Nelson, J. S., Chou, L. M., and Phang, V. P. E. (1994). Pigmentation variation in the anemonefish amphiprion-ocellaris (teleostei, pomacentridae) - type, stability and its usefulness for individual identification. Raffles Bull. Zool. 42, 927–930.
Pedersen, M. (2014a). New age mutant clownfishes–A breeder takes a fresh look into the future of aberrant anemonefishes. Coral 5, 44–61.
Pedersen, M. (2014b). Playing with matches: hybrid clownfishes–They can fuel the fires of conservation or burn everything to the ground. Coral, 5, 62–73.
Prachumwat, A., and Li, W. H. (2008). Gene number expansion and contraction in vertebrate genomes with respect to invertebrate genomes. Genome Res. 18, 221–232. doi: 10.1101/gr.7046608
R Development Core Team. (2008). R: A Language and Environment for Statistical Computing 2014. R Core Team.
Reed, R. D., Papa, R., Martin, A., Hines, H. M., Counterman, B. A., Pardo-Diaz, C., et al. (2011). Optix drives the repeated convergent evolution of butterfly wing pattern mimicry. Science 333, 1137–1141. doi: 10.1126/science.1208227
Robinson, M. D., McCarthy, D. J., and Smyth, G. K. (2010). edgeR: a bioconductor package for differential expression analysis of digital gene expression data. Bioinformatics 26, 139–140. doi: 10.1093/bioinformatics/btp616
Rolland, J., Silvestro, D., Litsios, G., Faye, L., and Salamin, N. (2018). Clownfishes evolution below and above the species level. Proc. Biol. Sci. 285:20171796. doi: 10.1098/rspb.2017.1796
Rosenblum, E. B., Römpler, H., and Hoekstra, H. E. (2010). Molecular and functional basis of phenotypic convergence in white lizards at White Sands. Proc. Natl. Acad. Sci. U.S.A. 107, 2113–2117. doi: 10.1073/pnas.0911042107
Ruxton, G. D., Sherratt, T. N., and Speed, M. P. (2004). Avoiding Attack: the Evolutionary Ecology of Crypsis, Warning Signals and Mimicry. Oxford, UK: Oxford University Press.
Sherratt, T. N., and Beatty, C. D. (2003). The evolution of warning signals as reliable indicators of prey defense. Am. Nat. 162, 377–389. doi: 10.1086/378047
Simão, F. A., Waterhouse, R. M., Ioannidis, P., Kriventseva, E. V., and Zdobnov, E. M. (2015). BUSCO: assessing genome assembly and annotation completeness with single-copy orthologs. Bioinformatics 31, 3210–3212. doi: 10.1093/bioinformatics/btv351
Sugumaran, M. (2002). Comparative biochemistry of eumelanogenesis and the protective roles of phenoloxidase and melanin in insects. Pigment Cell Res. 15, 2–9. doi: 10.1034/j.1600-0749.2002.00056.x
Talbot, R. (2014). Design & circumstance—sea & reef on a path to success and sustainability for the marine aquarium hobby. Coral 5, 34–43.
Tan, M. H., Austin, C. M., Hammer, M. P., Lee, Y. P., Croft, L. J., and Gan, H. M. (2018). Finding nemo: hybrid assembly with oxford nanopore and Illumina reads greatly improves the clownfish (Amphiprion ocellaris) genome assembly. Gigascience 7, 1–6. doi: 10.1093/gigascience/gix137
Tanaka, Y., Yamamoto, A., Kamata, T., and Simpson, K. L. (1992). Biochemical study on the carotenoids in the anemonefish, Amphiprion spp. Mem. Fac. Fish. Univ. 41, 1–8.
Theissinger, K., Falckenhayn, C., Blande, D., Toljamo, A., Gutekunst, J., Makkonen, J., et al. (2016). De novo assembly and annotation of the freshwater crayfish Astacus astacus transcriptome. Mar. Genomics 28, 7–10. doi: 10.1016/j.margen.2016.02.006
Tibbetts, E. A. (2004). Complex social behaviour can select for variability in visual features: a case study in Polistes wasps. Proc. R. Soc. B Biol. Sci. 271, 1955–1960. doi: 10.1098/rspb.2004.2784
Tibbetts, E. A., Mullen, S. P., and Dale, J. (2017). Signal function drives phenotypic and genetic diversity: the effects of signalling individual identity, quality or behavioural strategy. Phil. Trans. R. Soc. B. 372:20160347. doi: 10.1098/rstb.2016.0347
Wright, R. M., Aglyamova, G. V., Meyer, E., and Matz, M. V. (2015). Gene expression associated with white syndromes in a reef building coral, Acropora hyacinthus. BMC Genomics 16:371. doi: 10.1186/s12864-015-1540-2
Yasir, I., and Qin, J. G. (2009a). Effect of light intensity on color performance of false clownfish, Amphiprion ocellaris cuvier. J. World Aquac. Soc. 40, 337–350. doi: 10.1111/j.1749-7345.2009.00254.x
Yasir, I., and Qin, J. G. (2009b). Impact of background on color performance of false clownfish, Amphiprion ocellaris, cuvier. J. World Aquac. Soc. 40, 724–734. doi: 10.1111/j.1749-7345.2009.00292.x
Yasir, I., and Qin, J. G. (2010). Effect of dietary carotenoids on skin color and pigments of false clownfish, Amphiprion ocellaris, Cuvier. J. World Aquac. Soc. 41, 308–318. doi: 10.1111/j.1749-7345.2010.00373.x
Keywords: marine ecology, evolutionary ecology, transcriptome, genome, melanin pigment, carotenoid pigment, structural coloration, Amphiprion percula
Citation: Maytin AK, Davies SW, Smith GE, Mullen SP and Buston PM (2018) De novo Transcriptome Assembly of the Clown Anemonefish (Amphiprion percula): A New Resource to Study the Evolution of Fish Color. Front. Mar. Sci. 5:284. doi: 10.3389/fmars.2018.00284
Received: 17 May 2018; Accepted: 25 July 2018;
Published: 15 August 2018.
Edited by:
Jose M. Eirin-Lopez, Florida International University, United StatesReviewed by:
Daniel Garcia-Souto, University of Vigo, SpainJian-Wen Qiu, Hong Kong Baptist University, Hong Kong
Copyright © 2018 Maytin, Davies, Smith, Mullen and Buston. This is an open-access article distributed under the terms of the Creative Commons Attribution License (CC BY). The use, distribution or reproduction in other forums is permitted, provided the original author(s) and the copyright owner(s) are credited and that the original publication in this journal is cited, in accordance with accepted academic practice. No use, distribution or reproduction is permitted which does not comply with these terms.
*Correspondence: Sarah W. Davies, daviessw@bu.edu