No apparent cost of disease resistance on reproductive output in Acropora cervicornis genets used for active coral reef restoration in Florida
 Hanna R. Koch
 Yuen Azu1,2
  Erich Bartels
 Erinn M. Muller
- 1Coral Reef Restoration Program, The Elizabeth Moore International Center for Coral Reef Research & Restoration, Mote Marine Laboratory, Summerland Key, FL, United States
- 2Amherst College, Amherst, MA, United States
- 3Coral Reef Monitoring & Assessment Program, The Elizabeth Moore International Center for Coral Reef Research & Restoration, Mote Marine Laboratory, Summerland Key, FL, United States
- 4Coral Health & Disease Program, Mote Marine Laboratory, Sarasota, FL, United States
As assisted sexual reproduction interventions continue to become embedded within coral reef restoration initiatives, it is important to understand the potential for trade-offs between key traits like reproductive output and disease resistance. Oocyte size and fecundity, quantitative measures of reproductive output and important life-history traits, can be used as proxies for coral reproductive success and health. Sexual reproduction, particularly gametogenesis, is an energetically costly process and at the physiological level, trade-offs are caused by competitive allocation of limited resources to various functions. However, resource allocation trade-offs may also have a genetic basis, and thus, different genets may differ in these aspects. Therefore, the purpose of this study was to assess the reproductive output of A. cervicornis genets with known white-band disease resistance or susceptibility by quantifying the number and size of oocytes within colonies maintained within Mote Marine Laboratory’s offshore coral spawning nursery in the Lower Florida Keys, USA. We also quantified the number of eggs and sperm packaged within gamete bundles that were collected during the August 2020 spawning event. Consistent with previous studies, we found a positive correlation between colony size and fecundity. Interestingly though, we found no evidence for a trade-off between disease resistance and reproductive output and instead found a negative correlation between disease susceptibility and oocyte size. These data are relevant for population management interventions and for managing broodstock used for active restoration where a suite of corals with different genotypes and phenotypes are continuously propagated and outplanted. Having a more comprehensive understanding of the fitness differences among candidates can help guide such efforts and ensure that a diversity of fit genets is used for restoration, which should ultimately support greater adaptive potential and population resilience.
1 Introduction
Coral reefs are among the most biodiverse ecosystems on Earth, providing a multitude of critical environmental services and functions (Pratchett et al., 2014; Hoegh-Guldberg et al., 2019; Robinson et al., 2022). Despite their integral role in maintaining healthy marine communities, scleractinian corals continue to decline in abundance and health at unprecedented rates as a result of global and local stressors (Hoegh-Guldberg, 1999; Hughes et al., 2003; Hughes et al., 2017; Hughes et al., 2018). As such, they too are facing the biodiversity extinction crisis that our planet is currently experiencing. To prevent the complete collapse of these vital ecosystems, concerted efforts at all levels -from local to federal to international- are being made to intervene before it becomes too late to rescue them from the brink of extinction.
Active coral restoration has emerged as a promising interim strategy to promote faster population and reef recovery by rapidly increasing coral cover (Lirman et al., 2010; NMFS, 2015; Caruso et al., 2021), as well as increasing the genetic diversity and adaptive potential of restored populations (Boström-Einarsson et al., 2020), while efforts within the regulatory arena continue to address the source(s) of coral decline. Integrating basic and applied sciences is necessary to identify gaps in our knowledge, formulate strategies, test potential solutions, and apply interventions supporting coral reef restoration. Some public and/or non-profit organizations like zoos and aquariums have a unique opportunity to conduct both basic and applied research in a way that facilitates faster implementation of tested ideas. For example, Mote Marine Laboratory and Aquarium in Florida (USA) is an independent, nonprofit marine research institution that hosts more than 25 marine-related research programs focused on sustainability and conservation, as well as a public aquarium dedicated to marine science education and outreach. It is an AZA-accredited (Association of Zoos and Aquariums) institution and is home to one of the world’s most comprehensive, science-based coral reef restoration programs. This program has the ability to carry out every aspect of coral restoration, in-house, and integrates coral reef scientists and experts from a diversity of disciplines to conduct research on -or apply interventions related to- asexual coral propagation (Schopmeyer et al., 2012; Forsman et al., 2015; Page, 2015; Schopmeyer et al., 2017; Page et al., 2018; Koch et al., 2021b; Merck et al., 2022), sexual coral propagation (Koch, 2021a), disease (Klinges et al., 2020; Clark et al., 2021; Williams et al., 2021), ocean acidification (Hall et al., 2015; Page et al., 2021), thermotolerance, symbiosis (e.g., (Klepac et al., 2015)), resilience screening (Muller et al., 2018), outplanting, coral reef monitoring, gene banking, land and field nursery management (Merck et al., 2022), and the culture/distribution of benthic invertebrate grazers across the reef tract (e.g., (Spadaro and Butler, 2021)).
Since 2008, Mote scientists have planted more than 157,000 corals of multiple native species and more than 325 genetic varieties (‘genets’) to restore depleted reefs in Florida. Since 2018, it has produced (via assisted sexual reproduction) more than 10,000 new genets of various threatened stony coral species for research and active restoration. Mote scientists developed the micro-fragmentation/coral reskinning methodology for restoration purposes (Forsman et al., 2015; Page, 2015; Page et al., 2018) and documented the first outplants (created using this technique) of a slow-growing massive coral species to reach sexual maturity and spawn after being restored in nature -and in record time (Koch et al., 2021a). Mote partners with NOAA, the Florida Keys National Marine Sanctuary (FKNMS), and others to carry out Mission: Iconic Reefs, which is an unprecedented effort to restore seven ecologically and culturally significant coral reefs within the Florida Keys National Marine Sanctuary. It is also a part of the AZA-Florida Reef Tract Rescue Project, a conservation network of zoos and aquariums focused on the rescue, housing and future propagation of Florida corals affected by stony coral tissue loss disease. Integral to these missions, and to the restoration of Florida’s Coral Reef as a whole, is sexual propagation of corals, also referred to as assisted sexual reproduction (ASR) or managed breeding.
Sexual reproduction is absolutely critical to the long-term persistence of any species, including stony corals (Baums et al., 2019). It is an important source of genetic variation that can increase the adaptive potential and resilience of a population. Unfortunately, though, many of Florida’s most important reef-building or habitat-providing species are experiencing persistent recruitment failure and new generations of coral offspring are failing to show up on reefs (Hughes and Tanner, 2000; Williams et al., 2008; van Woesik et al., 2014; Miller et al., 2018). Causes are attributed to factors including Allee effects (e.g., sperm limitation) where populations of broadcast spawning species are too sparse to support successful fertilization during annual reproduction events (Levitan et al., 2004), disruption in cues used for regulating the timing of gamete release resulting in asynchronous spawning (Shlesinger and Loya, 2019), as well as reductions in the availability of suitable settlement habitat for coral larvae due to a phase shift from coral-dominated to algal-dominated benthic communities on reefs in the Caribbean region (Hughes, 1994; Pandolfi et al., 2003). As a result, scientists and practitioners are having to step in to carry out ASR in the lab to ensure the benefits of sexual reproduction are realized for restored populations. As ASR interventions continue to become embedded within coral reef restoration initiatives (Calle-Trivino et al., 2018; Randall et al., 2020), it is important to understand the potential for trade-offs between key traits like reproductive output and disease resistance.
One of the primary goals of coral restoration is to create restored populations with enough genotypic and phenotypic variation so that they can effectively respond to changing environmental conditions (Baums et al., 2019). Whether outplanting or breeding corals for restoration, it is important to consider a wide range of fitness-related traits (i.e., phenotypes) and the potential for trade-offs. Oocyte size and fecundity are quantitative measures of reproductive output and represent important life-history traits. As such, they are often used as proxies for coral reproductive success and health (Kojis and Quinn, 1985; Ward and Harrison, 2000; Graham and van Woesik, 2013; Alvarez-Noriega et al., 2016; Paxton et al., 2016; Pratchett et al., 2019; Foster and Gilmour, 2020). Sexual reproduction, particularly gametogenesis, is an energetically costly process and at the physiological level, trade-offs are caused by competitive allocation of limited resources to various functions. However, resource allocation trade-offs may also have a genetic basis, and thus, different genets may differ in these aspects. Therefore, the purpose of this study was to assess the fecundity of a number of Acropora cervicornis genets previously identified as being white-band disease resistant or susceptible (Muller et al., 2018), and which are actively being used for asexual and sexual propagation activities associated with Mote’s ongoing restoration efforts on Florida’s Coral Reef.
Once dominant on Florida’s Coral Reef (Precht et al., 2002), A. cervicornis has experienced a 95% population reduction in recent decades (Acropora Biological Review Team, 2005) as a result of concurrent local and global stressors including habitat degradation, bleaching events associated with increasing sea-surface temperatures, and incidences of infectious disease (Hemond and Vollmer, 2010; Gignoux-Wolfsohn et al., 2012; Enochs et al., 2014; Drury et al., 2016; Precht et al., 2016; Goergen et al., 2019). Outbreaks of white-band disease in late 1970’s and early 1980’s are responsible for mass mortality events (Aronson and Precht, 2001), and occurrences are still present (Williams and Miller, 2012; Miller et al., 2014), despite there being only a few wild populations remaining in Florida. Nonetheless, variability in susceptibility to the disease exists (Vollmer and Kline, 2008) and some genets appear disease resistant (Muller et al., 2018). While the mechanisms conferring this resistance (Klinges et al., 2020), and whether it is heritable, are areas of active research, these genets have been incorporated into ongoing restoration efforts to promote the survival of restored populations. Because previous research did not find evidence of a trade-off between disease resistance and temperature tolerance (Muller et al., 2018), we wanted to extend this investigation to consider other key traits, specifically reproductive output. We hypothesized that if a trade-off exists between disease resistance and reproductive output, colonies of disease resistant genets may produce fewer or smaller eggs, when controlling for colony size, which is known to positively correlate with fecundity in many cases (Sakai, 1998b; Nozawa and Lin, 2014).
2 Materials and methods
2.1 Colony morphometric and health assessments
Acropora cervicornis (Order: Scleractinia) is a hermaphroditic broadcast-spawning species with an annual reproductive event typically following the August full moon in the western Atlantic region (Szmant, 1986; Harrison and Wallace, 1990). In the weeks preceding the predicted mass spawning event, we assessed the size and health of ten replicate adult colonies of Mote genets 1, 3, 7, 13, 31, 34, 41, 44, 47, 50, 62, and 63 (Muller et al., 2018) held within Mote Marine Laboratory’s offshore spawning nursery at Sand Key (see Table 1). White-band disease resistant genets include 3 and 7, while genets 1, 13, 41, 44, 47, 50, 62 and 63 are white-band disease susceptible (Muller et al., 2018). Susceptibility was quantified as the probability of disease on a scale of 0 (resistant) to 1 (highly susceptible) (see Muller et al., 2018). We measured the size (dimensions, cm) of the 120 colonies by using a PVC ruler to obtain maximum length (L), perpendicular width (W), and height (H), measured perpendicular to the plane of the benthic substrate. To calculate colony volume (cm3), we used the following ellipsoid formula to account for the morphology of this branching species (Kiel et al., 2012; Huntington and Miller, 2014):
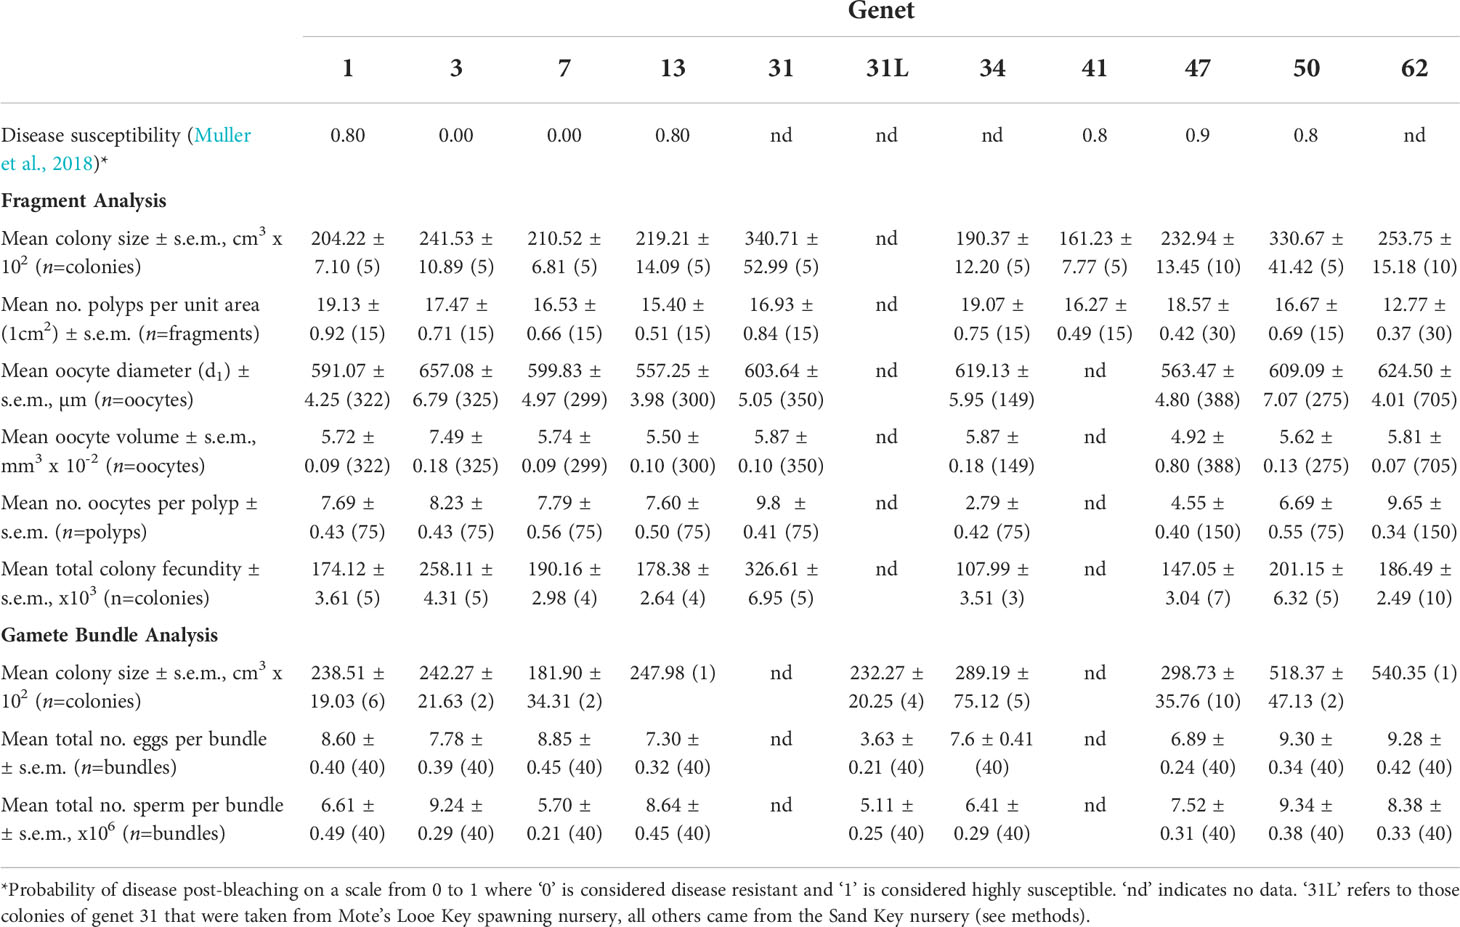
Table 1 Mean values for all metrics.
We visually assessed the condition of every colony to ensure we were working only with apparently healthy corals (i.e., no paling, bleaching or active disease). The other purpose of these assessments was to identify a subset of colonies of sexually mature (puberty) size to be used for this study since sexual maturity is size-dependent in stony corals (Szmant, 1986; Babcock, 1991; Soong and Lang, 1992) and reproductive output (i.e., fecundity) can be negatively impacted by poor colony health (Rinkevich, 1996; Ward and Harrison, 2000; Borger and Colley, 2010; Graham and van Woesik, 2013; Paxton et al., 2016). For the primary fecundity analysis, we selected five healthy replicate colonies per genet that were above the estimated reproductive size of this species, which is approximately 25-30 cm maximum diameter or ~5,000-10,000 cm3 (Soong and Lang, 1992; Schopmeyer et al., 2017).
2.2 Sampling and fragment decalcification
After the initial assessments, we returned to the nursery to randomly sample three fragments per five replicate colonies from all 12 genets (N=60 colonies, N=180 fragments). We removed branch fragments approximately 10 cm in length from the central (oldest) region of the colony (Foster and Gilmour, 2020) using bone cutters and then transported them back to the lab where the top 2-3 cm ‘sterile zone’ (Wallace, 1985; Soong and Lang, 1992) of each fragment was removed before placing it in a 50 mL falcon tube with a 10% formalin solution that was prepared using filtered seawater. After 48 hours of fixing at room temperature, we triple rinsed each fragment and its tube with DI water and then resubmerged each fragment in its tube with a 5% hydrochloric acid (HCl) solution to initiate skeleton decalcification. After another 48 hours, we replaced the 5% HCl solution with 10% HCl and refreshed it every 2-3 days until fragments were fully decalcified. Decalcified fragments were again triple rinsed with DI water and then preserved in a 70% ethanol solution until they were dissected, which was typically within 72 hours. Before decalcification, we recorded the number of polyps per unit colony surface area (1 cm2), which was measured from the base of each sampled fragment.
2.3 Fragment dissections and fecundity measurements
Under a dissecting microscope, we used a scalpel to make a longitudinal incision along the tissue sample to expose the interior of the fragment and randomly select five polyps for extraction. From each of the five polyps (N=900 polyps), we counted the total number of late Stage III and early Stage IV oocytes (Szmant, 1986; Foster and Gilmour, 2020) to determine polyp fecundity (see Table 1). We then randomly chose five oocytes per polyp to quantify their size using a compound microscope (4x objective lens) and 10x ocular micrometer (40x total). For each oocyte, we measured its longest diameter (d1), its shortest diameter (d2), and used the formula for a prolate spheroid, including a calibration factor, to calculate oocyte volume (mm3) (Vargas-Angel et al., 2006; Okubo et al., 2007; Borger and Colley, 2010) (see Table 1). The formula is as follows:
Total colony fecundity was calculated as: (colony volume) x (mean number of polyps per unit area) x (mean number of oocytes per polyp) x (mean oocyte volume per polyp).
2.4 Coral spawning and gamete bundle fecundity measurements
A few days before the August full moon, we transported replicate adult colonies of Mote genets 1, 3, 7, 13, 34, 44, 47, 50, and 62 (N=53 total colonies) from the Sand Key spawning nursery to Mote’s Elizabeth Moore International Center for Coral Reef Research and Restoration on Summerland Key, FL. All colonies were healthy, of puberty size, and gravid (see Table 1). We did not bring in genet 41 for spawning because we determined from the fragment fecundity analysis that no colony of genet 41 was gravid (i.e., did not contain gametes). Furthermore, in between when colonies were sampled for the fragment fecundity analysis and brought in for spawning, the entire coral tree containing genet 31 was lost due to a failure of the line securing the tree to the seafloor anchor, presumably as a result of turbulent weather. We instead brought in five healthy, puberty-sized, gravid colonies of genet 31 from Mote’s Looe Key spawning nursery (herein referred to as ‘genet 31L’) which is approximately 30 miles northeast of Sand Key.
On land, corals were held in round fiberglass flow-through mesocosms (1,800 L volume) with aeration and filtered seawater pumped in from the adjacent canal (ambient seawater temperature of ~28°C, pH 8, and salinity ~36 ppt). Two genets were held within each mesocosm and separated by mesh barriers (110 µm) that allowed seawater -but not gamete bundles- to flow through. We monitored the corals for spawning over a 7-night period following the August 3rd full moon. On the first night a genet had a full spawn, we randomly sampled 40 intact gamete bundles at the water’s surface using a 1 mL transfer pipette. Which colonies the gamete bundles could have come from was recorded. Each gamete bundle, in approximately 0.5 mL of seawater, was placed into a 3 mL glass vial and inverted multiple times to break up the bundle and release the eggs from sperm. We then immediately added ~2 mL of a 10% formalin in seawater solution to fix the gametes. The vials were placed in a box without exposure to light and stored at room temperature until sperm concentrations could be quantified a week later. The eggs are visible with the naked eye and two independent observers counted the total number of eggs per bundle in each vial, with a third observer replicating counts if different values were obtained from the first two observers (Table 1). Replicate sperm counts (n=4) per sample were measured using a hemocytometer and compound microscope (Table 1). The total number of sperm per bundle was calculated by multiplying the sperm concentration (per mL) by the total volume of the vial.
2.5 Data analyses
We performed all statistical analyses in R v.4.0.3 (R Core Team, 2020). After sampling, it was determined that genets 44 and 47 were clones, as were 62 and 63. Thus, we combined data for each set of genets and maintained genet names 47 and 62 for the analyses herein. As previously mentioned, for genet 31, the fragment fecundity analysis is based on colonies collected from the Sand Key spawning nursery, while the gamete bundle fecundity analysis is based on colonies collected from the Looe Key spawning nursery. Data were checked for normality using the Shapiro–Wilk test and for equality of variance using Levene’s test or the Fligner-Killeen test if data were not normally distributed. Non-parametric tests were used when data violated assumptions of normality.
2.5.1 Fragment fecundity analysis
To compare across genets (a) the size of parent colonies, (b) the number of polyps per unit area, and (c) total colony fecundity, we used an omnibus test (Kruskal-Wallis) followed by Dunn’s post-hoc test with the Bonferroni correction factor to identify significant pairwise differences. To explore the direction and strength of association between the various numeric variables, we constructed a correlogram (correlation matrix) and conducted (non-parametric) pairwise correlation tests to determine Spearman’s rank correlation coefficients (rho) for each pair of variables. Conducting multiple pairwise tests can result in Type I error, so to evaluate the robustness of our results, we used regression analyses to describe the dependency of our numerical response variables (oocyte number or size) on our predictors (colony size, genet, disease susceptibility). Post-bleaching disease susceptibility values were obtained from Muller et al., 2018. We conducted model fitting and stepwise selection of predictors using model parsimony (Akaike information criterion, AIC) to select the best fit model of our data.
2.5.2 Gamete bundle fecundity analysis
We used similar statistical tests for the gamete bundle fecundity analysis except that regression analyses could not be used owing to insufficient replication at the colony level so omnibus and post-hoc tests were used to evaluate genet-specific differences for the response variables of total eggs and sperm per bundle.
3 Results
3.1 Parent colony size
Colony sizes significantly differed across genets (Kruskal-Wallis: X2 = 27.89, d.f. = 9, p-value< 0.001) with genet 41 being significantly smaller than 31, 50, and 62 (post-hoc Dunn test with Bonferroni correction factor: p-adj. = 0.00772, 0.00801, 0.01918, respectively) (Figure 1A). Initial colony size ranged from 15 to 30 cm diameter when the coral spawning nursery was assembled in August 2019 so final colony sizes are likely a reflection of the initial starting size and inherent differences in growth rates.
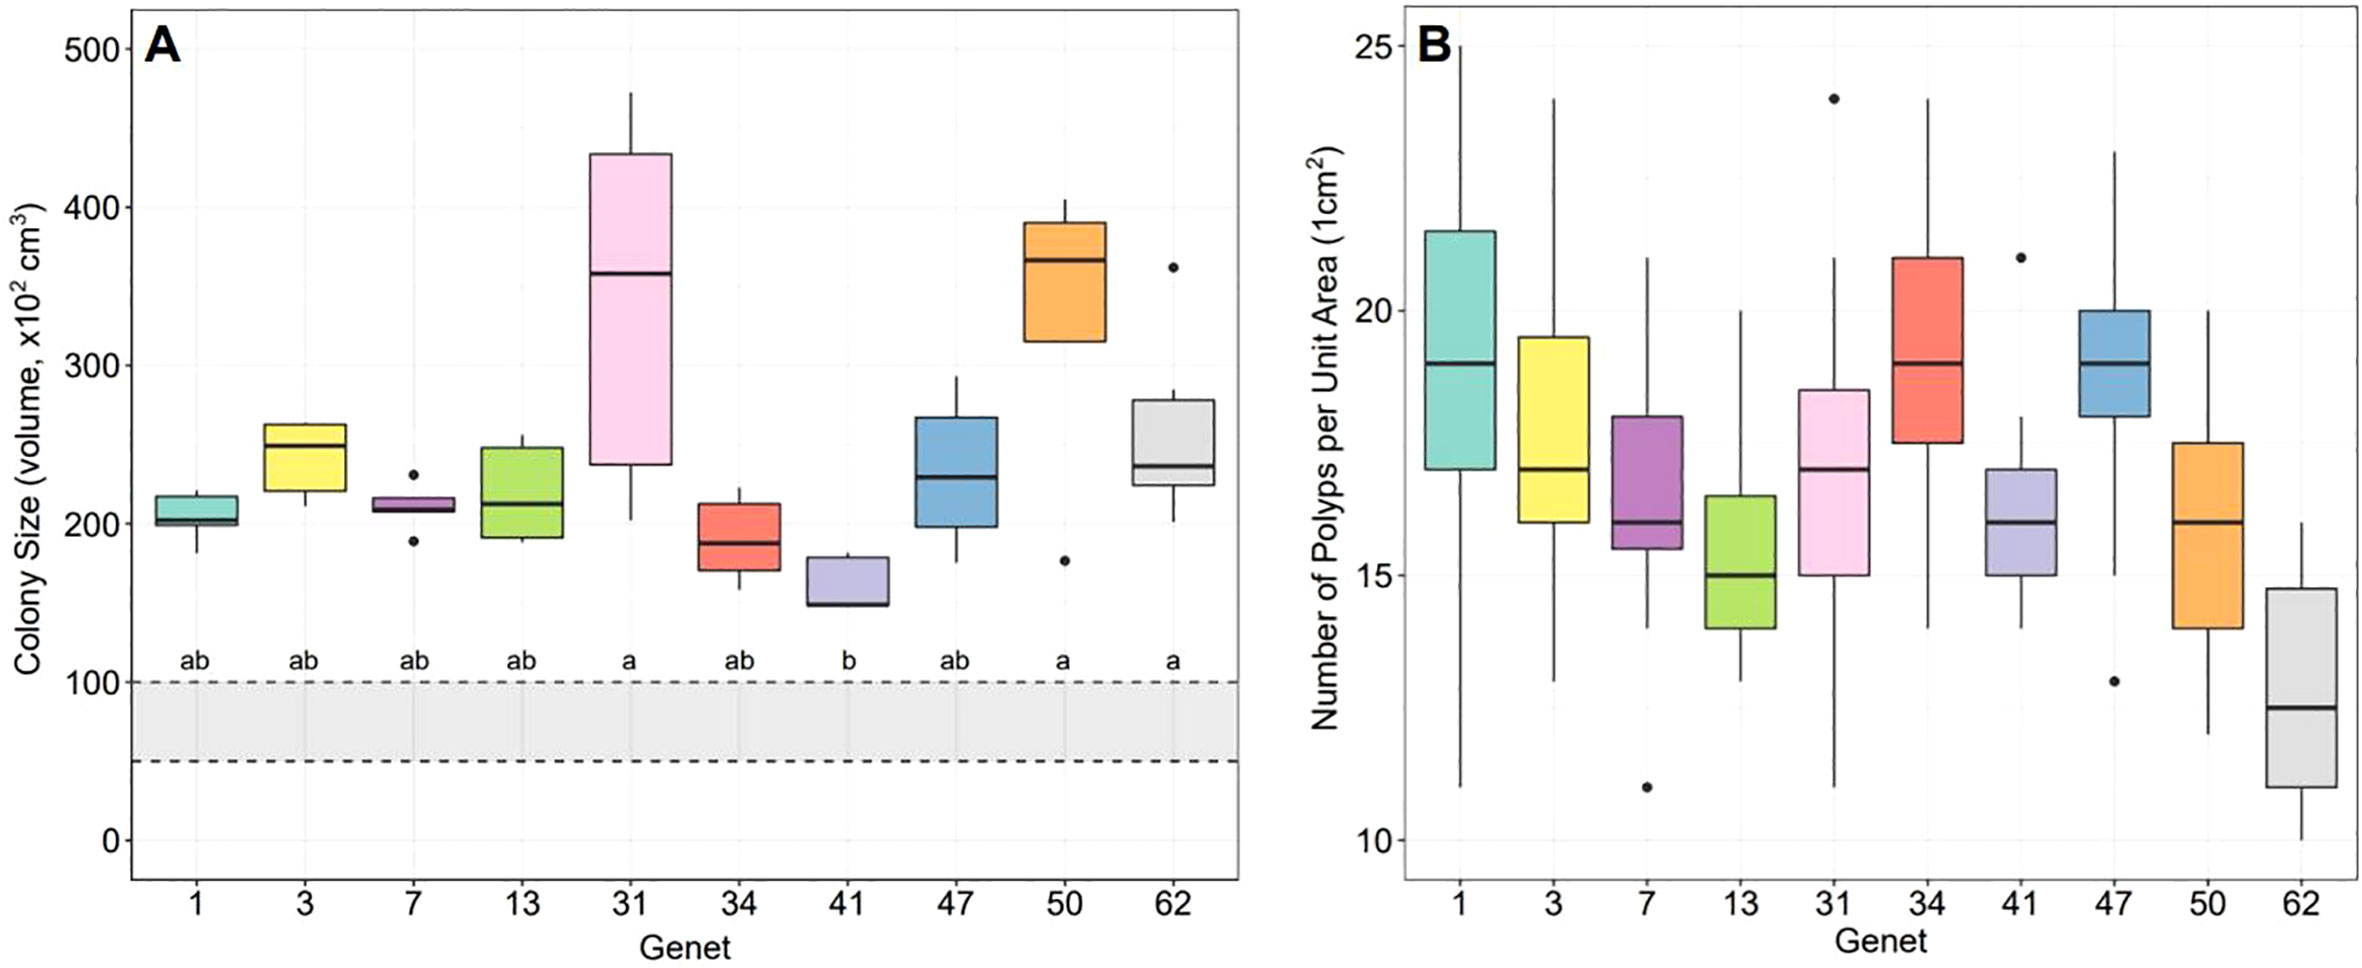
Figure 1 Parent colony size and number of polyps per unit area for ten A. cervicornis genets as part of the fragment fecundity analysis. (A) Colony sizes significantly differed across genets with genet 41 being significantly smaller than 31, 50, and 62 (statistics in text). Lowercase letters (a, b) indicate the results of the post hoc test where genets with the same letter are not statistically different. The gray shaded region within the black dashed lines represents the estimated puberty size predicted for this species, which is approximately 25-30 cm in diameter, or ~5,000-10,000 cm3. (B) The number of polyps within an area of 1cm2 significantly differed across genets (statistics in text) with differences attributed to the variation observed in the size and spacing of polyps.
The number of polyps cm-2 significantly differed across genets (Kruskal-Wallis: X2 = 75.43, d.f. = 9, p-value< 0.0001) with genet 62 having significantly fewer polyps per unit area than all other genets except 13 and 50, and with genet 13 having significantly fewer polyps per unit area than genets 1, 34 and 47 (Dunn test with Bonferroni correction: p-adj. for 62:1 = 0.0; 62:3 = 0.0002; 62:7 = 0.0053; 62:31 = 0.0021; 62:34 = 0.0; 62:41 = 0.0246; 62:47 = 0.0; 13:1 = 0.0301; 13:34 = 0.0283; 13:47 = 0.0103) (Figure 1B). These differences are attributed to the variation observed in the size and spacing of polyps for the different genets. For example, genets with fewer polyps per unit area were observed to have either larger polyps or larger spaces between polyps [e.g., (Sakai, 1998b)].
3.2 Correlations
Among the numeric variables, we found multiple significant positive and negative correlations (Figure 2). Consistent with similar studies, we found a significant positive correlation between colony size and fecundity (i.e., number of oocytes per polyp) (rho = 0.55, p-value< 0.0001) indicating that larger colonies are more fecund (Figure 2B). We also found a significant positive correlation between fecundity and oocyte size (rho = 0.34, p-value< 0.05) suggesting that colonies with more eggs also had larger eggs (Figure 2H). There was a significant negative correlation between number of polyps per unit area and polyp fecundity (rho = -0.33, p-value < 0.01; Figure 2E), suggesting that the more, and potentially smaller polyps there were in a unit area, the fewer oocytes there were in each of those polyps. Finally, there was a significant negative correlation between oocyte size and disease susceptibility (rho = -0.52, p-value< 0.01) suggesting that more disease susceptible corals produced smaller eggs (Figure 2J).
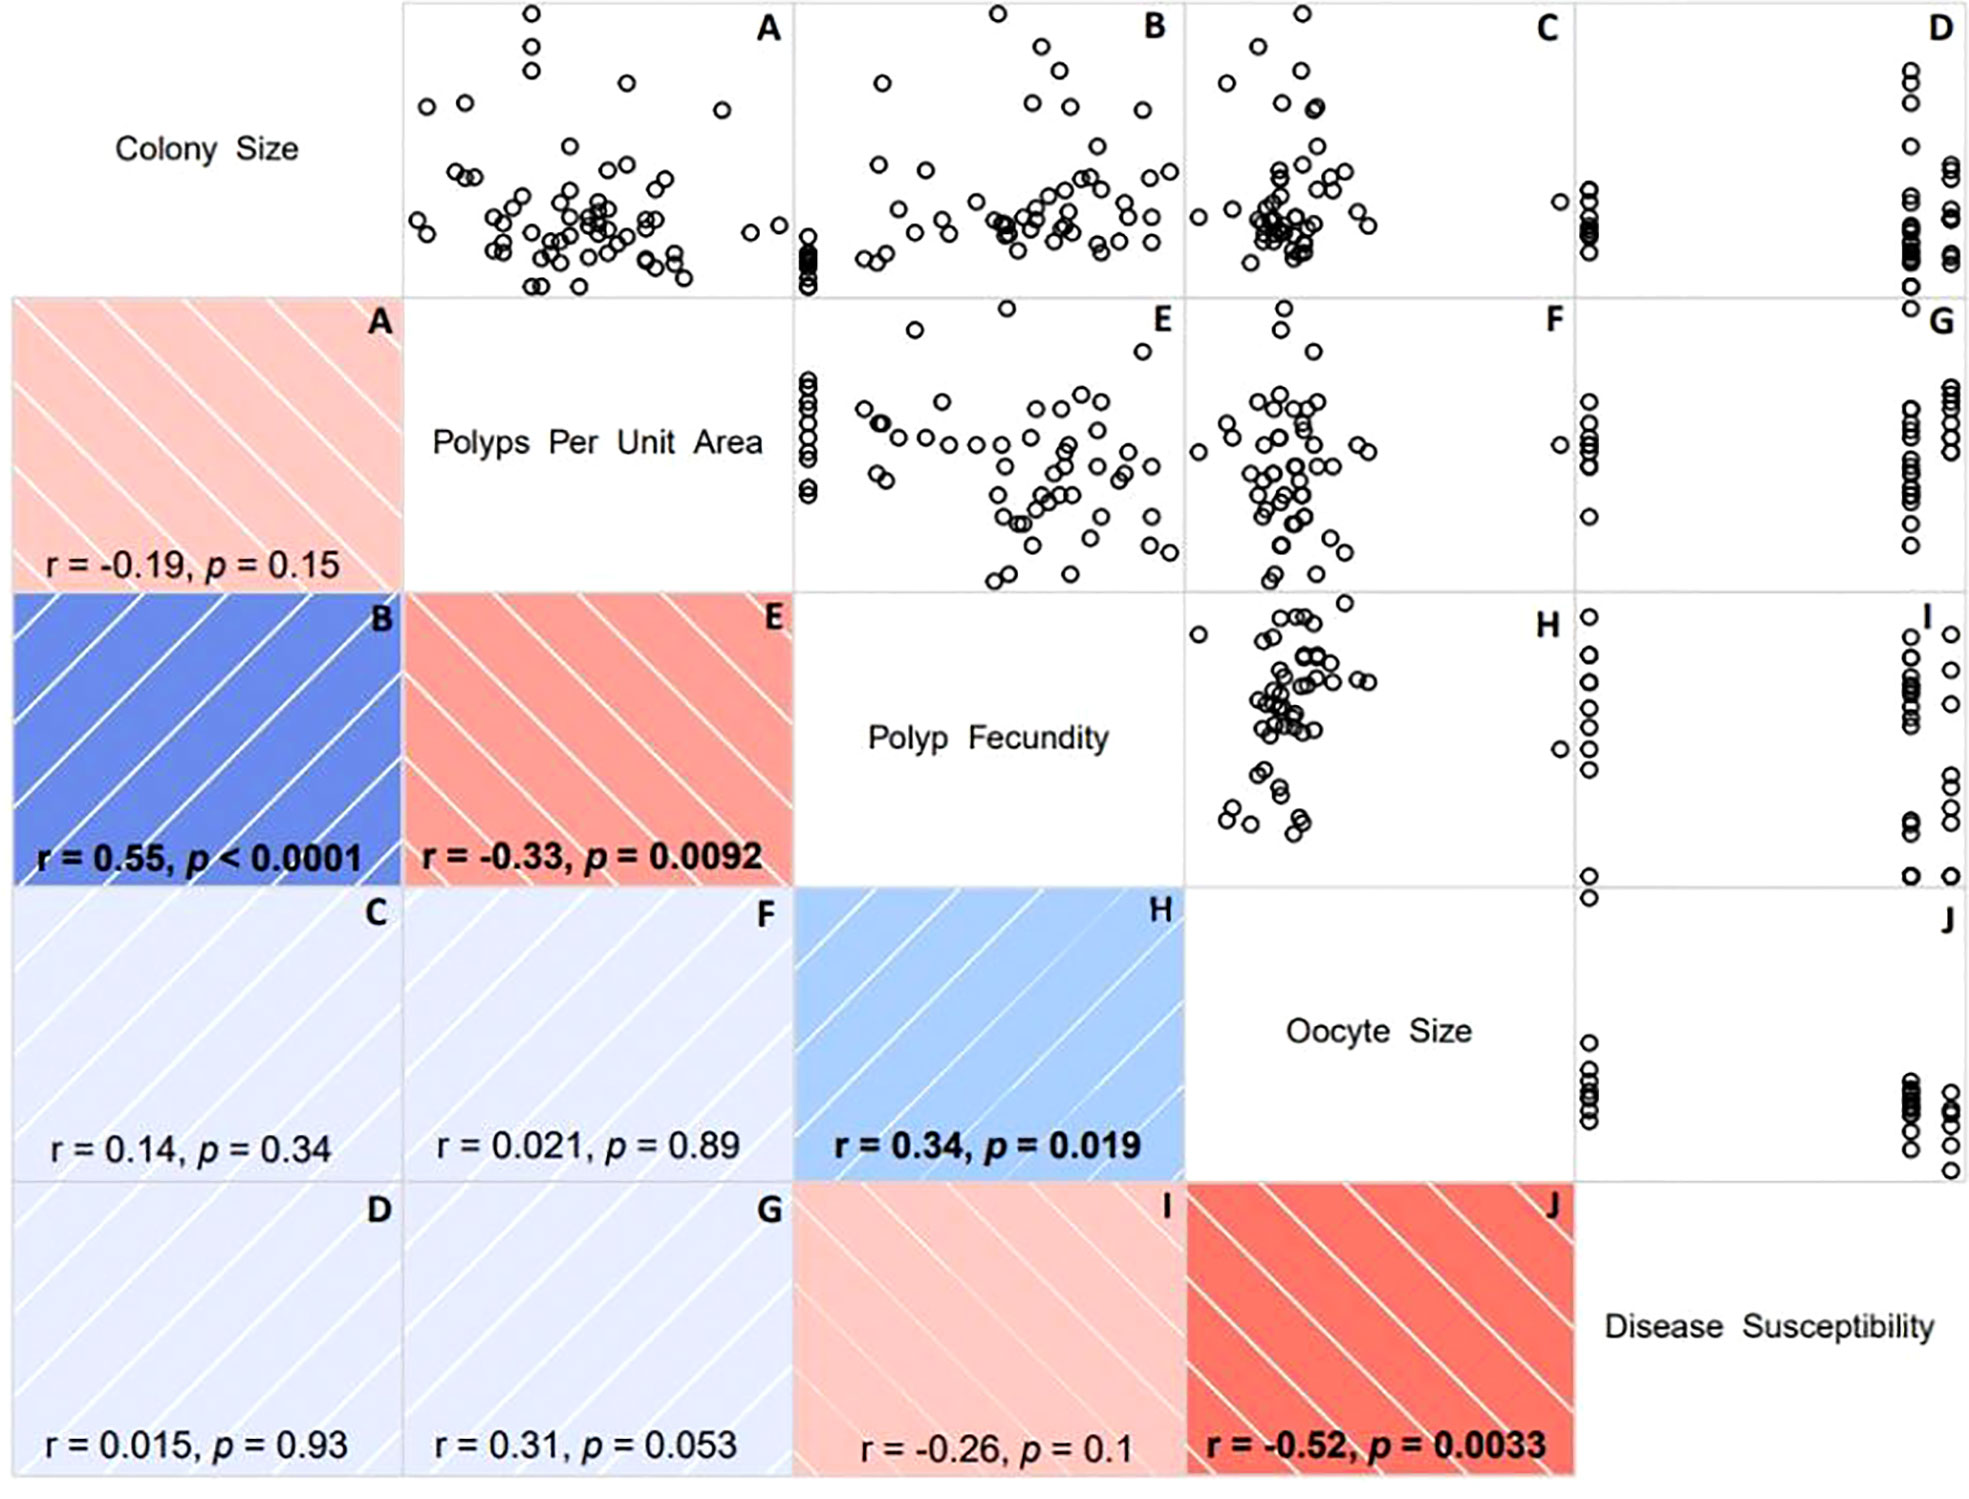
Figure 2 Correlogram (correlation matrix) displaying the relationship between each pair of numeric variables as part of the fragment fecundity analysis. (A) Colony Size & Polyps Per Unit Area; (B) Colony Size & Polyp Fecundity; (C) Colony Size & Oocyte Size; (D) Colony Size & Disease Susceptibility; (E) Polyps Per Unit Area & Polyp Fecundity; (F) Polyps Per Unit Area & Oocyte Size; (G) Polyps Per Unit Area & Disease Susceptibility; (H) Polyp Fecundity & Oocyte Size; (I) Polyp Fecundity & Disease Susceptibility; and (J) Oocyte Size & Disease Susceptibility. Disease susceptibility, quantified as the probability of disease, ranges from 0 (maximum resistance) to 1 (maximum susceptibility) (see Muller et al., 2018). Scatterplots for each pair of variables is mirrored by visualization of the correlation coefficient including the direction (color) and strength of the association (color intensity). Blue indicates a positive association/correlation while red represents a negative one. Color intensity is proportional to the correlation coefficient where dark blue or red indicates a stronger association and vice versa. For each pair of variables, we calculated rank-based correlation coefficients using Spearman’s rho (r). The significance of the correlation is indicated by the p-value. Significant correlations are bold in the correlogram.
3.3 Reproductive output and total colony fecundity
To visualize the relationship between mean oocyte number and size for each genet, as well as across genets, we plotted data from our fragment fecundity analysis (Figure 3A). For the trait of polyp fecundity, we found that it depended on genet and colony size (LM: F10,49 = 4.84, p-value< 0.0001) with genet 34 being the least fecund (p-value< 0.05). Visualization of the model revealed a positive association between colony size and fecundity, which is consistent with our correlation analysis. For the trait of oocyte size, we found that it depended on genet and disease susceptibility (LM: F5,24 = 2.77, p-value< 0.05) with genet 3 having the largest eggs (p-value< 0.05). Visualization of the model revealed a negative association between disease susceptibility and oocyte size, which again is consistent with our correlation analysis.
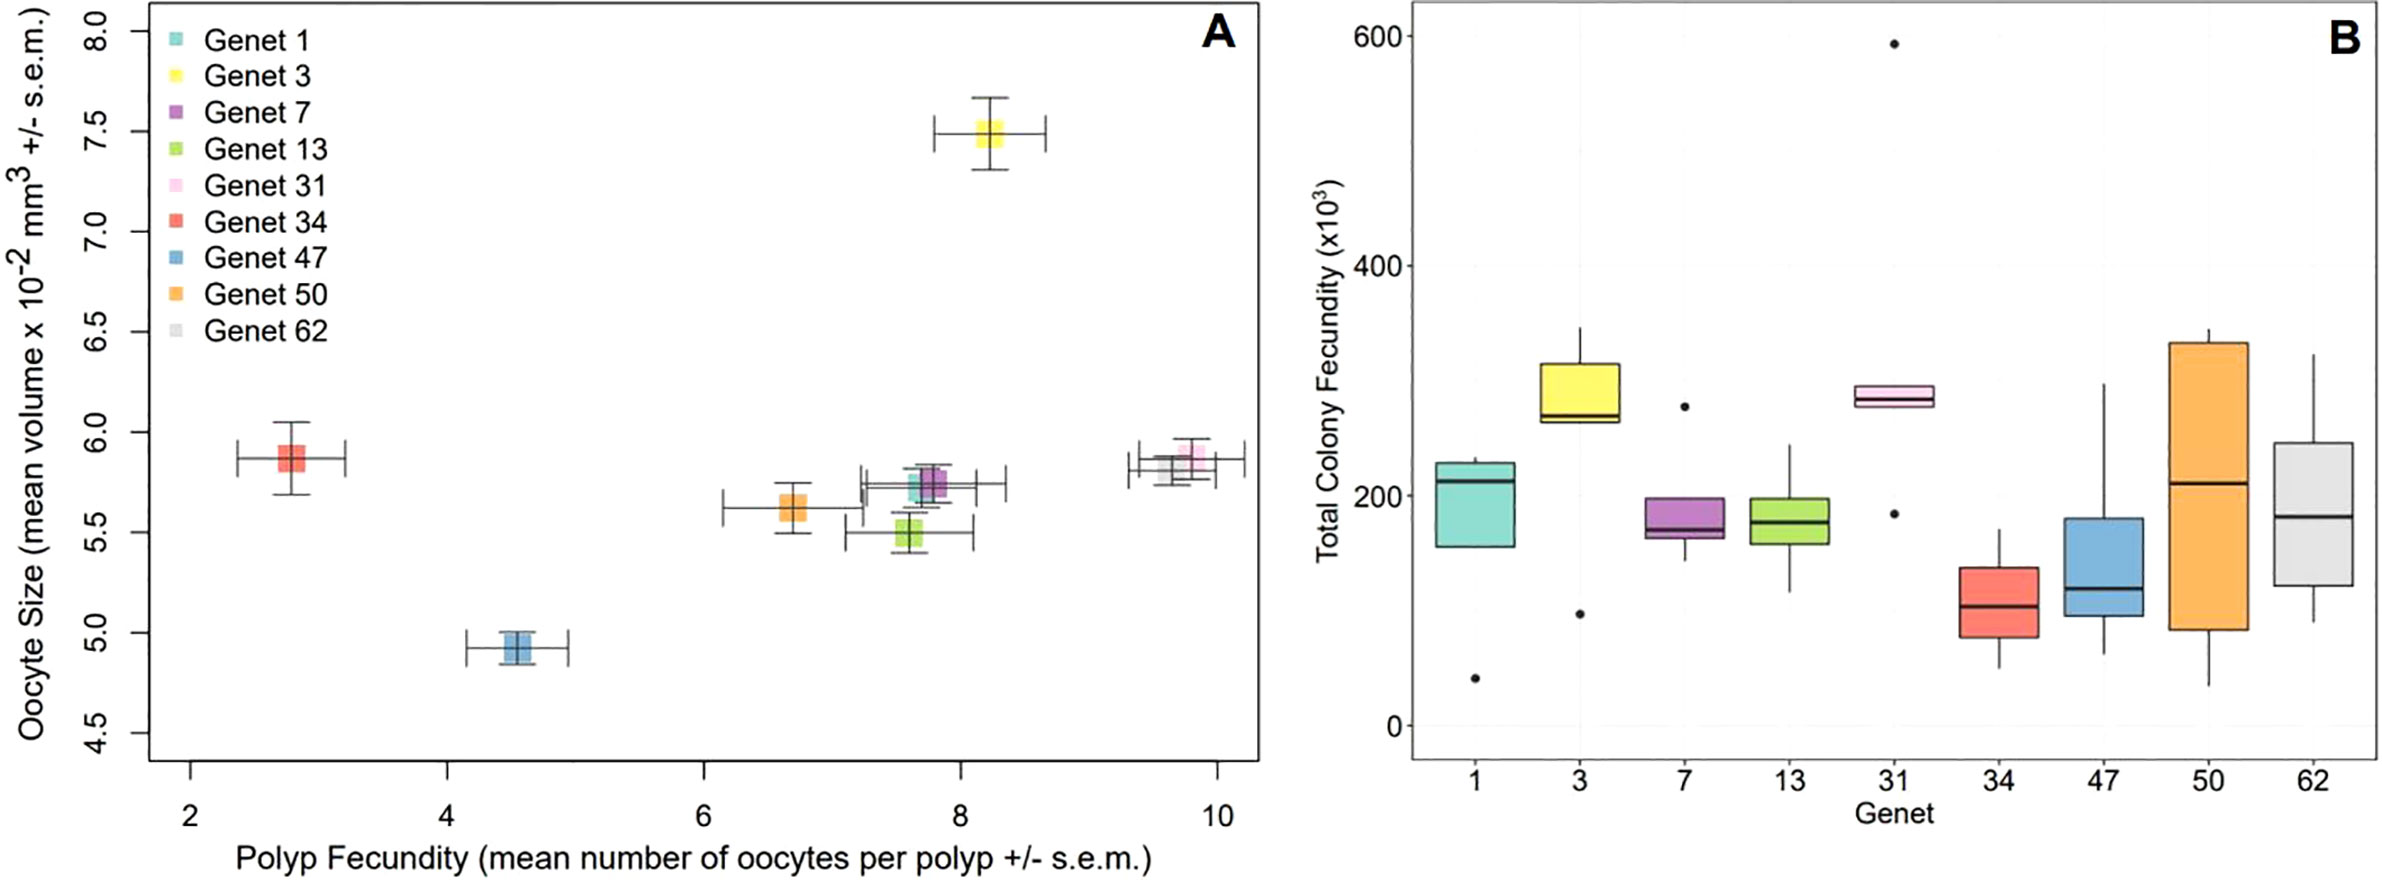
Figure 3 Relationship between mean oocyte size and number, as well as total colony fecundity, for nine A. cervicornis genets. (A) Significant predictors of polyp fecundity (mean number of oocytes per polyp ± s.e.m.) included genet (LM: F = 4.89, p-value< 0.001) and colony size (LM: F = 8.63, p-value< 0.01). Significant predictors of mean oocyte size ± s.e.m. included genet (LM: F = 4.84, p-value< 0.01) and disease susceptibility (LM: F = 13.41, p-value< 0.001). Genets 3 and 7 are disease resistant. Genet 3 had significantly larger eggs while genet 47 had the smallest. Genets 31 and 62 were the most fecund while genet 34 was the least fecund. (B) Total colony fecundity did not significantly differ across genets (statistics in text), likely due to high variability in the data, but genets 3 and 31 had the highest median values relative to the other genets. Genet 41 was not gravid and therefore not included in either of these analyses.
Total colony fecundity (TCF) per replicate colony and genet was calculated by multiplying all parameters for the fragment fecundity analysis including colony size, mean polyps per unit area, mean polyp fecundity, and mean oocyte size. Genets 3 and 31 had the highest median values for TCF but there were no statistically significant differences (Kruskal-Wallis: X2 = 12.12, d.f. = 8, p-value = 0.1444) (Figure 3B).
3.4 Gamete bundle fecundity
As a secondary assessment of fecundity, we quantified the total number of eggs and sperm within replicate gamete bundles collected from each genet during spawning. The colonies used for the fragment fecundity analysis were not necessarily the same as those brought in for spawning and used for the gamete bundle fecundity analysis, so we measured the size of these parental colonies and found no significant differences among genets (Kruskal-Wallis: X2 = 11.97, d.f. = 8, p-value = 0.1526) (Figure 4A). This is likely due to the high variability among replicate colonies within genets; variances did not significantly differ either (Levene’s Test: F = 1.23, d.f. = 8, p-value = 0.3245). Nonetheless, genets 50 and 62 had the highest median values for colony size, while genet 7 had among the smallest.
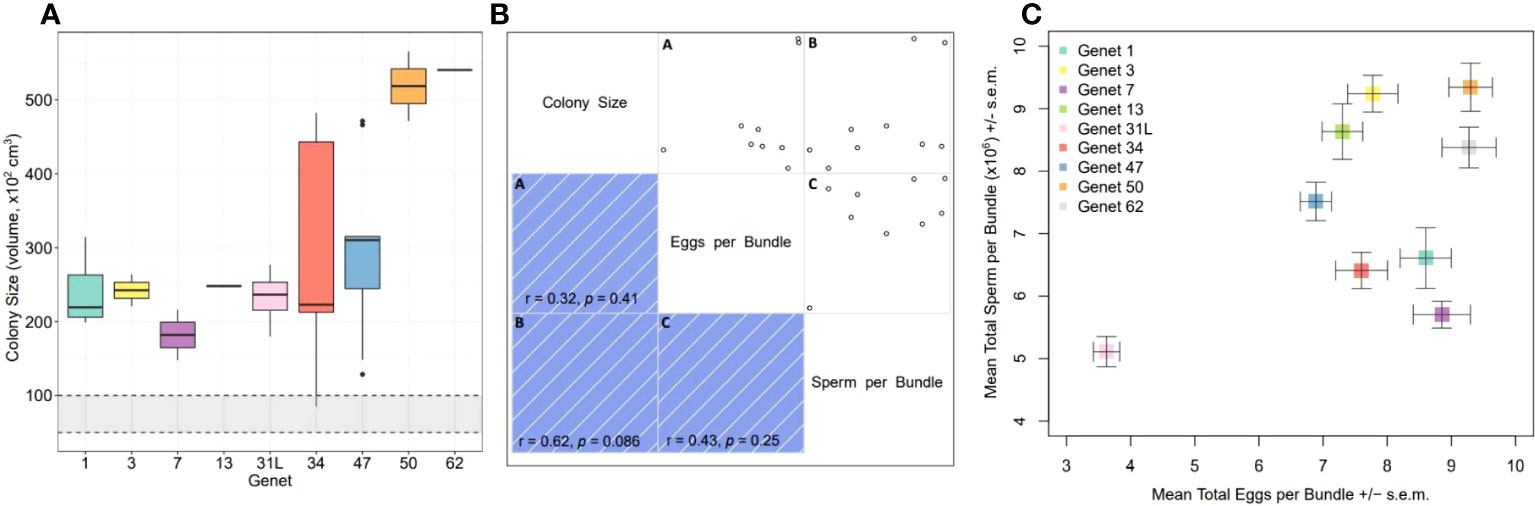
Figure 4 Gamete bundle fecundity analysis for nine A. cervicornis genets. (A) Colony size of the parents that the gamete bundles were collected from did not significantly differ across genets (statistics in text). The gray shaded region within the black dashed lines represents the estimated puberty size predicted for this species. Genet 31L refers to the colonies that came from a different nursery and which represent different colonies used in the fragment fecundity analysis (see methods). (B) Correlogram (correlation matrix) displaying the relationship between each pair of numeric variables as part of the gamete bundle fecundity analysis including mean colony size, mean total eggs per bundle, and mean total sperm per bundle. Scatterplots for each pair of variables is mirrored by visualization of the correlation coefficient including the direction (color) and strength of the association (color intensity). Blue indicates a positive association/correlation; color intensity is proportional to the correlation coefficient where darker hues represent stronger associations and vice versa. For each pair of variables, we calculated rank-based correlation coefficients using Spearman’s rho (r). The significance of the correlation is indicated by the p-value. All associations were positive, although none significantly so. (C) Mean total number of eggs per bundle (± s.e.m.) and mean total number of sperm per bundle (± s.e.m.) significantly differed across genets (statistics in text).
Correlations between each pair of variables including mean colony size, mean total number of eggs per bundle and mean total number of sperm per bundle, were positive but not significantly so (Figure 4B). Nonetheless, the general pattern is that larger colonies had more eggs and sperm within gamete bundles. However, when visualizing the mean number of eggs and sperm per bundle by genet, differences do appear (Figure 4C). The total number of eggs per bundle significantly differed across genets (Kruskal-Wallis: X2 = 124.57, d.f. = 8, p-value< 0.0001) with colonies of genet 31L being the least fecund, followed by genets 47 and then 13. The total number of sperm per bundle also significantly differed across genets (Kruskal-Wallis: X2 = 124.2, d.f. = 8, p-value< 0.0001) with colonies of genet 31L being the least fecund, followed by genets 7 and then 34. Genet 3 was mid-range for egg fecundity but amongst those that had the highest level of sperm fecundity. Genet 7 was amongst those with the highest level of egg fecundity but lowest level of sperm fecundity. Genet 50 had among the highest values for both traits, which could be expected based on the larger parental colony size.
4 Discussion
The purpose of this study was to compare the reproductive output of a number of A. cervicornis genets -previously identified as either white-band disease resistant or susceptible- in order to better understand the relationship between traits used for determining which genets should be prioritized for production and used within managed breeding programs for actively restoring Florida’s Coral Reef. To promote the survival and adaptive potential of restored coral populations, many factors need to be considered when breeding and outplanting corals, including the potential for trade-offs between key traits (e.g., growth, calcification, thermotolerance, disease resistance, and reproductive output) (Baums et al., 2019; Koch, 2021b). However, the mechanism(s) underlying disease resistance remain poorly understood in corals and the potential costs of being disease resistant on reproductive output have been explored in only one other study, to the best of our knowledge. Shore-Maggio et al. (2018) found that a disease-resistant morph of the Hawaiian reef coral, Montipora capitata, had a significantly higher growth rate than a disease-susceptible morph, and that the former’s investment in growth and disease resistance did not come at a cost to establishing lipid reserves or reproductive output. The authors speculated that this could be linked to the presence of a ‘high-performance’ clade of algal endosymbiont (Cladocopium) in the disease-resistant morph (Shore-Maggio et al., 2018). We know however that the genets tested herein have historically been dominated by the same algal symbiont, Symbiodinium ‘fitti’. Muller et al. (2018) determined that no other Symbiodiniaceae clades have been detected in A. cervicornis corals in Mote’s in-situ nursery above background levels (Parkinson et al., 2018) or in other offshore colonies of the same species in the Florida Keys (Baums et al., 2010). Furthermore, the majority of the host genets tested in their study (11/15) harbored a single S. fitti strain consistently through time (strain F421), while the other four S. fitti strains were associated with a single coral genet each (see Muller et al., 2018). In fact, disease resistant genets 3 and 7 harbored F421, as did disease susceptible genets 13, 41, 44, and 47, while genets 1 and 50 harbored F419 and F423, respectively (Muller et al., 2018). For these reasons, there are no predicted differences in the clade of algal symbiont hosted by disease resistant versus susceptible genets tested within this study.
Herein, we hypothesized that if there is a cost of being disease resistant on reproductive output, then disease resistant genets would produce fewer and/or smaller eggs compared to disease susceptible ones, while taking into consideration the prediction that colony size may positively correlate with fecundity. Taken together, our results suggest that colony size, and therefore energy availability, played a large role in influencing reproductive output with regards to polyp fecundity while oocyte size was negatively influenced by disease susceptibility. Nonetheless, one genet in particular (3) emerged as being especially fit compared to the others, even though it did not have the largest median colony size. Genet 3, which appears highly disease resistant under non-bleaching and bleaching conditions (Muller et al., 2018), also produced the largest eggs, on average, and was among those with the highest values for mean polyp fecundity and total colony fecundity, making it a clear frontrunner as a candidate for restoration (i.e., asexual and sexual propagation followed by outplanting).
4.1 Colony size and genet have significant effects on polyp fecundity
Consistent with previous studies, we found an overall positive correlation between colony size and fecundity (i.e., number of oocytes within polyps) (Figure 2B) (Rinkevich and Loya, 1979; Kojis and Quinn, 1981; Brazeau and Lasker, 1990; Harrison and Wallace, 1990; Babcock, 1991; Hall and Hughes, 1996; Tanner, 1997; Sakai, 1998a; Sakai, 1998b; Beiring and Lasker, 2000; Okubo et al., 2007; Nozawa and Lin, 2014; Foster and Gilmour, 2020). This positive relationship is hypothesized to be the result of a proportional shift of energy investment from growth to reproduction with increasing colony size (Hall and Hughes, 1996). This has been supported by findings of decreasing growth with increasing colony size (Johnson, 1992; Sakai, 1998b; Beiring and Lasker, 2000; Chadwick-Furman et al., 2000; van Woesik et al., 2011), and the accumulation of an energetic surplus in larger individuals (Elahi and Edmunds, 2007), indicating that larger individuals have more energy to allocate towards reproduction. Within the present study, we would have therefore expected -based on colony size alone- that genets with the largest median colony sizes (i.e., genets 31 and 50) would be the most fecund. While genet 31 indeed had among the highest values for mean polyp fecundity, genet 50 was only mid-range, suggesting other factor(s) are influencing this trait (Figs. 1A; 3A). Similarly, we would have expected genets with the smallest median colony size (i.e., 34 and 41) to be the least fecund, and indeed we found that to be the case for genet 34, while genet 41 contained no oocytes at all despite colonies being above the minimum predicted puberty size for this species (Figs. 1A; 3A), which again indicates that genets may differ in how they allocate resources to these traits. These findings were confirmed by our regression analysis which showed that polyp fecundity depended on genet and colony size, with genet 34 being significantly less fecund. Not significantly different than genet 31, genets 62 and 3, had the next highest mean values for polyp fecundity, which could be in part due to their somewhat larger colony sizes (see Figure 1A).
4.2 Positive association between polyp fecundity and oocyte size
We also found evidence for a positive relationship between the number and size of oocytes produced (Figure 2H), which is inconsistent with previous predictions but consistent with a more recent study investigating these traits for Pacific acroporids (Foster and Gilmour, 2020). Oogenesis -the production of eggs- requires energy to be allocated towards both the number and size of eggs created. As such, it has been hypothesized that a trade-off between these two traits may occur where corals will either produce fewer larger eggs or more smaller eggs (Harriott, 1983; Richmond, 1987; Stearns, 1992; Hall and Hughes, 1996). Earlier studies found evidence for this pattern [e.g., (Wallace, 1985; Stearns, 1992; Harriott, 1993)], but they focused primarily on between -not within- species comparisons, as was done here. A more recent investigation into the relationship between egg size and polyp fecundity found that within six of the seven Acropora species they tested, there was not a negative correlation, suggesting that energetically constrained trade-offs may not always occur between these two traits (Foster and Gilmour, 2020).
Interestingly, genet 3 had significantly larger eggs than any other genet (Figure 3A), and despite not having the largest median colony size, it still had an elevated value for mean polyp fecundity suggesting genet 3 has several fitness advantages. Larger eggs are fertilized at a greater rate, which is predicted to be a consequence of being a larger target for sperm (Levitan, 1993; Foster and Gilmour, 2020). Furthermore, larger eggs have more stored lipids (Jones and Berkelmans, 2011), which are critical for larval survival because larvae and early recruits of most broadcast spawning scleractinians are aposymbiotic. Until they acquire their algal endosymbionts, which provide more than 90% of the coral’s nutritional requirements (Muscatine et al., 1981; Falkowski et al., 1984), the larvae must rely on the lipid stores provided by the parent. Larger lipid stores translate into larger energy reserves which can extend the larval duration period (and therefore dispersal potential), as well as lead to increased post-settlement survival (Richmond, 1987; Harii et al., 2010; Foster and Gilmour, 2020). Finally, having higher fecundity (i.e., producing more eggs) increases one’s chances of passing on their genes to the next generation. Genet 7, the other disease resistant genet, had mid-range values for these traits, including colony size, so it did not appear to be any more or less fit than the other genets in general.
4.3 Negative association between oocyte size and disease susceptibility
Interestingly, we found evidence for a negative association between oocyte size and disease susceptibility suggesting that more susceptible genets produced smaller eggs (Figure 2J). Our regression analysis revealed similar results where oocyte size significantly varied across genets and was negatively associated with disease susceptibility, with genet 47 having the smallest eggs (Figure 3A). However, we suggest that further investigation into this relationship is needed, including a sample size larger than two disease resistant genets. For example, a recently published study has identified eight additional Florida Keys genets that have a microbiome profile similar to that of the disease resistant genets used herein (i.e., 3 and 7) (Williams et al., 2022), and which represent candidates for extensions of this work to further evaluate this relationship. Microbiomes can influence host stress responses and a link between disease phenotype and coral host microbiome was revealed in a study that characterized the microbiomes associated with different A. cervicornis genets previously identified as disease resistant or susceptible (Muller et al., 2018), and which are the same genets used herein. The authors found that microbiomes of disease susceptible genets (i.e., 1, 13, 41, 44, 47, and 50) had an overwhelming dominance of the bacterial species Candidatus Aquarickettsia rohweri, while disease resistant genets (i.e., 3 and 7) were characterized by a more even and diverse microbiome, and with low abundances of Ca. Aquarickettsia (Klinges et al., 2020; Klinges et al., 2022). Ca. Aquarickettsia is an obligate, intracellular bacteria shown to possess the genomic capacity to parasitize the coral holobiont for amino acids and ATP, thereby reducing overall coral health and/or growth (Klinges et al., 2019). It is therefore hypothesized that the mechanism by which Ca. Aquarickettsia may influence disease susceptibility is through the overconsumption of host and symbiont nutritional and energy resources (Klinges et al., 2019) and can thus be used as a marker of disease susceptibility in A. cervicornis (Klinges et al., 2020). A potential explanation then for the negative association between oocyte size and disease susceptibility found herein could be that genets with an increased abundance of these parasitic bacteria (i.e., disease susceptible genets) have reduced energy reserves, which may limit allocation to oogenesis and result in smaller eggs. Smaller eggs have fewer lipid stores which can limit dispersal potential and survival. This idea merits further exploration but could indicate that there is actually a cost of being disease susceptible on reproductive output and that coral host microbiomes influence reproductive output as well.
4.4 Total colony fecundity
There were no significant differences in total colony fecundity across genets, which was estimated from all measured traits. This is attributed to the high variability within and among traits across genets. Nonetheless, genets 31 and 3 had among the highest values, which is not surprising for genet 31 given its large median colony size and increased polyp fecundity. Based on these data, it could appear that genet 31, despite being disease susceptible, is still a strong candidate for restoration (e.g., asexual propagation and managed breeding) because it is a fast grower and more fecund. While differences in parent colony sizes herein are partially attributed to differences in inherent growth rates, initial colony sizes of the fragments used to start the spawning nursery were somewhat different and ranged between 15 and 30 cm in diameter. Nonetheless, and anecdotally, we know that genet 31 is a ‘fast-grower’ based on years of propagating it in Mote’s in-situ asexual propagation nursery and managing it in the spawning nurseries.
Additionally, after multiple years and repeated (as well as replicated) attempts to cross (under standardized conditions) dams (i.e., mothers/egg donors) of genet 31 with sires (i.e., fathers/sperm donors) of genets listed herein (i.e., genets 3, 7, and 50), all crosses had abnormally high levels of larval mortality and either zero or near-zero settlement and post-settlement survival rates (Koch, unpublished data). Conversely, reciprocals of all crosses had normal levels of settlement and successfully produced sexual recruits. We also observed morphological and behavioral abnormalities in larvae from all crosses with dams of genet 31. We are researching possible explanations for these observations, but our preliminary evidence highlights the need to test other factors related to reproductive output and success such as genetics (e.g., zygotic genome activation), gamete morphology/compatibility, energetics (e.g., protein and lipid content of eggs), gamete quality (e.g., sperm motility), or other phenomena such as cytoplasmic-nuclear incompatibility. However, a logical next step in this investigation would be to carry out known successful (e.g., 31sire x 3dam) and unsuccessful (e.g., 31dam x 3sire) crosses and track embryogenesis and larval development with high temporal resolution to determine where in the post-fertilization process development breaks down. Finally, the relationship between polyp fecundity and oocyte size can change in response to stress (Jones and Berkelmans, 2011; Foster and Gilmour, 2020), underlining the need to conduct tests of these traits and their interactions under both control and stressful (e.g., prevailing in-situ) conditions.
4.5. Gamete bundle fecundity
As a secondary assessment of fecundity, we quantified the total number of eggs and sperm within replicate spawned gamete bundles for each genet and found similar trends as in the fragment fecundity analysis with respect to colony size and fecundity. Because replicate colonies of each genet were held together during spawning, and gamete bundles were randomly collected from the surface, we do not know from which colony or polyp each gamete bundle originated. This led estimates to be based on the genet level, as opposed to colony level, which reduced our replication power. However, we were still able to infer the nature of the associations between colony size, and number of eggs and sperm, which were all positive (Figure 4B) and consistent with the expectation that increased colony size leads to an increase in the energy available for oogenesis and spermatogenesis.
There was high variability in colony size within and among genets, which is attributed with the finding that there were no significant differences in median colony size across genets. However, genets 50 and 62 had among the highest values for median colony size while genet 7 had among the smallest. These differences are likely contributing to the observed differences in gamete bundle fecundity where genets 50 and 62 had among the highest number of eggs and sperm per bundle. Also with increased sperm counts were genets 13 and 3, which again highlights the fitness of genet 3. Genet 7 had among the most eggs but least sperm per bundle, relative to the other genets (Figure 4C). This result could be driven by the overall small size of the colonies (Figure 4A), but also by the fact that oogenesis begins months before spermatogenesis (Szmant, 1986; Harrison and Wallace, 1990), and in some acroporids 6-10 months beforehand (Wijayanti et al., 2019). It is thus possible the reduced energetic reserves associated with the smaller colony size were initially allocated more towards oogenesis than spermatogenesis, but this idea requires testing. Furthermore, polyp position has been shown to have an effect on fecundity in some species (Nozawa and Lin, 2014), so we cannot discount the potential contribution of this factor to our findings, but since gamete bundles were randomly collected at the water’s surface, further research is necessary to understand whether or not a similar pattern can be found in this species.
There was a noticeable difference in measures of genet 31 between the two nurseries. As previously mentioned, the entire tree of genet 31 at the Sand Key nursery disappeared after a strong storm that occurred between sampling for fragment fecundity analysis and spawning. Thus, replicate colonies of genet 31 (identified as 31L) were brought in from a different nursery location, Mote’s Looe Key nursery, which is approximately 30 miles east northeast of the Sand Key nursery location. Despite the Looe Key nursery colonies being overall smaller, there was no significant difference in mean colony size between the two sub-populations (t-test: t = -1.91, d.f. = 7, p-value = 0.113). However, genet 31L had significantly fewer eggs per bundle than all other genets, as well as significantly fewer sperm per bundle (except when compared to genets 7 and 34) (Figure 4C). Possible explanations include differences in environmental conditions between the two nursery sites that influence colony growth. Reduced nutrient availability, water quality, and light levels (i.e., increased turbidity) could restrict growth and limit overall energy available for gametogenesis (Kojis and Quinn, 1985; Harrison and Wallace, 1990). These findings suggest that the traits studied herein should be evaluated across the range of reef habitats and nursery locations that these genets exist in, in order to better project future reproductive success of restored populations composed of these genets, as well as the relative fitness of these genets under optimal versus stressful conditions, including recent and/or active disease infection.
In conclusion, these data are relevant for population management interventions and for managing broodstock used for active restoration where a suite of corals with different genotypes and phenotypes are continuously propagated and outplanted. Having a more comprehensive understanding of the fitness differences among candidates can help guide such efforts and ensure that a diversity of fit genets is used for restoration, which should ultimately support greater adaptive potential and population resilience.
Data availability statement
The datasets presented in this study can be found in online repositories. The names of the repository/repositories and accession number(s) can be found below: The following datasets generated and analyzed for this study, along with their accompanying metadata files, can be found in the Biological and Chemical Oceanography Data Management Office (BCO-DMO): Colony Size and Morphometrics (DOI: 10.26008/1912/bco-dmo.843028.1); Oocyte Number (DOI: 10.26008/1912/bco-dmo.867314.1); Oocyte Size (DOI: 10.26008/1912/bco-dmo.843067.1); Gamete Bundles (DOI: 10.26008/1912/bco-dmo.868493.1); Polyps per area (10.26008/1912/bco-dmo.868308.1). The citations for the datasets are as follows (Koch et al., 2022a; Koch et al., 2022b; Koch et al., 2022c; Koch et al., 2022d; Koch et al., 2022e).
Author contributions
HK and EM conceived and designed the study. HK and EB set up and maintained the coral spawning nursery. EB led fieldwork operatios and in-situ sample collections. HK and YA collected samples, analyzed samples, collected data, and analyzed the results. HK wrote the manuscript. EM, YA and EB reviewed the manuscript. All authors contributed to the article and approved the submitted version.
Funding
This work was carried out with funding support to EM via an NSF CAREER grant (Division of Ocean Sciences, #OCE-1452538), to HK via a German Research Foundation (Deutsche Forschungsgemeinschaft) Postdoctoral Fellowship (#394448490) followed by a Mote Postdoctoral Research Fellowship, and to YA via a Mote Research Experience for Undergraduates (REU) internship.
Acknowledgments
This work was supported through Florida Keys National Marine Sanctuary Permits (FKNMS-2018-088-A2; FKNMS-2015-163-A3). We would like to thank Lydia Wasmer, Sydney Bell, Ellyse Anderson, Kenaro Malcom, and Jake Clement for assisting with data collection. We would also like to thank Cory Walter, Joe Kuehl, and Samantha Sampson for fieldwork assistance.
Conflict of interest
The authors declare that the research was conducted in the absence of any commercial or financial relationships that could be construed as a potential conflict of interest.
Publisher’s note
All claims expressed in this article are solely those of the authors and do not necessarily represent those of their affiliated organizations, or those of the publisher, the editors and the reviewers. Any product that may be evaluated in this article, or claim that may be made by its manufacturer, is not guaranteed or endorsed by the publisher.
References
Acropora Biological Review Team (2005). “Atlantic Acropora status review,” in Report to national marine fisheries service. (Southeast Regional Office), 152.
Alvarez-Noriega M., Baird A. H., Dornelas M., Madin J. S., Cumbo V. R., Connolly S. R. (2016). Fecundity and the demographic strategies of coral morphologies. Ecology 97, 3485–3493. doi: 10.1002/ecy.1588
Aronson R. B., Precht W. F. (2001). White-band disease and the changing face of Caribbean coral reefs. Hydrobiologia 460, 25–38. doi: 10.1023/A:1013103928980
Babcock R. C. (1991). Comparative demography of 3 species of scleractinian corals using age-dependent and size-dependent classifications. Ecol. Monogr. 61, 225–244. doi: 10.2307/2937107
Baums I. B., Baker A. C., Davies S. W., Grottoli A. G., Kenkel C. D., Kitchen S. A., et al. (2019). Considerations for maximizing the adaptive potential of restored coral populations in the western Atlantic. Ecol. Appl. 29, e01978. doi: 10.1002/eap.1978
Baums I. B., Johnson M. E., Devlin-Durante M. K., Miller M. W. (2010). Host population genetic structure and zooxanthellae diversity of two reef-building coral species along the Florida reef tract and wider Caribbean. Coral Reefs 29, 835–842. doi: 10.1007/s00338-010-0645-y
Beiring E. A., Lasker H. R. (2000). Egg production by colonies of a gorgonian coral. Mar. Ecol. Prog. Ser. 196, 169–177. doi: 10.3354/meps196169
Borger J. L., Colley S. (2010). The effects of a coral disease on the reproductive output of Montastraea faveolata (Scleractinia: Faviidae). Rev. Biol. Trop. 58, 99–110. doi: 10.3390/microorganisms9112181
Boström-Einarsson L., Babcock R. C., Bayraktarov E., Ceccarelli D., Cook N., Ferse S. C. A., et al. (2020). Coral restoration – a systematic review of current methods, successes, failures and future directions. PloS One 15, e0226631. doi: 10.1371/journal.pone.0226631
Brazeau D. A., Lasker H. R. (1990). Sexual reproduction and external brooding by the Caribbean gorgonian Briareum asbestinum. Mar. Biol. 104, 465–474. doi: 10.1007/BF01314351
Calle-Trivino J., Cortes-Useche C., Sellares-Blasco R. I., Arias-Gonzalez J. E. (2018). Assisted fertilization of threatened staghorn coral to complement the restoration of nurseries in southeastern Dominican republic. Reg. Stud. Mar. Sci. 18, 129–134. doi: 10.1016/j.rsma.2018.02.002
Caruso C., Hughes K., Drury C. (2021). Selecting heat-tolerant corals for proactive reef restoration. Front. Mar. Sci. 8. doi: 10.3389/fmars.2021.632027
Chadwick-Furman N. E., Goffredo S., Loya Y. (2000). Growth and population dynamic model of the reef coral Fungia granulosa klunzinger 1879 at eilat, northern red Sea. J. Exp. Mar. Biol. Ecol. 249, 199–218. doi: 10.1016/S0022-0981(00)00204-5
Clark A. S., Williams S. D., Maxwell K., Rosales S. M., Huebner L. K., Landsberg J. H., et al. (2021). Characterization of the microbiome of corals with stony coral tissue loss disease along florida’s coral reef. Microorganisms 9, 2181.
Drury C., Dale K. E., Panlilio J. M., Miller S. V., Lirman D., Larson E. A., et al. (2016). Genomic variation among populations of threatened coral: Acropora cervicornis. BMC Genomics 17, 286. doi: 10.1186/s12864-016-2583-8
Elahi R., Edmunds P. J. (2007). Determinate growth and the scaling of photosynthetic energy intake in the solitary coral Fungia concinna (Verrill). J. Exp. Mar. Biol. Ecol. 349, 183–193. doi: 10.1016/j.jembe.2007.05.007
Enochs I. C., Manzello D. P., Carlton R., Schopmeyer S., van Hooidonk R., Lirman D. (2014). Effects of light and elevated pCO(2) on the growth and photochemical efficiency of Acropora cervicornis. Coral Reefs 33, 477–485. doi: 10.1007/s00338-014-1132-7
Falkowski P. G., Dubinsky Z., Muscatine L., Porter J. W. (1984). Light and the bioenergetics of a symbiotic coral. Bioscience 34, 705–709. doi: 10.2307/1309663
Forsman Z. H., Page C. A., Toonen R. J., Vaughan D. (2015). Growing coral larger and faster: Micro-colony-fusion as a strategy for accelerating coral cover. Peerj 3, e1313. doi: 10.7717/peerj.1313
Foster T., Gilmour J. (2020). Egg size and fecundity of biannually spawning corals at Scott reef. Sci. Rep-Uk 10, 12313. doi: 10.1038/s41598-020-68289-4
Gignoux-Wolfsohn S. A., Marks C. J., Vollmer S. V. (2012). White band disease transmission in the threatened coral, Acropora cervicornis. Sci. Rep-Uk 2, 804. doi: 10.1038/srep00804
Goergen E. A., Moulding A. L., Walker B. K., Gilliam D. S. (2019). Identifying causes of temporal changes in Acropora cervicornis populations and the potential for recovery. Front. Mar. Sci. 6. doi: 10.3389/fmars.2019.00036
Graham J. E., van Woesik R. (2013). The effects of partial mortality on the fecundity of three common Caribbean corals. Mar. Biol. 160, 2561–2565. doi: 10.1007/s00227-013-2248-y
Hall E. R., DeGroot B. C., Fine M. (2015). Lesion recovery of two scleractinian corals under low pH conditions: Implications for restoration efforts. Mar. Pollut. Bull. 100, 321–326. doi: 10.1016/j.marpolbul.2015.08.030
Hall V. R., Hughes T. P. (1996). Reproductive strategies of modular organisms: Comparative studies of reef-building corals. Ecology 77, 950–963. doi: 10.2307/2265514
Harii S., Yamamoto M., Hoegh-Guldberg O. (2010). The relative contribution of dinoflagellate photosynthesis and stored lipids to the survivorship of symbiotic larvae of the reef-building corals. Mar. Biol. 157, 1215–1224. doi: 10.1007/s00227-010-1401-0
Harriott V. J. (1983). Reproductive seasonality, settlement, and post-settlement mortality of Pocillopora damicornis (Linnaeus), at lizard island, great barrier reef. Coral Reefs 2, 151–157. doi: 10.1007/BF00336721
Harriott V. J. (1993). Coral lipids and environmental stress. Environ. Monit Assess. 25, 131–139. doi: 10.1007/BF00549134
Harrison P. L., Wallace C. C. (1990). Reproduction, dispersal and recruitment of scleractinian corals (Amsterdam, The Netherlands: Elsevier).
Hemond E. M., Vollmer S. V. (2010). Genetic diversity and connectivity in the threatened staghorn coral (Acropora cervicornis) in Florida. PloS One 5, e8652. doi: 10.1371/journal.pone.0008652
Hoegh-Guldberg O. (1999). Climate change, coral bleaching and the future of the world’s coral reefs. Mar. Freshw. Res. 50, 839–866. doi: 10.1071/Mf99078
Hoegh-Guldberg O., Pendelton L., Kaup A. (2019). People and the changing nature of coral reefs. Reg. Stud. Mar. Sci. 30, 100699. doi: 10.1016/j.rsma.2019.100699
Hughes T. P. (1994). Catastrophes, phase-shifts, and large-scale degradation of a caribbean coral-reef. Science 265, 1547–1551. doi: 10.1126/science.265.5178.1547
Hughes T. P., Anderson K. D., Connolly S. R., Heron S. F., Kerry J. T., Lough J. M., et al. (2018). Spatial and temporal patterns of mass bleaching of corals in the anthropocene. Science 359, 80–84. doi: 10.1126/science.aan8048
Hughes T. P., Baird A. H., Bellwood D. R., Card M., Connolly S. R., Folke C., et al. (2003). Climate change, human impacts, and the resilience of coral reefs. Science 301, 929–933. doi: 10.1126/science.1085046
Hughes T. P., Kerry J. T., Alvarez-Noriega M., Alvarez-Romero J. G., Anderson K. D., Baird A. H., et al. (2017). Global warming and recurrent mass bleaching of corals. Nature 543, 373–378. doi: 10.1038/nature21707
Hughes T. P., Tanner J. E. (2000). Recruitment failure, life histories, and long-term decline of Caribbean corals. Ecology 81, 2250–2263. doi: 10.1890/0012-9658(2000)081[2250:RFLHAL]2.0.CO;2
Huntington B. E., Miller M. W. (2014). Location-specific metrics for rapidly estimating the abundance and condition of the threatened coral Acropora cervicornis. Restor. Ecol. 22, 299–303. doi: 10.1111/rec.12057
Johnson K. G. (1992). Population dynamics of a free-living coral: Recruitment, growth and survivorship of Manicina areolata (Linnaeus) on the Caribbean coast of Panama. J. Exp. Mar. Biol. Ecol. 164, 171–191. doi: 10.1016/0022-0981(92)90173-8
Jones A. M., Berkelmans R. (2011). Tradeoffs to thermal acclimation: Energetics and reproduction of a reef coral with heat tolerant Symbiodinium type-d. J. Mar. Biol 2011(185890), 12. doi: 10.1155/2011/185890
Kiel C., Huntington B., Miller M. (2012). Tractable field metrics for restoration and recovery monitoring of staghorn coral Acropora cervicornis. Endanger Species Res. 19, 171–176. doi: 10.3354/esr00474
Klepac C. N., Beal J., Kenkel C. D., Sproles A., Polinski J. M., Williams M. A., et al. (2015). Seasonal stability of coral-symbiodinium associations in the subtropical coral habitat of st. lucie reef, Florida. Mar. Ecol. Prog. Ser. 532, 137–151. doi: 10.3354/meps11369
Klinges G., Maher R. L., Vega Thurber R. L., Muller E. M. (2020). Parasitic ‘Candidatus aquarickettsia rohweri’ is a marker of disease susceptibility in Acropora cervicornis but is lost during thermal stress. Environ. Microbiol. 22, 5341–5355. doi: 10.1111/1462-2920.15245
Klinges J. G., Patel S. H., Duke W. C., Muller E. M., Vega Thurber R. L. (2022). Phosphate enrichment induces increased dominance of the parasite aquarickettsia in the coral Acropora cervicornis. FEMS Microbiol. Ecol. 98, fiac013. doi: 10.1093/femsec/fiac013
Klinges J. G., Rosales S. M., McMinds R., Klinges J. G., Rosales S. M., McMinds R., et al. (2019). Phylogenetic, genomic, and biogeographic characterization of a novel and ubiquitous marine invertebrate-associated rickettsiales parasite, candidatus aquarickettsia rohweri, gen. nov., sp. nov. Isme J. 13, 2938–2953. doi: 10.1038/s41396-019-0482-0
Koch H. R. (2021a). “Chapter 9: Assisted evolution and coral reef resilience,” in Active coral reef restoration: Techniques for a changing planet. Ed. Vaughan D. (J. Ross Publishing).
Koch H. R. (2021b). “Chapter 10: Genetic considerations for coral reef restoration,” in Active coral reef restoration: Techniques for a changing planet. Ed. Vaughan D. (J. Ross Publishing).
Koch H., Azu Y., Bartels E., Muller E. (2022a). Colony sizes and morphometric assessments of acropora cervicornis genotypes sampled July 2020 for fecundity analysis at mote marine laboratory. Ed. Koch H. (Biological and Chemical Oceanography Data Management Office (BCO-DMO). doi: 10.26008/1912/bco-dmo.843028.1
Koch H., Azu Y., Bartels E., Muller E. (2022b). Fecundity and number of oocytes from acropora cervicornis genotypes measured July 2020 at mote marine Lab. Ed. Koch H. (Biological and Chemical Oceanography Data Management Office (BCO-DMO). doi: 10.26008/1912/bco-dmo.867314.1
Koch H., Azu Y., Bartels E., Muller E. (2022c). Fecundity and oocyte sizes of acropora cervicornis genotypes measured July 2020 at mote marine Lab. Ed. Koch H. (Biological and Chemical Oceanography Data Management Office (BCO-DMO). doi: 10.26008/1912/bco-dmo.843067.1
Koch H., Azu Y., Bartels E., Muller E. (2022d). Fecundity assessment of acropora cervicornis colonies from spawning observations and gamete bundle analysis in august 2020 at mote marine laboratory. Ed. Koch H. (Biological and Chemical Oceanography Data Management Office (BCO-DMO). doi: 10.26008/1912/bco-dmo.868493.1
Koch H., Muller E., Azu Y., Bartels E. (2022e). Assessment of polyps per area of acropora cervicornis genotypes sampled July 2020 for fecundity analysis at mote marine laboratory. Ed. Koch H. (Biological and Chemical Oceanography Data Management Office (BCO-DMO). doi: 10.26008/1912/bco-dmo.868308.1
Koch H. R., Muller E., Crosby M. P. (2021a). Reef restoration on hyperdrive: Novel technologies establish a new paradigm for global coral reef restoration, with in situ spawning of mature, environmentally resilient corals in five years instead of decades. Scientist 35, 24–31.
Koch H. R., Wallace B., DeMerlis A., Clark A., Nowicki R. J. (2021b). 3D scanning as a tool to measure growth rates of live coral microfragments used for coral reef restoration. Front. Mar. Sci 8. doi: 10.3389/fmars.2021.623645
Kojis B. L., Quinn N. J. (1981). Aspects of sexual reproduction and larval development in the shallow-water hermatypic coral, Goniastrea-australensis (Edwards and Haime 1857). B Mar. Sci. 31, 558–573.
Kojis B. L., Quinn N. J. (1985). Coral fecundity as a biological indicator of reef stress. Am. Zool 23, 961–961.
Levitan D. R. (1993). The importance of sperm limitation to the evolution of egg size in marine invertebrates. Am. Nat. 141, 517–536. doi: 10.1086/285489
Levitan D. R., Fukami H., Jara J., Kline D., McGovern T. M., McGhee K. E., et al. (2004). Mechanisms of reproductive isolation among sympatric broadcast-spawning corals of the Montastraea annularis species complex. Evolution 58, 308–323. doi: 10.1111/j.0014-3820.2004.tb01647.x
Lirman D., Thyberg T., Herlan J., Hill C., Young-Lahiff C., Schopmeyer S., et al. (2010). Propagation of the threatened staghorn coral Acropora cervicornis: Methods to minimize the impacts of fragment collection and maximize production. Coral Reefs 29, 729–735. doi: 10.1007/s00338-010-0621-6
Merck D. E., Petrik C. G., Manfroy A. A., Muller E. M. (2022). Optimizing seawater temperature conditions to increase the productivity of ex situ coral nurseries. Peerj, e13017. doi: 10.7717/peerj.13017
Miller M. W., Lohr K. E., Cameron C. M., Williams D. E., Peters E. C. (2014). Disease dynamics and potential mitigation among restored and wild staghorn coral, Acropora cervicornis. Peer J 2, e541. doi: 10.7717/peerj.541
Miller M. W., Baums I. B., Pausch R. E., Bright A. J., Cameron C. M., Williams D. E., et al. (2018). Clonal structure and variable fertilization success in Florida keys broadcast-spawning corals. Coral Reefs 37, 239–249. doi: 10.1007/s00338-017-1651-0
Muller E. M., Bartels E., Baums I. B. (2018). Bleaching causes loss of disease resistance within the threatened coral species Acropora cervicornis. Elife 7, e35066. doi: 10.7554/eLife.35066.028
Muscatine L., Mccloskey L. R., Marian R. E. (1981). Estimating the daily contribution of carbon from zooxanthellae to coral animal respiration. Limnol Oceanogr 26, 601–611. doi: 10.4319/lo.1981.26.4.0601
NMFS (2015). Recovery plan for elkhorn (Acropora palmata) and staghorn (A. cervicornis) corals Vol. p (Silver Spring, Maryland: National Marine Fisheries Service Silver Spring, MD), 167.
Nozawa Y., Lin C. H. (2014). Effects of colony size and polyp position on polyp fecundity in the scleractinian coral genus Acropora. Coral Reefs 33, 1057–1066. doi: 10.1007/s00338-014-1185-7
Okubo N., Motokawa T., Omori M. (2007). When fragmented coral spawn? effect of size and timing on survivorship and fecundity of fragmentation in Acropora formosa. Mar. Biol. 151, 353–363. doi: 10.1007/s00227-006-0490-2
Page C. (2015). “Reskinning a reef: Mote marine Lab scientists explore a new approach to reef restoration,” in Coral magazine, 72–80.
Page H. N., Hewett C., Tompkins H., Hall E. R. (2021). Ocean acidification and direct interactions affect coral, macroalga, and sponge growth in the Florida keys. J. Mar. Sci. Eng. 9, 739. doi: 10.3390/jmse9070739
Page C. A., Muller E. M., Vaughan D. E. (2018). Microfragmenting for the successful restoration of slow growing massive corals. Ecol. Eng. 123, 86–94. doi: 10.1016/j.ecoleng.2018.08.017
Pandolfi J. M., Bradbury R. H., Sala E., Hughes T. P., Bjorndal K. A., Cooke R. G., et al. (2003). Global trajectories of the long-term decline of coral reef ecosystems. Science 301, 955–958. doi: 10.1126/science.1085706
Parkinson J. E., Bartels E., Devlin-Durante M. K., Lustic C., Nedimyer K., Schopmeyer S., et al. (2018). Extensive transcriptional variation poses a challenge to thermal stress biomarker development for endangered corals. Mol. Ecol. 27, 1103–1119. doi: 10.1111/mec.14517
Paxton C. W., Baria M. V. B., Weis V. M., Harii S. (2016). Effect of elevated temperature on fecundity and reproductive timing in the coral Acropora digitifera. Zygote 24, 511–516. doi: 10.1017/S0967199415000477
Pratchett M., Hoey A. S., Tan C. H., Kuo C. Y., Bauman A. G., Kumaraswamy R., et al. (2019). Spatial and temporal variation in fecundity of acropora spp. in the northern great barrier reef. Diversity 11, 60. doi: 10.3390/d11040060
Pratchett M. S., Hoey A. S., Wilson S. K. (2014). Reef degradation and the loss of critical ecosystem goods and services provided by coral reef fishes. Curr. Opin. Env. Sust 7, 37–43. doi: 10.1016/j.cosust.2013.11.022
Precht W. F., Bruckner A. W., Aronson R. B., Bruckner R. J. (2002). Endangered acroporid corals of the Caribbean. Coral Reefs 21, 41–42. doi: 10.1007/s00338-001-0209-2
Precht W. F., Gintert B. E., Robbart M. L., Fura R., van Woesik R. (2016). Unprecedented disease-related coral mortality in southeastern Florida. Sci. Rep-Uk 6, 31374. doi: 10.1038/srep31374
Randall C. J., Negri A. P., Quigley K. M., Foster T., Ricardo G. F., Webster N. S., et al. (2020). Sexual production of corals for reef restoration in the anthropocene. Mar. Ecol. Prog. Ser. 635, 203–232. doi: 10.3354/meps13206
Richmond R. H. (1987). Energetics, competency, and long-distance dispersal of planula larvae of the coral Pocillopora damicornis. Mar. Biol. 99, 527–533. doi: 10.1007/BF00392790
Rinkevich B. (1996). Do reproduction and regeneration in damaged corals compete for energy allocation? Mar. Ecol. Prog. Ser. 143, 297–302. doi: 10.3354/meps143297
Rinkevich B., Loya Y. (1979). Reproduction of the red-Sea coral stylophora-pistillata. 2. synchronization in breeding and seasonality of planulae shedding. Mar. Ecol. Prog. Ser. 1, 145–152. doi: 10.3354/meps001145
Robinson P. J., van Beukering P., Brander L., Brouwer R., Haider W., Taylor M., et al. (2022). Understanding the determinants of biodiversity non-use values in the context of climate change: Stated preferences for the Hawaiian coral reefs. Ecosystem Serv. 53, 100699. doi: 10.1016/j.ecoser.2021.101393
R Core Team (2020). R: A Language and Environment for Statistical Computing. (Vienna: R Foundation for Statistical Computing)
Sakai K. (1998a). Delayed maturation in the colonial coral Goniastrea aspera (Scleractinia): Whole-colony mortality, colony growth and polyp egg production. Res. Popul Ecol. 40, 287–292. doi: 10.2307/1543143
Sakai K. (1998b). Effect of colony size, polyp size, and budding mode on egg production in a colonial coral. Biol. Bull. 195, 319–325.
Schopmeyer S. A., Lirman D., Bartels E., Byrne J., Gilliam D. S., Hunt J., et al. (2012). In situ coral nurseries serve as genetic repositories for coral reef restoration after an extreme cold-water event. Restor. Ecol. 20, 696–703. doi: 10.1111/j.1526-100X.2011.00836.x
Schopmeyer S. A., Lirman D., Bartels E., Gilliam D. S., Goergen E. A., Griffin S. P., et al. (2017). Regional restoration benchmarks for Acropora cervicornis. Coral Reefs 36, 1047–1057. doi: 10.1007/s00338-017-1596-3
Shlesinger T., Loya Y. (2019). Breakdown in spawning synchrony: A silent threat to coral persistence. Science 365, 1002–1004. doi: 10.1126/science.aax0110
Shore-Maggio A., Callahan S. M., Aeby G. S. (2018). Trade-offs in disease and bleaching susceptibility among two color morphs of the Hawaiian reef coral, Montipora capitata. Coral Reefs 37, 507–517. doi: 10.1007/s00338-018-1675-0
Soong K. Y., Lang J. C. (1992). Reproductive integration in reef corals. Biol. Bull. 183, 418–431. doi: 10.2307/1542018
Spadaro A. J., Butler M. J. (2021). Herbivorous crabs reverse the seaweed dilemma on coral reefs. Curr. Biol. 31, 853–859. doi: 10.1016/j.cub.2020.10.097
Szmant A. M. (1986). Reproductive ecology of Caribbean reef corals. Coral Reefs 5, 43–53. doi: 10.1007/BF00302170
Tanner J. E. (1997). Interspecific competition reduces fitness in scleractinian corals. J. Exp. Mar. Biol. Ecol. 214, 19–34. doi: 10.1016/S0022-0981(97)00024-5
van Woesik R., Sakai K., Ganase A., Loya Y. (2011). Revisiting the winners and the losers a decade after coral bleaching. Mar. Ecol. Prog. Ser. 434, 67–76. doi: 10.3354/meps09203
van Woesik R., Scott W., R. A. (2014). Lost opportunities: Coral recruitment does not translate to reef recovery in the Florida keys. Mar. Pollut. Bull. 88, 110–117. doi: 10.1016/j.marpolbul.2014.09.017
Vargas-Angel B., Colley S. B., Hoke S. M., Thomas J. D. (2006). The reproductive seasonality and gametogenic cycle of Acropora cervicornis off broward county, Florida, USA. Coral Reefs 25, 110–122. doi: 10.1007/s00338-005-0070-9
Vollmer S. V., Kline D. I. (2008). Natural disease resistance in threatened staghorn corals. PloS One 3, e3718. doi: 10.1371/journal.pone.0003718
Wallace C. C. (1985). Reproduction, recruitment and fragmentation in 9 sympatric species of the coral genus acropora. Mar. Biol. 88, 217–233. doi: 10.1007/BF00392585
Ward S., Harrison P. (2000). Changes in gametogenesis and fecundity of acroporid corals that were exposed to elevated nitrogen and phosphorus during the ENCORE experiment. J. Exp. Mar. Biol. Ecol. 246, 179–221. doi: 10.1016/S0022-0981(99)00182-3
Wijayanti D. P., Indrayanti E., Wirasatriya A., Haryanto A., Haryanti D., Sembiring A., et al. (2019). Reproductive seasonality of coral assemblages in the karimunjawa archipelago, Indonesia. Front. Mar. Sci. 6. doi: 10.3389/fmars.2019.00195
Williams S. D., Klinges J. G., Zinman S., Clark A. S., Bartels E., Villoch Diaz Maurino M., et al. (2022). Geographically driven differences in microbiomes of Acropora cervicornis originating from different regions of florida’s coral reef. PeerJ 10, e13574. doi: 10.7717/peerj.13574
Williams D. E., Miller M. W., Kramer K. L. (2008). Recruitment failure in Florida keys Acropora palmata, a threatened Caribbean coral. Coral Reefs 27, 697–705. doi: 10.1007/s00338-008-0386-3
Williams D. E., Miller M. W. (2012). Attributing mortality among drivers of population decline in Acropora palmata in the Florida Keys (USA). Coral Reefs 31, 369–382. doi: 10.1007/s00338-011-0847-y
Keywords: conservation, coral restoration, coral reproduction, fecundity, disease resistance, trade-offs, AZA, Acropora
Citation: Koch HR, Azu Y, Bartels E and Muller EM (2022) No apparent cost of disease resistance on reproductive output in Acropora cervicornis genets used for active coral reef restoration in Florida. Front. Mar. Sci. 9:958500. doi: 10.3389/fmars.2022.958500
Received: 31 May 2022; Accepted: 14 September 2022;
Published: 03 October 2022.
Edited by:
Lorenzo Mari, Politecnico di Milano, ItalyReviewed by:
Masaya Morita, University of the Ryukyus, JapanRachel Michelle Wright, Smith College, United States
Copyright © 2022 Koch, Azu, Bartels and Muller. This is an open-access article distributed under the terms of the Creative Commons Attribution License (CC BY). The use, distribution or reproduction in other forums is permitted, provided the original author(s) and the copyright owner(s) are credited and that the original publication in this journal is cited, in accordance with accepted academic practice. No use, distribution or reproduction is permitted which does not comply with these terms.
*Correspondence: Hanna R. Koch, hkoch@mote.org