Characterizing COVID-19 Transmission: Incubation Period, Reproduction Rate, and Multiple-Generation Spreading
 Lin Zhang
 Jiahua Zhu2
  Xuyuan Wang
 Xiao Fan Liu
 Xiao-Ke Xu
- 1School of Science, Beijing University of Posts and Telecommunications, Beijing, China
- 2The First Hospital of Putian City, Putian, China
- 3Web Mining Laboratory, Department of Media and Communication, City University of Hong Kong, Hong Kong, China
- 4College of Information and Communication Engineering, Dalian Minzu University, Dalian, China
Understanding the transmission process is crucial for the prevention and mitigation of COVID-19 spread. This paper contributes to the COVID-19 knowledge by analyzing the incubation period, the transmission rate from close contact to infection, and the properties of multiple-generation transmission. The data regarding these parameters are extracted from a detailed line-list database of 9,120 cases reported in mainland China from January 15 to February 29, 2020. The incubation period of COVID-19 has a mean, median, and mode of 7.83, 7, and 5 days, and, in 12.5% of cases, more than 14 days. The number of close contacts for these cases during the incubation period and a few days before hospitalization follows a log-normal distribution, which may lead to super-spreading events. The disease transmission rate from close contact roughly decreases in line with the number of close contacts with median 0.13. The average secondary cases are 2.10, 1.35, and 2.2 for the first, second, and third generations conditioned on at least one offspring. However, the ratio of no further spread in the 2nd, 3rd, and 4th generations are 26.2, 93.9, and 90.7%, respectively. Moreover, the conditioned reproduction number in the second generation is geometrically distributed. Our findings suggest that, in order to effectively control the pandemic, prevention measures, such as social distancing, wearing masks, and isolating from close contacts, would be the most important and least costly measures.
1 Introduction
As of July 2020, the cumulative confirmed cases of COVID-19 worldwide have exceeded 17.4 million with over 572 thousand dead. There are 22 countries with more than 100,000 confirmed cases of as of July 14, 2020. The high transmissibility of the SARS-CoV-2 virus has substantially changed people’s hygiene habits, social relations, and forms of work and schooling during and after the pandemic [1]. In the absence of pharmaceutical intervention measures, public policies such as city lockdowns and workplace and school closures can mitigate the spread of disease, though with substantial economic and societal costs. The indecision regarding restarting the economy and stopping the pandemic has resulted in a wave of outbreaks in many countries [2].
Understanding the characteristics of the COVID-19 transmission process is crucial in finding a middle ground between restoring economic and societal order and controlling the pandemic. Previous research has shown that COVID-19 can be infectious pre-symptomatically [3], i.e., the virus is transmissive even without symptom onset. Finding out the incubation period’s duration and the virus reproducibility during the incubation period and shortly after symptom onset but before hospitalization is thus an urgent necessity [4].
Considering the incubation period, as of Jan. 26, the mean and median were 5 and 4.75 days (obtained by 125 patients) [5]. Confirmed cases reported from Jan. 4 to Feb. 24 showed a median incubation period of 5.1 days (obtained from 181 patients) [6]. By Jan. 22, using 425 patients, the mean incubation period was 5.2 days, and [7]. Reference [8] gave a shorter incubation period of 4.2 days, inferring that COVID-19 is more infectious than initially estimated. As of Mar. 31, the mean incubation time is estimated as 8.0 with a standard deviation of 4.75 [9]. Through a renewal process, the estimated median of the incubation period is 8.1 days, which is longer than other studies [10]. The mean and median of the incubation periods were 5.84 and 5.0 days via bootstrap for groups with an age of
The transmission rate is defined as the probability that an infection occurs among susceptible people within a specific group. It is an important index for providing an indication of how social interactions are related to transmission risk. Nine reports were listed in [13], showing a rate of 35% (95% CI 27–44), depending on infection caused by different contact methods.
One of the most important indices for infectious disease is the basic reproductive number. Numerous studies are devoted to its estimate. It is estimated to be 2.2 [14], which is higher than SARS-COV and MERS-CoV [15]. More estimates for the basic reproduction number are 4.7–6.6 [8], 2.24–3.58 [16], 3.77 (95% CI 3.51–4.05) [5], and 3.60 (3.49–3.84) [17]. The effective reproduction number is changing with time; it changed from 2.35 (1.15–4.77) to 1.05 (0.41–2.39) due to lockdown in Wuhan within 1 week [18].
The best-known model within infectious disease epidemiology is the SEIR (susceptible-exposed-infectious-recovered) model with different generalization. These models are utilized at the population level for the proportion of each state at given time, aiming to investigating the strategic decisions or effectiveness of the mitigation measures. For illustration, effective containment can explains the subexponential growth in China [19], and effects of containment measures in Italy are also analyzed by an SEIR-like model [17]. More results can be found [20–27].
Clinical investigations may suffer from a limited sample size and biased sampling from the population, leading to geometrical or demographic-dependent results. Different samples and different methods also lead to different results for data analysis and estimates. Simulation of disease spread and mitigation policies require a precise setting of incubation period [19, 28]. Metapopulation disease transmission models require a prerequisite setting of the transmission rate during social gathering events to predict disease spreading range [18, 29, 30]. For a better estimate of the reproduction number, a real data sample is a crucial ingredient. However, it is difficult to collect. Considering the demand of investigating the properties and modeling of COVID-19, fine data extracted from informative line-list records can provide supporting evidence for the existing results and solid foundation for further study.
In this work, we estimate the parameters of concern from a large scale epidemiological line-list database, which contains the contact history and epidemiological timelines of 9,120 confirmed COVID-19 cases in China [31]. The duration of the incubation period and the details of close contacts and contact scenarios are extracted from the line-list. Spreading trees are reconstructed from the potential transmission pairs in the line-list data set. Hidden in the line-list records of confirmed cases, we have collected 421 chains of spreading with a total confirmed cases number of 1,140. We fit proper distributions to the incubation period as well as scale of close contact. The reproducibility is presented by the spreading tree, which can be referred to as the effective reproduction number under strict containment measures in China.
The incubation distribution is fitted by Weibull distribution with a mean and median of 7.83 and 7 days, respectively; this is in agreement with [9]. Larger data size and longer observation period tend to result in larger incubation period, which is coincidence with the long tailed nature of Weibull distribution. For the secondary attack rate, there are much fewer results due to the lack of data. We have obtained 412 close contact events to investigate the transmission rate. It is revealed that the relationship between the contact scale and transmission rate is not strongly related no matter if it is a linear or nonlinear relation. Moreover, the contact scale is fitted by Lognormal distribution, and the empirical distribution of transmission rate is also given. Finally, the reproducibility of COVID-19 under strict containment measures is investigated by the multiple-generation spreading structure, revealing the effectiveness of the containment measures in China. The key contributions of our work are those that aim for a better understanding of the properties of COVID-19 spread.
The rest of the paper is organized as follows. Section 2 describes the data and methods. Section 3 reports the empirical analysis and models fitted. Section 4 discusses the implications of results and provides an explanation based on branching process and the necessity of ultra-strict prevention measures.
2 Data and Methods
The line-list database used in this paper contains hand-coded information extracted from 9,120 public reported cases by mainland China health commissions from January 15 to February 29, 2020. A typically reported item is as follows:
“Patient ID: Huainan-25.
The patient Huainan-25 is a 59-year-old woman who is the wife of the Huainan-26 patient. On February 12, she developed fever, muscle soreness, and other symptoms. On February 14, she went to the hospital for treatment and stayed at the hospital for observation. On February 15, her nucleic acid test was tested positive, and doctors diagnosed her as a suspected patient. Two days later, she was confirmed. Doctors have traced back 3 close contacts, all of whom have been quarantined for medical observation. During the New Year’s holiday, she had close contact with her daughter, son-in-law, and granddaughter. Her son-in-law, an asymptomatic patient with a history of suspicious exposure in Hefei, stayed at a designated hospital for observation. Doctors have traced back his 46 close contacts, all of whom have been quarantined for medical observation.”
The original extracted line-list database contains the epidemiology timelines, e.g., the possible date of virus exposure and date of symptom onset, for each case. We define the incubation period as the time between virus exposure and symptom onset. There are 457 cases with both dates of exposure and date of symptoms reported in the line-list database.
Close contact events are social events and scenarios such as living together, dining together, traveling together, and working together. There were 412 close contact events with the numbers of close contacts and secondary infections reported. Multiple-generation transmissions can form tree structures that originated from an initial infection. There are 421 transmission chains identified from the line-list.
3 Results
3.1 Duration of the Incubation Period
The incubation period is a vital variable considering the control of the pandemic. The quarantine period of close contact people with an infected individual depends on this variable. The quarantine was usually 14 days for COVID-19. However, for strict prevention, it was suggested at the Information Office of Beijing Municipality press conference on June 28 that after the first 14 days, another 14-day quarantine is necessary in some high-risk areas.
The reason why another 14 days quarantine is necessary can be found from the distribution of incubation time. The sample with 457 incubation time reveals that it is a skewed distribution, see Figure 1. The mean, median, and mode calculated from the sample data are 7.83, 7, and 5 days, respectively. Moreover, the empirical probability of incubation period exceeds 14 is
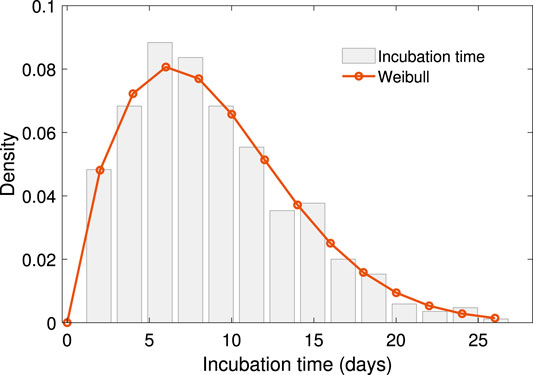
FIGURE 1. The empirical distribution and Weibull distribution fitting of incubation time. The Weibull distribution has density function
That is to say, the chance of an asymptomatic infected individual turning into symptomatic after 14 days is about 12.5%. For strict control of COVID-19, longer quarantine is necessary. A Weibull distribution is fitted to the empirical data, with shift 1 to the right for avoiding zero. The density function is
with
3.2 Scale of Close Contact Events
The scale of close contact events is the number of people involved in one event of where people have gathered together in a specific way. Table 1 shows the number of different types of social events and scenarios that can potentially facilitate disease spreading. Among the 412 close contact events, more than 93.7% happened by way of living together.
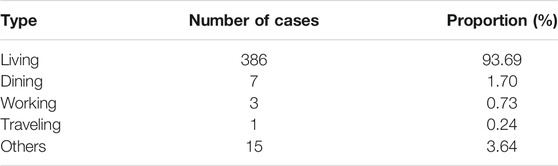
TABLE 1. Numbers of different types of close contact events.
The period of our dataset is the early stage of COVID-19 spread in China. The distribution of the scale in close contact events is a natural feature seen when people are free from movement regardless of the COVID-19 pandemic. The contact scale is intrinsically positive, with a few enormously high data points typically arising. The lognormal distribution is an ideal descriptor of such data, with a positive range, right skewness, heavy right tail, and easily computed parameter estimates. Supported by the K-S test with a value of 0.18, the log-normal distribution shows the proper fitting among the positive, skewed, heavy-tailed distribution candidate. The mechanism of lognormal distributed data in ecology can be obtained by stochastic differential equation [32], which would be another topic for further investigation. The result is shown in Figure 2,
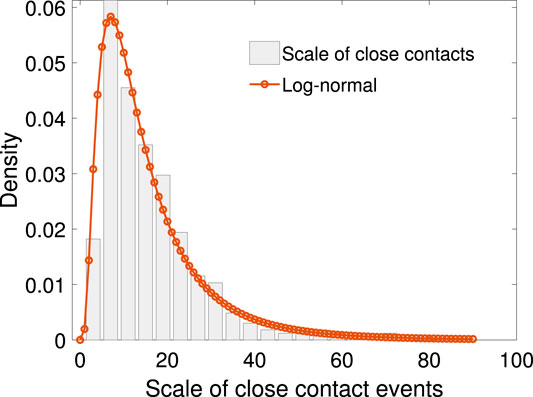
FIGURE 2. The empirical distribution of scale of close contact events with log-normal density fitting. The density function of this log-normal distribution is
The density function of this log-normal distribution is
where the fitting parameters are
3.3 Transmission Rate and the Scale of Close Contact Events
We define the transmission rate as the number of people infected in one close contact event over the number of people in that event. Figure 3 shows the scatter plot between the transmission rate and the scale of close contact events. It can be seen that the rate drops as the scale of events increases in a non-linear fashion.
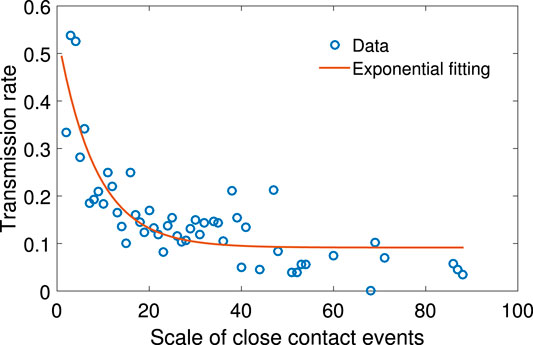
FIGURE 3. The scatter plot of N vs. the mean of p, together with exponential function fitting. The relationship between N and p can be fitted with function
Let p be the transmission rate and N the total number of people in the close contact events. Based on our sample, given the value of N, the mean p is calculated. The relationship between N and p can be fitted with the following exponential function:
where the fitting parameters are
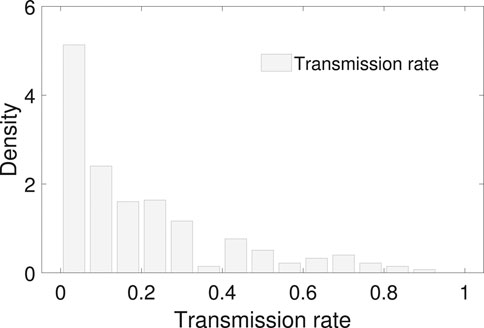
FIGURE 4. The empirical distribution of the transmission rate. The mean and median of the transmission rate is 0.20 and 0.13 with an interquantile range 0–0.3. No proper common distribution fits the empirical distribution.
3.4 Spreading Tree Structures
Transmission events can create tree structures to map disease spread. There are in total 421 chains verified from the record data. Among the chains, there are 311 chains with secondary cases, out of which there are 654 children in the second generation. However, due to effective prevention, there are only 54 and 11 children in the third and fourth generations, respectively. No fifth generation is observed in our dataset.
The reproduction number of an infection is the number of secondary infectees infected by the same confirmed individual. We define the reproduction number in each generation by dividing the number of infected people in the next generation by the present one. Based on the existence of at least one child in the next generation, the mean reproduction number in the first, second, and third generations are 2.10, 1.35, and 2.2. However, without the conditional restriction, the mean are 1.55, 0.08, and 0.2, respectively, see Table 2.
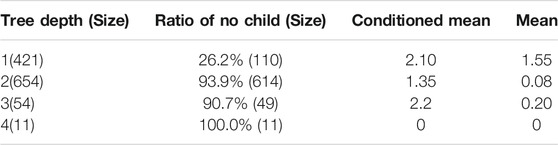
TABLE 2. The reproduction number in each generation of transmission in the spreading tree.
Using the sample of number of secondary cases caused by the 311 infectors in the first generation, empirical distribution, together with geometric fitting is shown in Figure 5. The geometric distribution law is
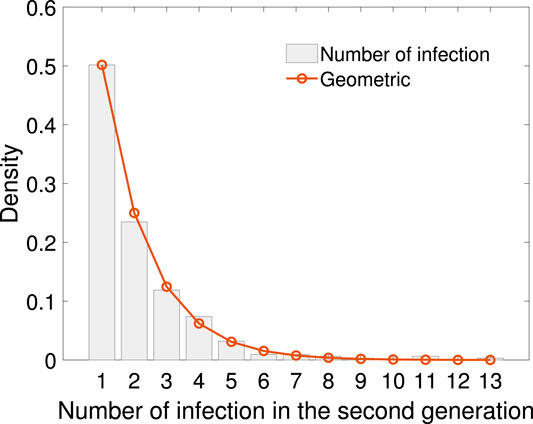
FIGURE 5. The empirical distribution of infection numbers in the second generation with geometric fitting. The geometric distribution law is
4 Discussion
In this study, based on the details of confirmed cases reported by the mass media, the following features are explored: the Weibull distribution of the incubation period, the Log-normal distribution of the scale of close contact events, the geometric distribution of the reproduction number in different generations of virus transmissions, and the statistical feature of secondary attack rate.
As far as we know, the distribution of the close contacts’ scale is released for the first time that it is log-normal distributed due to lack of data. This heavy-tailed distribution reveals a relatively larger possibility of super spreading events comparing to light-tailed distributions. To reduce the secondary infection, it is important to take adequate measures to reduce the scale of close contact and reduce the secondary infections. Moreover, efforts should be made to trace back the close contacts to cut off the possible spreading chain in advance.
It is notable that the method here is universal to all infectious diseases. The crucial step is the line-list record of each confirmed case and the detailed transmission relationship in the spreading tree structure. For infectious diseases where only non-pharmaceutical measurement can be applied to prevent its spreading, detailed record keeping of each confirmed case and the contact history is crucial. The tree structure is good evidence for the spreading trend and helpful for the precise estimation of the effective reproductive number. Moreover, contact history is useful to nip severe infectious diseases in the bud.
Theoretically, the reproduction number, say R, is a determining index quantifying the transmissibility. To control the pandemic, R should be less than one. Borrowed from the theory of branching processes, there is a phase transition with a critical value
Data Availability Statement
The datasets presented in this study can be found in online repositories. The names of the repository/repositories and accession number(s) can be found below: https://github.com/PDGLin/COVID19_EffSerialInterval_NPI
Author Contributions
LZ and JZ contributed equally as first authors. JZ, X-FL, and X-KX designed the analysis, LZ, XW, JY, and X-KX analyzed the data. LZ and X-FL wrote the paper.
Funding
This work was jointly supported by the Fundamental Research Funds for the Central Universities (No. 2019XD-A11), the National Natural Science Foundation of China (Grant Nos. 11971074, 61671005, 61672108, 61976025, 61773091), the LiaoNing Revitalization Talents Program (XLYC1807106).
Conflict of Interest
The authors declare that the research was conducted in the absence of any commercial or financial relationships that could be construed as a potential conflict of interest.
References
1. Wang C, Horby PW, Hayden FG. A novel coronavirus outbreak of global health concern. Lancet. (2020a) 395:470–3. doi:10.1016/S0140-6736(20)30185-9
2. Wang P, Zheng X, Li J. Prediction of epidemic trends in COVID-19 with logistic model and machine learning technics. Chaos, Solit. Fractals (2020b) 139:110058. doi:10.1016/j.chaos.2020.110058
3. Hu Z, Xu C, Jin G. Clinical characteristics of 24 asymptomatic infections with COVID-19 screened among close contacts in nanjing, China. Sci. China Life Sci. (2020) 63:706–11. doi:10.1007/s11427-020-1661-4
4. Du Z, Xu X, Wu Y. Serial interval of covid-19 among publicly reported confirmed cases. Emerg. Infect. Dis. (2020) 26:1341–3. doi:10.3201/eid2606.200357
5. Yang Y, Lu QB, Liu MJ. Epidemiological and clinical features of the 2019 novel coronavirus outbreak in China (2020). medRxiv preprint. doi:10.1101/2020.02.10.20021675
6. Lauer SA, Grantz KH, Bi Q. The incubation period of coronavirus disease 2019 (COVID-19) from publicly reported confirmed cases: estimation and application. Ann. Intern. Med. (2020) 127:577–83. doi:10.7326/M20-0504
7. Liu Y, Gayle AA, Wilder-Smith A. The reproductive number of COVID-19 is higher compared to sars coronavirus. J. Trav. Med. (2020a) 6:1–4. doi:10.1093/jtm/taaa021
8. Sanche S, Lin YT, Xu C. The novel coronavirus, 2019-ncov, is highly contagious and more infectious than initially estimated (2020). arXiv preprint arXiv: 2002.03268.
9. You C, Deng Y, Hu W. Estimation of the time-varying reproduction number of covid-19 outbreak in China. Int. J. Hyg. Environ. Health (2020) 228:1–7. doi:10.1016/j.ijheh.2020.113555
10. Qin J, You C, Lin Q. Estimation of incubation period distribution of covid-19 using disease onset forward time: a novel cross-sectional and forward follow-up study (2020). medRxiv preprint. doi:10.1101/2020.03.06.20032417
11. Men K, Wang X, Li Y. Estimate the incubation period of coronavirus 2019 (covid-19) (2020). medRxiv preprent. doi:10.1101/2020.02.24.20027474
12. McAloon C, Collins A, Hunt K Incubation period of covid-19: a rapid systematic review and meta-analysis of observational research. BMJ Open 10 (2020) 1–9. doi:10.1136/bmjopen-2020-039652
13. Liu Y, Eggo RM, Kucharski AJ. Secondary attack rate and superspreading events for sars-cov-2 (2020b). Lancet 395:e47. doi:10.1016/S0140-6736(20)30462-1
14. Li Q, Guan X, Wu P. Early transmission dynamics in wuhan, China, of novel coronavirus-infected pneumonia. N. Engl. J. Med. (2020a) 382:1199–207. doi:10.1056/NEJMoa2001316
15. Paules CI, Marston HD, Fauci AS. Coronavirus infections–more than just the common cold. JAMA Network (2020) 328:707–8. doi:10.1001/jama.2020.0757
16. Zhao S, Lin Q, Ran J. Preliminary estimation of the basic reproduction number of novel coronavirus (2019-ncov) in China, from 2019 to 2020: a data-driven analysis in the early phase of the outbreak. Int J Infect Dis (2020) 92:214–7. doi:10.1016/j.ijid.2020.01.050
17. Gatto M, Bertuzzo E, Maria L. Spread and dynamics of the covid-19 epidemic in Italy: effects of emergency containment measures. Proc. Natl. Acad. Sci. USA (2020) 117:10484–91. doi:10.1073/pnas.2004978117/-/DCSupplemental
18. Kucharski AJ, Russell TW, Diamond C. Early dynamics of transmission and control of covid-19: a mathematical modelling study. Lancet Infect. Dis. (2020) 20:553–8. doi:10.1016/S1473-3099(20)30144-4
19. Maier BF, Brockmann D. Effective containment explains subexponential growth in recent confirmed COVID-19 cases in China. Science (2020) 368:742–6. doi:10.1126/science.abb4557
20. Zhao S, Chen H. Modeling the epidemic dynamics and control of COVID-19 outbreak in China. Quant. Biol. (2020) 7:1–9. doi:10.1007/s40484-020-0199-0
21. Fang Y, Nie Y, Penny M. Transmission dynamics of the COVID-19 outbreak and effectiveness of government interventions: a data-driven analysis. J. Med. Virol. (2020) 92:645–59. doi:10.1002/jmv.25750
22. Li HJ, Bu Z, Wang Z, Cao J. Dynamical clustering in electronic commerce systems via optimization and leadership expansion. IEEE Transactions on Industrial Informatics (2020b) 16:5327–34. doi:10.1109/TII.2019.2960835
23. Ndairou F, Area I, Nieto JJ. Mathematical modeling of covid-19 transmission dynamics with a case study of wuhan. Chaos, Solit. Fractals (2020) 135:1–6. doi:10.1016/j.chaos.2020.109846
24. Chen YC, Luy PE, Chang CS. A time-dependent sir model for COVID-19 with undetectable infected persons (2020). arXiv:200300122
25. Giordano G, Blanchini F, Bruno R. Modelling the COVID-19 epidemic and implementation of population-wide interventions in Italy. Nat. Med. (2020) 26:855–60. doi:10.1038/s41591-020-0883-7
26. Li HJ, Wang Z, Cao J. Optimal estimation of low-rank factors via feature level data fusion of multiplex signal systems. IEEE Trans. Knowl. Data Eng. (2020c) 13:33–9. doi:10.1109/TKDE.2020.3015914
27. Li HJ, LinWang , Matjaz Perc YZ. Optimization of identifiability for efficient community detection. New J. Phys. 22 (2020d) 1–10. doi:10.1088/1367-2630/ab8e5e
28. Peng L, Yang W, Zhang D. Epidemic analysis of COVID-19 in China by dynamical modeling (2020).arXiv:200206563v2
29. Chinazzi M, Davis JT, Ajelli M. The effect of travel restrictions on the spread of the 2019 novel coronavirus (COVID-19) outbreak. Science (2020) 368:395–400. doi:10.1126/science.aba9757
30. Hellewell J, Abbott S, Gimma A. Feasibility of controlling covid-19 outbreaks by isolation of cases and contacts. Lancet Global Health (2020) 8:e488–96. doi:10.1016/S2214-109X(20)30074-7
31. Ali ST, Wang L, Lau EHY. Serial interval of sars-cov-2 was shortened over time by nonpharmaceutical interventions. Science (2020) 19:17–39. doi:10.1126/science.abc9004
Keywords: COVID-19, incubation period, close contacts, superspreading, effective reproduction number, spreading tree
Citation: Zhang L, Zhu J, Wang X, Yang J, Liu XF and Xu X-K (2021) Characterizing COVID-19 Transmission: Incubation Period, Reproduction Rate, and Multiple-Generation Spreading. Front. Phys. 8:589963. doi: 10.3389/fphy.2020.589963
Received: 31 July 2020; Accepted: 16 November 2020;
Published: 11 January 2021.
Edited by:
Aristides (Aris) Moustakas, Natural History Museum of Crete; University of Crete, GreeceReviewed by:
Gui-Quan Sun, North University of China, ChinaChen Chu, Yunnan University of Finance and Economics, China
Wen-Xuan Wang, Beijing University of Posts and Telecommunications (BUPT), China
Copyright © 2021 Zhang, Zhu, Wang, Yang, Liu and Xu. This is an open-access article distributed under the terms of the Creative Commons Attribution License (CC BY). The use, distribution or reproduction in other forums is permitted, provided the original author(s) and the copyright owner(s) are credited and that the original publication in this journal is cited, in accordance with accepted academic practice. No use, distribution or reproduction is permitted which does not comply with these terms.
*Correspondence: Xiao Fan Liu, xf.liu@cityu.edu.hk; Xiao-Ke Xu, xuxiaoke@foxmail.com