 Chanan Sukprakun1
 Supatporn Tepmongkol1,2,3,4*
- 1Division of Nuclear Medicine, Department of Radiology, Faculty of Medicine, Chulalongkorn University, Bangkok, Thailand
- 2Chulalongkorn University Biomedical Imaging Group (CUBIG), Faculty of Medicine, Chulalongkorn University, Bangkok, Thailand
- 3Chula Neuroscience Center, King Chulalongkorn Memorial Hospital, Bangkok, Thailand
- 4Cognitive Impairment and Dementia Research Unit, Faculty of Medicine, Chulalongkorn University, Bangkok, Thailand
Background: Epilepsy is one of the most common neurological disorders. Approximately, one-third of patients with epilepsy have seizures refractory to antiepileptic drugs and further require surgical removal of the epileptogenic region. In the last decade, there have been many recent developments in radiopharmaceuticals, novel image analysis techniques, and new software for an epileptogenic zone (EZ) localization.
Objectives: Recently, we provided the latest discoveries, current challenges, and future perspectives in the field of positron emission tomography (PET) and single-photon emission computed tomography (SPECT) in epilepsy.
Methods: We searched for relevant articles published in MEDLINE and CENTRAL from July 2012 to July 2022. A systematic literature review based on the Preferred Reporting Items for Systematic Reviews and Meta-Analysis was conducted using the keywords “Epilepsy” and “PET or SPECT.” We included both prospective and retrospective studies. Studies with preclinical subjects or not focusing on EZ localization or surgical outcome prediction using recently developed PET radiopharmaceuticals, novel image analysis techniques, and new software were excluded from the review. The remaining 162 articles were reviewed.
Results: We first present recent findings and developments in PET radiopharmaceuticals. Second, we present novel image analysis techniques and new software in the last decade for EZ localization. Finally, we summarize the overall findings and discuss future perspectives in the field of PET and SPECT in epilepsy.
Conclusion: Combining new radiopharmaceutical development, new indications, new techniques, and software improves EZ localization and provides a better understanding of epilepsy. These have proven not to only predict prognosis but also to improve the outcome of epilepsy surgery.
Introduction
One of the most common neurological disorders is epilepsy. Approximately, one-third of patients with epilepsy have seizures refractory to antiepileptic drugs, so-called drug-resistant epilepsy, and further require surgical removal of the epileptogenic region (1). The epileptogenic zone (EZ) is defined by Lüders et al. as “the minimum amount of cortex that must be resected (inactivated or completely disconnected) to produce seizure freedom” (2). Thus, by this definition, EZ can be defined after surgery. To make a decision for epilepsy surgery, patients must undergo a series of tests as part of the routine standard preoperative evaluation to identify the “presumed” epileptogenic zone and determine surgical candidates. There are several non-invasive methods for this purpose, such as history taking, neurological examination, neuropsychological evaluation, electroencephalogram (EEG), magnetic resonance imaging (MRI), single-photon emission computed tomography (SPECT) using either 99mTc-ethyl cysteinate dimer (ECD) or 99mTc-hexamethyl propylene amine oxime (HMPAO), positron emission tomography (PET) using [18F]-fluorodeoxyglucose (FDG), and an invasive method, that is, intracranial EEG (iEEG) as electrocorticography (ECoG) using subdural grid electrodes or stereotactic EEG (SEEG) using depth electrodes (3). For EZ localization, no single test is ideal for identification, thereby it needs the consensus of multiple investigations.
Several cases of unfavorable surgical outcomes are still observed, although we have several sophisticated imaging modalities and techniques for this evaluation. This suggests the need for additional radiotracer and more advanced image analysis techniques or software for better EZ localization that provides a post-surgical seizure-free outcome. As a result, there have been increasing research studies in the field of PET and SPECT in epilepsy recently.
In this review, we provide the latest discoveries, current challenges, and future perspectives in the field of PET and SPECT in epilepsy in the last decade.
Methods
Search methods and selection criteria
In July 2022, we searched the relevant articles published in MEDLINE and CENTRAL from July 2012 to July 2022. A systematic literature review based on the Preferred Reporting Items for Systematic Reviews and Meta-Analysis (PRISMA) was conducted. First, we used the keywords “Epilepsy” and “PET or SPECT,” which yielded 1,399 studies imported for the title and abstract screening with six duplicates removed using Covidence (systematic review software, Veritas Health Innovation, Melbourne, Australia; available at www.covidence.org). We included both prospective and retrospective studies using PET or SPECT scans in patients with epilepsy. Studies with preclinical subjects or not focusing on EZ localization or surgical outcome prediction using recently developed PET radiopharmaceuticals, novel image analysis techniques, or new software were excluded from the review. Reviews and case reports were also excluded. After this step, there were 1,180 irrelevant studies. Of the 213 full-text studies assessed, 51 studies were further excluded. The final analysis of 162 studies was reviewed and categorized as the following: recent findings and development of non-FDG PET radiotracers (n = 42) and image analysis techniques or software for the detection of EZ and prediction of surgical outcomes (n = 120). PRISMA flow diagram is shown in Figure 1.
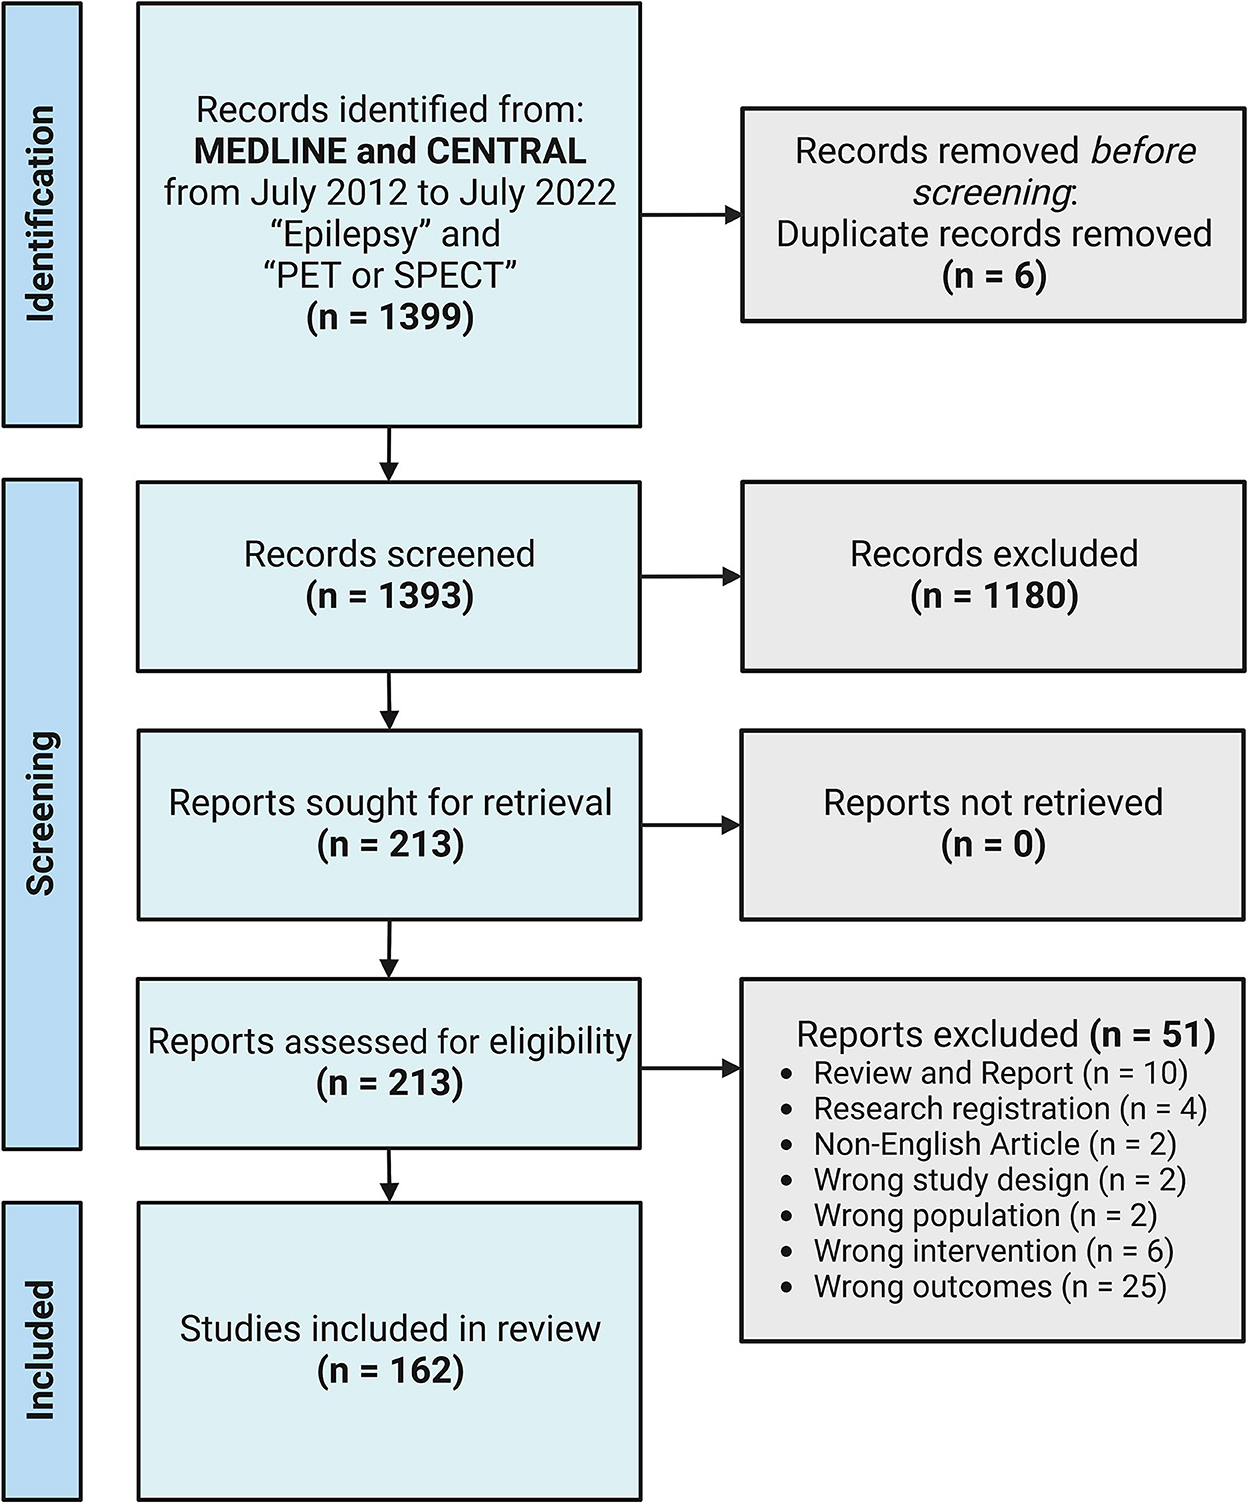
Figure 1. PRISMA flow diagram for the study recruitment. A final 162 studies were included.
Results
I. Radiopharmaceuticals
This section summarizes recent findings or developments of non-FDG radiotracers that bind to various receptors or proteins, which were published in the last decade. [18F]-FDG, a positron emission radiotracer, is one of the most commonly used radiopharmaceuticals for the detection of the functional deficit zone in patients with drug-resistant epilepsy. Although brain glucose hypometabolism is often observed in the interictal state, it represents both EZ and other functional deficit zones. Thus, to depend on FDG alone is not enough for EZ localization. Several non-FDG radiotracers targeting various specific receptors in an interictal phase were recently proposed for better EZ localization (Figure 2, Table 1).
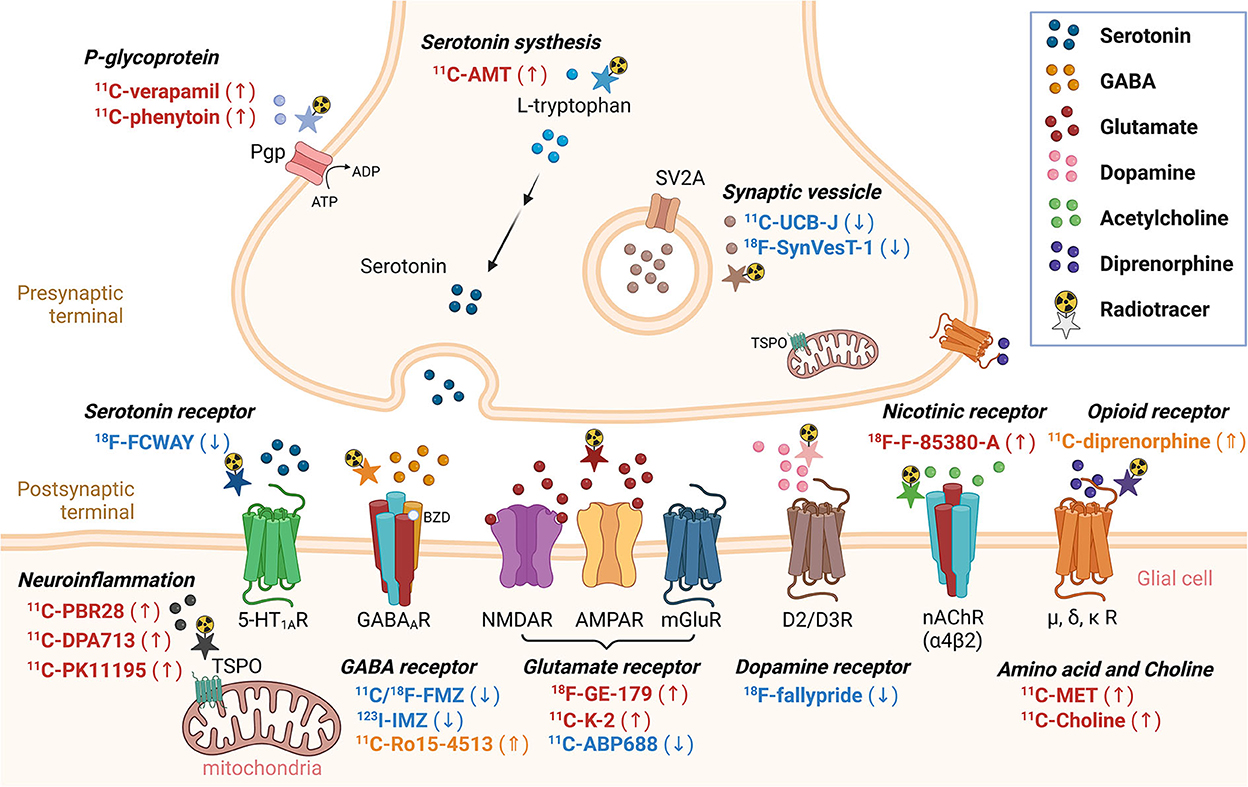
Figure 2. Non-FDG radiotracers used in epilepsy in the last decade. Radiotracers with a downward arrow, upward arrow, or upward double arrow showed decreased uptake, increased uptake, or increased volume of distribution, respectively.
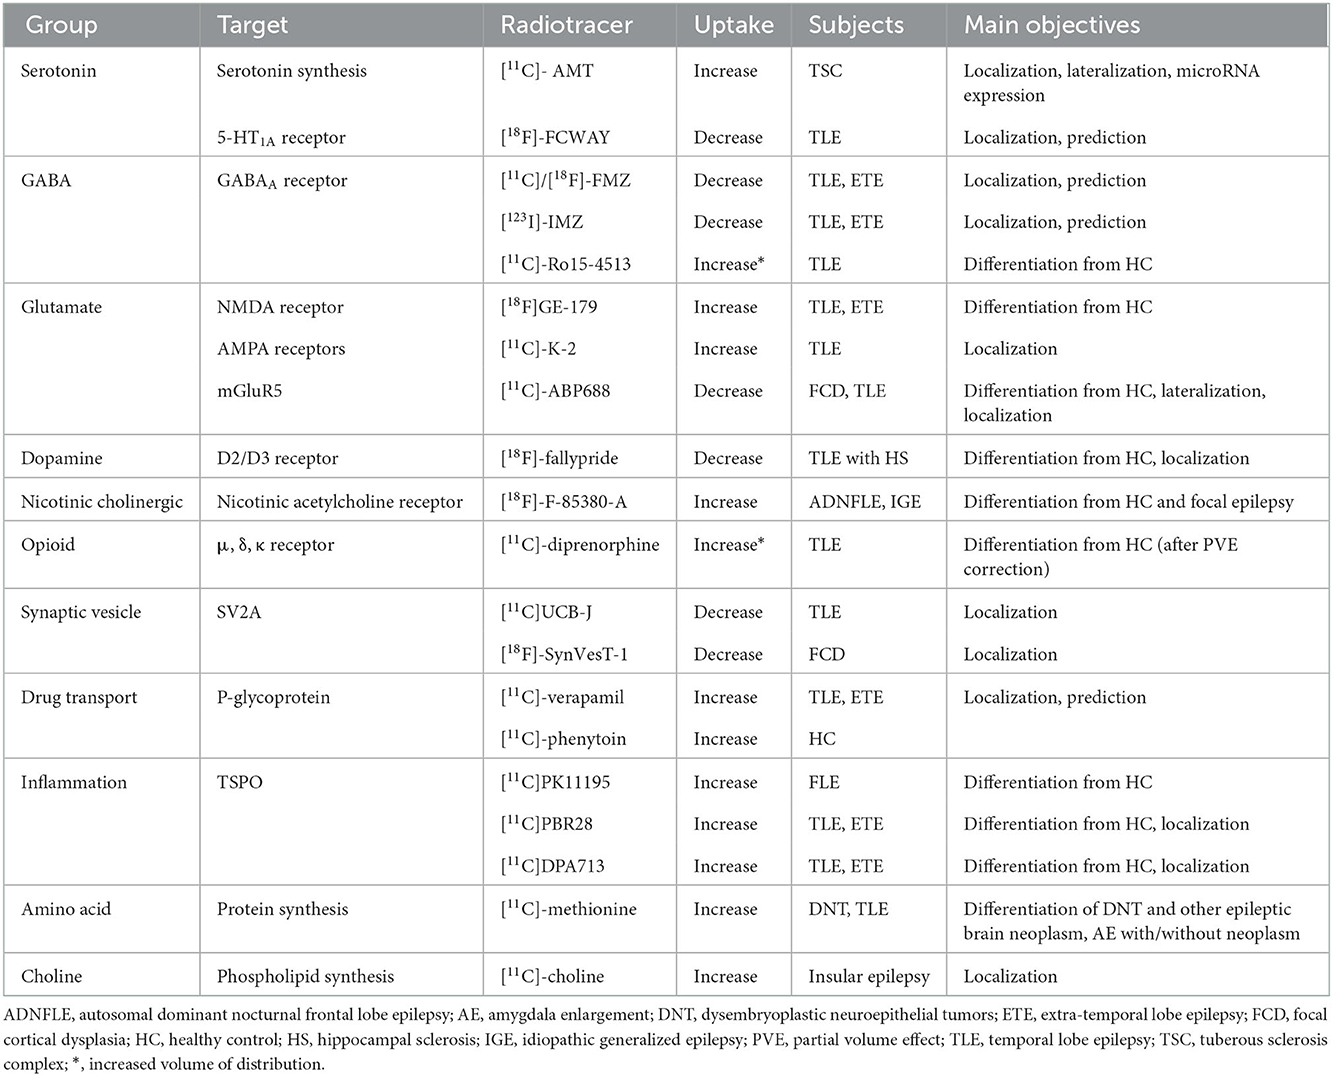
Table 1. Overview of non-FDG radiotracers recently used in epilepsy.
1. Serotonin system
1.1. [11C]-AMT and 1.2 [18F]-FCWAY
L-tryptophan is an amino acid precursor of the neurotransmitter serotonin. Alpha-[11C]-methyl-L-tryptophan ([11C]-AMT), a tryptophan analog, reflects the serotonin synthesis rate. [11C]-AMT PET shows increased uptake in the EZ and is mainly used for the localization or lateralization of the epileptogenic tubers in patients with tuberous sclerosis complex. Studies have revealed a correlation between AMT uptake and seizure duration or microRNA expression (4–6).
[18F]-trans-4-fluoro-N-2-[4-(2-methoxyphenyl) piperazin-1-yl]ethyl]-N-(2-pyridyl) cyclohexanecarboxamide ([18F]-FCWAY) is a selective antagonist of 5-hydroxytryptamine receptor 1A (5-HT1A). [18F]-FCWAY PET shows reduced binding ipsilateral to the epileptic focus in patients with temporal lobe epilepsy (TLE). The asymmetry index (AI) of [18F]-FCWAY binding may be used to predict temporal lobectomy outcome (7).
2. GABA receptors
2.1. [11C]-FMZ, 2.2 [18F]-FMZ, 2.3 [123I]-IMZ, and 2.4 [11C]-Ro15-4513
For PET and SPECT in epilepsy, various labeled radiotracers for selective antagonists of GABAA/benzodiazepine receptor have been used, which showed decreased binding reflecting the neuronal loss in the EZ. C-11 or F-18 labeled flumazenil (FMZ) as PET tracers for either PET or binding potential (BP) images can be used for EZ localization (8, 9). In patients with TLE, the volume of decreased FMZ binding showed no correlation with post-surgical outcomes. However, periventricular white matter [11C]-FMZ binding might be used to predict poor surgical outcomes (10, 11). A meta-analysis of [11C]-FMZ PET showed an overall sensitivity of 0.62 (95% CI: 0.49–0.73) and a specificity of 0.73 (95% CI: 0.59–0.84) for the localization of the EZ (12). [18F]-FMZ PET and [18F]-FMZ BP images could be used for EZ localization in TLE complementary to [18F]-FDG (13, 14). [123I]-iomazenil (IMZ), a SPECT tracer, other than showing reduced binding in the EZ (15–17), the reduction was also observed to extend from the mesial temporal lobe to the ipsilateral extrafocal region in TLE (16). IMZ SPECT correctly localized the seizure onset zone more often than the other two conventional tracers (ECD and IMP), but the lateralization performance was not significantly different from IMP SPECT (18).
[11C]-Ro15-4513 is an α5 subunit-selective inverse agonist of GABAA receptor. α5 subunit is a tonic inhibitor, unlike FMZ and IMZ, which are mainly indicative of the distribution of α1 subunit and have shown decreased binding in EZ. [11C]-Ro15-4513 parametric images of the volume of distribution showed increased binding in the anteromedial and lateral temporal lobe ipsilateral to the EZ, reflecting shifts of α1 to α5 in TLE with normal MRI and comorbid memory impairment (19).
3. Glutamate receptors
3.1. Ionotropic glutamate receptor
NMDA receptors.
3.1.1. [18F]GE-179
[18F]GE-179 is a ligand, which binds the phencyclidine recognition site within N-methyl-D-aspartate (NMDA) ion channel. [18F]GE-179 PET showed increased NMDA receptor ion channel activation in patients with focal epilepsy compared with healthy controls (20, 21).
AMPA receptors.
3.1.2. [11C]-K-2
4-[2-(phenylsulfonylamino)ethylthio]-2,6-difluoro-phenoxyacetamide radiolabeled with 11C ([11C]-K-2) is a ligand that binds to α-amino-3-hydroxy-5-methyl-4-isoxazole propionic acid (AMPA) receptor. [11C]-K-2 PET shows the density of cell surface AMPA receptors. There was increased [11C]-K uptake in the EZ of patients with mesial TLE (mTLE) (22, 23).
3.2. Metabotropic glutamate receptor
3.2.1. [11C]-ABP688
3-(6-methyl-pyridin-2-ylethynyl)-cyclohex-2-enone-O-11C-methyloxime ([11C]-ABP688) is a ligand that selectively binds the allosteric site of metabotropic glutamate receptor type 5 (mGluR5) and was used to study network integration. [11C]-ABP688 BP images showed decreased mGluR5 availability in the EZ of patients with focal cortical dysplasia and mTLE, reflecting less network integration in both diseases (24–27).
4. Dopamine receptor
4.1. [18F]-fallypride
Fallypride is an antagonist of the dopamine D2/D3 receptor. [18F]-fallypride PET reflects striatal and extrastriatal D2/D3-receptor binding. In patients with TLE and hippocampal sclerosis, [18F]-fallypride BP images showed decreased D2/D3 receptor available region that corresponds to “the irritative zone” surrounding the EZ (28).
5. Nicotinic receptor
5.1. [18F]-F-85380-A
[18F]-F-85380-A is a ligand that binds to the α4β2 subunit of neuronal nicotinic acetylcholine receptors (nAChRs). Using [18F]-F-85380-A PET, the study showed that there was a neurochemical correlation between the peripheral autonomic nervous system and central autonomic nervous system at the dorsal anterior cingulate cortex (dACC) and the anterior insula that represents the salience network (29). Another study by the same group also demonstrated that there was an increased availability of nAChRs in the bilateral dACC of idiopathic generalized epilepsy compared with patients with focal epilepsy or controls (30).
6. Opioid receptor
6.1. [11C]-diprenorphine
[11C]-diprenorphine is a non-selective antagonist of opioid receptors. Postictal [11C]-diprenorphine PET with partial volume effect correction showed increased [11C]-diprenorphine volume of distribution relative to the interictal state in the ipsilateral parahippocampal gyrus of patients with TLE (31).
7. Other
7.1. Synaptic vesicle
7.1.1. [11C]UCB-J AND 7.1.2 [18F]-SYNVEST-1
[(R)-1-[(3-(11C-methyl-11C)pyridin-4-yl)methyl]-4-(3,4,5-trifluorophenyl)pyrrolidin-2-one] or [11C]UCB-J is a ligand for synaptic vesicle glycoprotein 2A (SV2A), an integral transmembrane glycoprotein localized to secretory vesicles and is the binding site for some antiepileptic drugs (AEDs). [11C]UCB-J PET and [11C]UCB-J BP images reflect synaptic density and showed a reduction in the EZ of patients with TLE (32, 33). [18F]-SynVesT-1, previously called [18F]-SDM-8, is another ligand for SV2A. The loss of SV2A is also related to epileptogenesis in focal cortical dysplasia type II. The EZ of focal cortical dysplasia type II patients had significantly reduced [18F]-SynVesT-1 uptake compared with contralateral regions and showed a smaller region of abnormality than [18F]-FDG-PET (34).
7.2. P-glycoprotein
7.2.1. [11C]-verapamil and 7.2.2 [11C]-phenytoin
Verapamil, a calcium channel blocker, is usually used as AED adjunctive therapy. [11C]-verapamil is a radiolabeled P-glycoprotein (Pgp) substrate. Overexpression of Pgp is believed to be a possible cause of drug-resistant epilepsy. [11C]-verapamil PET showed changes in Pgp function before and after temporal lobectomy, which might be associated with good seizure control (35). Quantitative analysis based on [11C]-verapamil PET with Pgp inhibitor, for example, cyclosporin A and tariquidar, could be used for localizing or lateralizing the EZ (36, 37). Phenytoin is another widely used AED. [11C]-phenytoin PET is also used for mapping regional Pgp overexpression. A quantification method for kinetic evaluation in healthy controls was developed (38).
7.3. Neuroinflammation
7.3.1. [11C]PK11195, 7.3.2 [11C]PBR28, and 7.3.3 [11C]DPA713
Upregulated translocator protein 18 kDa (TSPO) in response to glial cell activation is a marker of neuroinflammation. TSPO PET with [11C]PK11195, the first-generation ligand, showed a region of increased TSPO expression corresponding to clinically defined frontal lobe epilepsy and a postictal scan showing significantly greater inflammation intensity and spatial extent (39). [11C]PBR28 and [11C]DPA713 are the second-generation ligands of TSPO. [11C]DPA713 PET showed increased uptake in the EZ of child-onset epilepsy (40). However, both [11C]PBR28 and [11C]DPA713 may show increased uptake both on the ipsilateral and contralateral sides of seizure foci in patients with neocortical epilepsy and TLE (41, 42). This may limit the use of these tracers for EZ localization.
7.4. Amino acid and choline
7.4.1. [11C]-methionine and 7.4.2 [11C]-choline
[11C]-methionine is an amino acid tracer, which is widely useful for detecting brain tumors. [11C]-methionine PET could differentiate between dysembryoplastic neuroepithelial tumors (DNTs), a much more benign tumor, and other epileptogenic brain neoplasms (43). [11C]-methionine PET could detect increased uptake in the enlarged amygdala associated with neoplasms but showed no uptake in non-neoplastic lesions in TLE patients with amygdala enlargement (44).
[11C]-choline is an endogenous substrate tracer, which is widely used in primary prostate cancer and low-grade astroglioma. [11C]-choline uptake is also increased in epileptogenic low-grade glioma and malformation of cortical development (45).
II. Image analysis techniques and software
Brain perfusion SPECT
The two most commonly used cerebral blood flow agents in epilepsy, 99mTc-ECD and 99mTc-HMPAO, are usually used for brain perfusion SPECT in both the ictal and interictal phases. Regional cerebral blood flow (rCBF) to the seizure onset zone is increased by up to 300% during the ictal phase (46). Therefore, the region of hyperperfusion observed on the ictal SPECT is suspected to be the seizure onset zone. However, ictal SPECT requires rapid injection of the radiotracer during a seizure to capture the seizure onset zone, not the seizure spreading zone. In cases with delayed injection, false localization of the seizure onset zone could be observed. Injection time is defined as the time from the seizure onset to the end time of injection. The longer the injection time, the more false detection of the seizure onset zone in TLE (47). Latency time is defined as the time from the seizure onset to the initiation time of injection. A remote-controlled automated injector was introduced to enhance rapid injection with the additional benefit of less radiation to the staff. Remote-controlled automatic injectors for ictal SPECT showed shorter latency time, a higher detection rate of EZ, and a lower number of patients with repeated studies than the traditional manual injection in pediatric patients (48, 49). Remote-controlled automated injectors for adult patients also showed equivalent injection time (50) or shorter latency time (51) than the traditional manual injection. An EEG-driven autonomous injection system prototype without manual intervention was proposed in the seizure prediction model and showed promising results (52). During the interictal phase, rCBF may show decreased or normal perfusion in the seizure onset zone. Visual comparison of ictal and interictal SPECT to detect hyperperfusion changes and computer-assisted subtraction techniques are routinely performed. Visual analysis of specific findings or parameters is helpful in epilepsy evaluation. Combined 99mTc-ECD SPECT parameters (maximum perfusion on ictal phase combined with maximum perfusion change between ictal and interictal phases) provided more specificity, positive predictive value (PPV), and accuracy than a single SPECT parameter for assessing seizure onset zone in patients with MRI-negative extratemporal lobe epilepsy (53). Relatively increased ictal perfusion in the contralateral central structures, that is, the corpus callosum, basal ganglia, and thalamus, were significantly associated with good surgical outcomes in patients with drug-resistant epilepsy (54).
Computer-assisted subtraction technique, that is, subtraction ictal SPECT coregistered to MRI (SISCOM), is one of the most common techniques performed nowadays. The ictal SPECT images are subtracted by the interictal images to generate the different images. The different or subtraction images were converted into Z-score images using the mean and standard deviation of the differences in all brain voxels. Proper selection of a Z-score (or threshold) is crucial for optimal interpretation. SISCOM with a Z-score of 1.5 or 2.0 is often used. In one study with a 6-month follow-up, SISCOM with a Z-score of 1.5 showed higher sensitivity and specificity for EZ localization than the Z-score of 2.0 (55). Another larger study stated that SISCOM with a Z-score of 1.5 and 2.0 had no significant differences in EZ localization, and inter-observer agreement was higher in the 2.0 threshold (56). When MRI is not available for coregistration, subtraction ictal SPECT coregistered to interictal SPECT (SISCOS) may be used as a makeshift. SISCOM had higher concordant or better EZ localization than visual analysis, MRI, FDG-PET, and ictal SPECT alone in adults and children with drug-resistant epilepsy (57–59). SISCOM of subcortical structures, that is, ipsilateral basal ganglia, thalamic, and contralateral cerebellar hyperperfusion could provide additional clues for EZ lateralization (60). The combination of SISCOM with other image modalities provides better EZ localization than using it alone. SISCOM plus EEG source imaging (ESI) showed good localization in TLE (61). From a meta-analysis, SISCOM had moderate sensitivity for EZ localization and gave additional information when MRI is negative (62). SISCOM also provides predictive values for post-surgical outcomes. The post-surgical outcome is associated with the extent of the resection site overlapping with SISCOM results (63), and the seizure-free odds ratio was 2.44–3.28 times higher in concordant than in non-concordant SISCOM to the resected region (62). TLE patients with increased perfusion in the contralateral occipital area by SISCOM tend to have less seizure freedom than those without (64). Lobar concordance of SISCOM localization and ictal onset identified on scalp EEG was significantly correlated with the post-surgical outcome in children with TLE (65).
Many other techniques have been recently implemented other than using SISCOM to aid the EZ localization. SPECT reconstruction method that jointly reconstructed ictal and interictal SPECT projection data showed a reduction of noise in the image used for seizure localization than the conventional subtraction method and showed good EZ localization (66, 67). Clearance patterns of 99mTc-ECD are also helpful in evaluating the seizure onset zone in that the seizure onset zone showed slower washout in ictal SPECT but faster washout in interictal SPECT than in contralateral brain regions (68). Scaled subprofile model principal component analysis of ictal brain perfusion SPECT provided independent information from demographic and clinical data for the prediction of post-surgical outcomes in patients with TLE (69).
Quantitative analysis of brain perfusion SPECT with an age-matched normal database was performed much lesser than that of FDG-PET; however, there are several studies with good clinical values that have been published in the last decade. Statistical ictal SPECT coregistered to MRI analysis (STATISCOM) decides statistically significant perfusion changes in epilepsy patients compared with healthy controls. Some studies stated that STATISCOM was superior to SISCOM for EZ localization in MRI-negative epilepsy patients because SISCOM did not compensate for physiologic variance in CBF (70). Interestingly, STATISCOM showed better agreement with video EEG data with no effect of delayed radiotracer injection time, which is in contrast to SISCOM (71). Statistical Parametric Mapping (SPM) software (Wellcome Trust Center for Human Neuroimaging, UCL, London, UK; http://www.fil.ion.ucl.ac.uk/spm), a free and open-source software based on the MATLAB platform (MathWorks, Inc., Natick, MA, USA), is commonly used worldwide for brain functional imaging analysis, including SISCOM and STATISCOM. However, the process of SPM analysis is quite complex and requires some experience. There are several optionally free and commercial software or programs with more simplified processes available. FocusDET, a toolbox for SISCOM analysis, showed low registration error and provided user-editable SPECT-SPECT and SPECT-MRI registration (72). MNI SISCOM is an open-source software graphical desktop application, which provides command line and Python interfaces for users who would like to integrate these features into their own scripts and pipelines (73). Among MIMneuro (MIM Software Inc., Cleveland, OH, USA) analysis, STATISCOM, and SISCOM using SPM, STATISCOM showed the best performance for seizure onset zone localization, followed by MIMneuro and SISCOM, respectively (74). Quantitative analysis of 99mTc-ECD using NeuroGam software (GE Medical System, Segami Corp., Columbia, MD, USA) showed a higher sensitivity for EZ localization than EEG, MRI, or visual analysis (75, 76). Qualitative analysis of 99mTc-HMPAO SPECT and quantitative analysis using SPM to compare patient's image data with a normal template by Z-score map and extract Zmax of each voxel with the percentage of voxels with a Z-score higher than 2.5 could provide a diagnosis of nonconvulsive status epilepticus (NCSE) (77).
Brain FDG-PET
Brain FDG-PET has been used as a biomarker to assess cerebral glucose metabolism, although not reflecting the whole proportion of glucose metabolism (78). Because FDG-PET scans are performed during the interictal phase, interictal FDG PET is often shortly called FDG-PET. Hypometabolism on FDG-PET reflects the functional deficit zone, which usually encompasses EZ. While visual analysis alone is commonly reported to be negative (79, 80), one study showed that the visual re-assessment of FDG-PET could provide the possible functional deficit zone when the previous results were reported as negative (81). Ipsilateral thalamic hypometabolism could provide additional value for lateralization in TLE without hypometabolism in the temporal lobe (82).
Many studies have shown that quantitative FDG-PET provides much more critical information. Quantitative measurement of the standardized uptake value (SUV) of the region of interests (ROIs) is routinely performed. The selection of ROIs as global or a portion of the temporal lobe showed differences in EZ lateralization in TLE with better identification using the global temporal lobe (83). SUV ratio (SUVr) is an intensity normalization of SUV in which the SUV of ROIs is divided by the SUV of reference regions, such as cerebellum gray matter (GM) or the mean intensity of the skull-stripped FDG-PET image. Quantification of hippocampal glucose uptake by SUVr increases the detection of hippocampal sclerosis over conventional visual analysis (84). Quantitative analysis using SPM requires the selection of a threshold with p-value and cluster sizes. Using SPM analysis by comparing the patient's image with a controlled database, a combination of the uncorrected p-value of < 0.005 and a cluster size of more than 200 yielded the best EZ localization in visually negative FDG-PET studies (79). In TLE, SPM analysis comparing patients' images with age-matched controls showed that there were larger areas of extratemporal hypometabolism in the post-operative seizure-recurrence group compared with the seizure-free group, for example, hypometabolism at the bilateral anterior cingulate and right orbitofrontal in patients with right TLE (85) or ipsilateral insula and contralateral temporal pole (86) or contralateral frontal and thalamic areas (87) in the seizure-recurrence group. On the contrary, the post-operative seizure-free group showed significant hypometabolism restricted to the ipsilateral temporal tip and hippocampal area (87). Distinct epileptic networks in patients with right vs. left mTLE were observed. Patients with right mTLE showed significantly higher rates of contralateral temporal lobe hypometabolism, which might be a predictor of poor post-surgical outcomes (88). SPM analysis of the high sudden unexpected death in the epilepsy risk group showed bilateral medial frontal and inferior frontal hypometabolism (89). SPM with some modifications on data preprocessing or processing, for example, SPM-computational anatomy toolbox and PET-analysis software that allowed observers to modulate thresholds with multiple p-values and different cluster sizes in real time, showed significantly higher EZ localization than that obtained with the conventional SPM (90, 91). Block-matching normalization method, where most transformations are computed through small blocks, showed more accurate EZ localization than conventional SPM normalization methods in patients with TLE (92). SPM t-score maps of FDG-PET could be displayed as 3D SPM t-score surface maps using FreeSurfer (http://surfer.nmr.mgh.harvard.edu) and showed good concordance with ECoG for EZ localization (93). MIMneuro software not only characterized brain perfusion SPECT but also cerebral glucose metabolism by using a normal FDG-PET database and could build an in-house normal database in addition to the default western population database (94). The values of the Z-score in different brain regions are displayed in color on the images and in number. In patients with non-lesional TLE, MIMneuro showed moderate agreement with visual analysis with better delineation of small lesions and increased clinicians' confidence in diagnosis (95, 96). Scenium (Siemens software, Knoxville, TN, USA) is another automatic program for comparing patients' images with a group of normal databases and displays the result in the standard deviation on both the image and in number. It proved to be of additional value to visual assessment in extratemporal lobe epilepsy when the visual assessment was negative (80). The age-matched database is important when evaluating pediatric patients because there are age-related variations in regional cortical glucose metabolism asymmetry as left over right in the frontal and right over left in the posterior regions (97). Therefore, an age-matched pseudo-control group to optimize SPM analysis of FDG-PET in pediatric epilepsy was proposed (98). Functional deficit zone in pediatric epilepsy using in-house age-specific FDG-PET templates by linear registration between PET images and pediatric MRI template showed better agreement with the clinical diagnosis than using the in-built adult control dataset (99). A pediatric-age-specific FDG-PET template based on a nonlinear optimization method improved spatial normalization and showed better EZ localization than using the adult template and linear template (100). Three-dimensional stereotactic surface projection (3D-SSP; NEUROSTAT) software is another user-friendly voxel-based brain mapping software for FDG-PET, which was proven to improve EZ detection compared with visual assessment and MRI and its performance is comparable with SPM analysis (101). Hypometabolism of the ipsilateral hippocampus and amygdala on FDG-PET with 3D-SSP could predict a good surgical outcome for patients with mTLE (102). Visual assessment of FDG-PET combined with SPM or 3D-SSP can improve the sensitivity of EZ detection in MRI-negative patients with drug-resistant epilepsy (103).
Several methods for asymmetry measurements are often used for the lateralization or localization of the EZ. AI is the difference between left and right values divided by left and right mean values. AI of SUVr derived from FDG-PET might be used for the evaluation of clinical severity and progress in pediatric epilepsy. Higher AI values were found in those with drug resistance than with seizure remission (104). Benign epilepsy with centro-temporal spikes (BECTSs), which possess a less favorable outcome than typical BECTS, was shown to have higher AI and more hypometabolic regions than typical BECTs on FDG-PET (105). AI-derived from FDG-PET and arterial spin labeling (ASL) or T2 mapping showed a positive correlation for TLE lateralization (106, 107). AI of Z-score derived from FDG-PET/CT, hybrid PET/MR, and ASL showed high agreement in EZ lateralization in patients with MRI-negative drug-resistant epilepsy (108). AI mappings were concordant with clinical data on the lateralization and localization of EZ in patients with drug-resistant epilepsy (109). Delayed PET scan 2.5 h after FDG injection better identified EZ with relatively greater AI than the conventional time scan AI (110). AI of dynamic FDG kinetic parameters that reflected net metabolic flux (Ki) and phosphorylation (k3) in EZ showed larger AI values and better correlation with AI of static FDG-PET SUVr than influx (K1) and efflux (k2) in patients with drug-resistant epilepsy and showed a difference from healthy controls. Hypometabolism of EZ may be related to reduced phosphorylation (111). Hypometabolism asymmetry (HA) is the difference between left and right values divided by the maximum values of left and right. HA calculated from an SUV of the hippocampus to generate the hypometabolism probability profile could be used for lateralizing TLE (112). Percentage metabolism loss (PML) is an HA expressed as a number out of 100. PML from SUV of the hippocampus and BA38 (temporopolar neocortex) could be used for EZ localization in patients with TLE with PML cutoffs of 5.77 and 8.36%, respectively, for the hippocampus and BA 38 to detect TLE with a sensitivity of 72.7% and a specificity of 77.8% (113).
An increasing number of advanced techniques for the lateralization and localization of EZ have been observed recently—some focusing on regional brain abnormality but many more stressed analyzing metabolic brain networks. Voxel-level Z-score maps of the kinetic parameter (Ki) generated from dynamic FDG-PET with a Z-score cut-off of <-1.65 can be used to detect temporal hypometabolism in TLE patients with normal static PET images (114). In non-lesional extratemporal lobe epilepsy, dynamic FDG-PET-created regional glucose metabolic rate maps showed increased detection rate and confidence in the original visual readings (115). Evaluation of cerebral glucose metabolic networks using graph theoretical or connectivity analysis demonstrated different global and local metabolic connectivity between TLE and healthy controls (116, 117), between left and right TLE (118), and between TLE with and without hippocampal sclerosis (119) and showed association with post-surgical outcome (120, 121). Graph theoretical analysis was also performed to evaluate the alteration of global or local perfusion network between ictal and interictal states using brain perfusion SPECT in TLE (122) and alteration of metabolic network on FDG-PET in insular epilepsy compared with the control group (123). Area restriction of glucose metabolism in FDG-PET combined with diffusion tensor imaging (DTI) showed different patterns of white matter alterations reflecting the variation of network involvement in TLE with hippocampal sclerosis (124) with fewer white matter fibers observed on the ipsilateral side around the glucose hypometabolic region in patients with drug-resistant epilepsy in another study (109). Distribution–divergence-based method, which was used to construct individual metabolic networks from FDG-PET imaging, could predict seizure-free outcomes in patients with TLE with a sensitivity of 75%, a specificity of 92.79%, and an accuracy of 83.59% (125). A statistical framework using Bayesian hierarchal modeling was implemented to classify between surgical outcomes based on profiles of regional FDG-PET hypometabolism as the phenotypic manifestation of a latent individual pathological state and could predict the subgroup of patients with TLE at high risk of post-surgical seizure-recurrence with high cross-validated accuracy (126). Several studies using supervised or unsupervised machine learning classification algorithms, such as decision tree (DT), logistic regression (LR), logistic model tree (LMT), random forest (RF), multivariate pattern analysis (MPA), support vector machine (SVM), multilayer perceptron (MLP), artificial neural network, convolutional neural network (CNN), and XGBoost, were published. Machine learning using FDG-PET with classification algorithms by MLP (127, 128), LR (129), LMT (130), SVM (131), MPA (132), CNN (133), and combined several methods (134) were used for the lateralization of TLE. Machine learning classification algorithms by DT, LR, RF, SVM, and XGBoost using FDG-PET and/or MRI were used for the detection of focal cortical dysplasia (135, 136). Combined clinical EEG and MRI lesion status with the addition of quantitative PET asymmetry features with the RF method outperformed that using qualitative clinical data to predict TLE with the post-surgical outcome (137).
Techniques affecting image quality or workflow
Some techniques have been explored for better image quality before analysis of the image can be performed. A study found that different algorithms (maximum a posteriori reconstructions or maximum likelihood expectation maximization reconstruction with resolution recovery) for FDG-PET brain image reconstruction affected GM activity estimation without altering the detection of hypometabolic regions when performing a voxel-based group comparison in patients with epilepsy (138). MRI GM segmentation of FDG-PET dramatically increased the detection of PET hypometabolic areas corresponding to iEEG onset zones than without segmentation. However, this technique had less impact on Ictal-Interictal SPECT Analysis by SPM (139). For hybrid PET/MR, there have been concerns about the accuracy of MR-based attenuation correction (MRAC) for emitted PET signals. However, studies have shown that using optimal MRAC provided equivalent or non-inferior diagnostic accuracy and sensitivity to PET/CT for EZ localization in adult and pediatric patients with drug-resistant epilepsy (140, 141). Different protocols for PET and MRI acquisition for a hybrid PET/MR machine were studied. Acquiring PET and MRI immediately and simultaneously after FDG injection resulted in significantly higher FDG uptake in the whole brain and many brain regions, while there was less effect when acquiring MRI with PET 40 min after FDG injection, and the findings were similar to acquiring PET without MRI at 40 min (142). Finally, combined PET, MRI, EEG-fMRI, and ESI based on data recorded in a single session using an MR-compatible EEG system and a hybrid PET/MR scanner could avoid multiple scanning sessions and improve the workflow in pre-surgical evaluation (143).
Combination of image modalities and hybrid PET/MRI
The combination of multiple neuroimaging modalities usually provides better diagnostic performance for the lateralization and localization of EZ than a single image modality, except in one study, which showed that combined quantitative PET with MRI (cortical thickness) and DTI (white matter anisotropy) did not perform better than PET asymmetry (mean, variance, skewness, and kurtosis) analysis alone for TLE lateralization (144). Other studies were positive for SPECT and/or PET with MRI combinations. Combined MRI and SPECT data using Bayesian model averaging and multinomial LR with linearly weighting posterior probabilities of MRI features and SPECT intensity were proven reliable for TLE lateralization, which probably omits the need for invasive EEG monitoring (145). PET interictal subtracted ictal SPECT coregistered with MRI (PISCOM) that used interictal FDG-PET instead of interictal brain perfusion SPECT was higher or not inferior to SISCOM in identifying EZ in both adult and pediatric patients (146, 147). In MRI-negative patients, many techniques were proven helpful in defining EZ, for example, (1) coregistration of PET/MRI or SISCOM/PET/MRI images was proven useful for epilepsy surgery planning (148); (2) The combination of morphometric analysis program for MRI, PET/MRI coregistration, and SPM analysis of FDG-PET showed higher detection rate than each method alone in MRI-negative focal cortical dysplasia (149–151). (3) Combined morphometric analysis program with quantitative PET increased the specificity of EZ localization coupled with the preferable surgical outcome in MRI-negative patients (152). (4) Automatic fusion by Gaussian mixture model of results from FDG-PET, ASL, diffusion-weighted imaging (DWI), STATISCOM, and ESI with high-density scalp EEG (HDEEG) showed highly accurate seizure onset zone localization in patients with MRI-negative drug-resistant epilepsy (153). Combined FDG-PET and magnetoencephalography (MEG) improved the concordance of EZ localization with surgical resection in patients with drug-resistant epilepsy (154). Poorer post-surgical prognosis showed an association of PET hypometabolism extension beyond SEEG sampling in patients with malformations of cortical development (155).
A hybrid PET/MR system was recently developed. The system integrates two neuroimaging modalities within one machine allowing synchronous and simultaneous acquisition of anatomical and molecular data. It provided high sensitivity for EZ localization in patients with drug-resistant epilepsy (156–158), which was significantly higher than that of FDG-PET/CT and standalone MRI for EZ localization (159). Combined FDG-PET and ASL from hybrid PET/MR showed high sensitivity, high specificity, and good concordance with histopathology in patients with MRI-negative TLE (160). The technique also significantly increased specificity and PPV in pediatric patients with epilepsy (161). The system could be used for SEEG implantation guidance, and concordance between FDG-PET/MRI and SEEG findings was significantly predictive of a successful surgery outcome (162). Hybrid PET with functional MRI (fMRI) could generate oxygen–glucose index imaging to define the asymmetry for EZ lateralization and localization in patients with TLE (163). The combined fractional amplitude of low-frequency fluctuations (fALFFs) from resting-state fMRI and glucose metabolism from a hybrid PET/MRI system showed higher fALFF/SUVr couplings found in patients who had Engel class IA after surgery than in all other Engel IB-IV (164). Hybrid PET/MR changed surgical decision-making compared with 18F-FDG-PET coregistered with MRI by increasing epileptogenic lesion detection, especially focal cortical dysplasia (165, 166). A concordance analysis method from FDG-PET/MRI could separate operable or implantable from inoperable in drug-resistant epilepsy patients with discordant clinical and diagnostic results or negative-MRI results (167). The overall methods and software for the localization of EZ and prediction of surgical outcomes in the field of PET and SPECT are shown in Figure 3, Table 2.
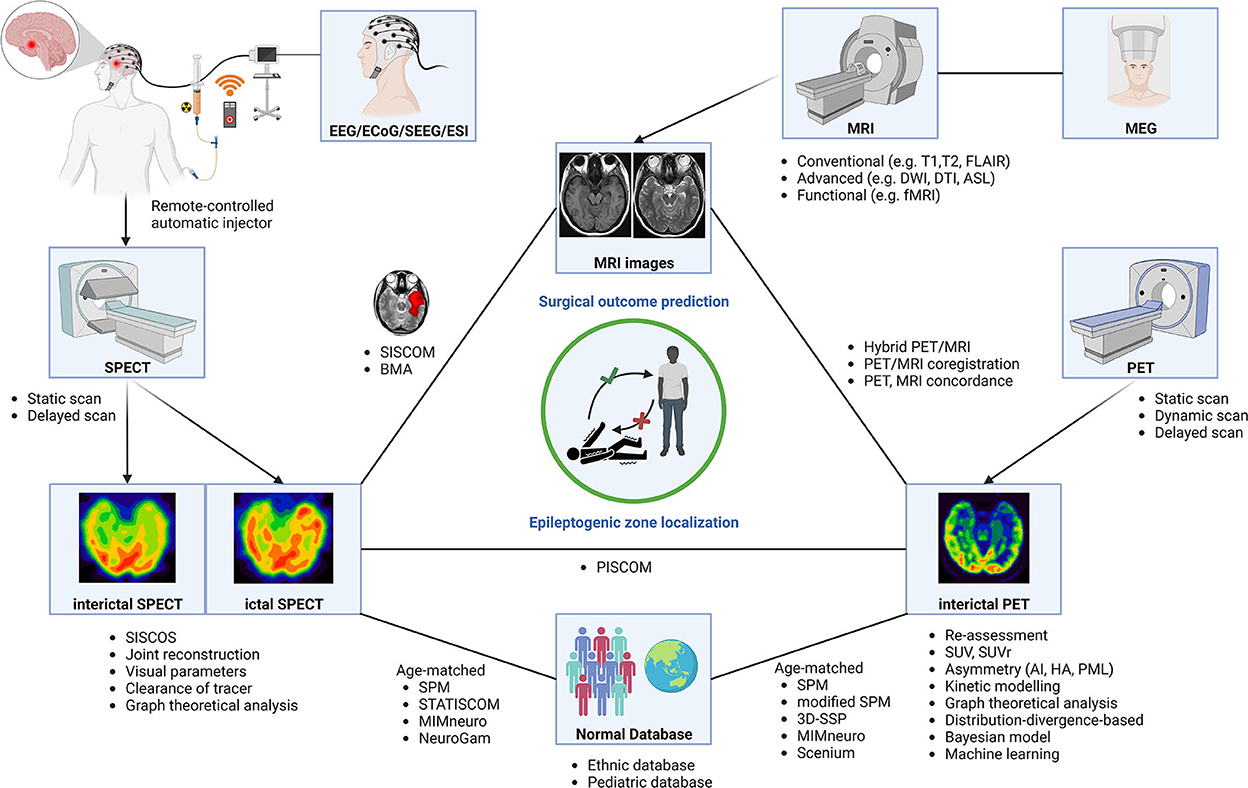
Figure 3. Neuroimaging modalities using various methods and software for epileptogenic zone localization and surgical outcome prediction. AI, asymmetry index; BMA, Bayesian modeling average; DTI, diffusion tensor imaging; DWI, diffusion-weighted imaging; ECoG, electrocorticography; EEG, electroencephalogram; ESI, EEG source image; ETE, extratemporal lobe epilepsy; fMRI, functional MRI; HA, hypometabolism asymmetry; MEG, magnetoencephalography; MRI, magnetic resonance imaging; PET, positron emission tomography; PML, percentage metabolism loss; SEEG, stereotactic EEG; SISCOS, subtraction ictal SPECT coregistered to interictal SPECT; SISCOM, subtraction ictal SPECT coregistered to MRI; SPECT, single-photon emission computed tomography; SPM, statistical parametric mapping; STATISCOM, statistical ictal SPECT coregistered to MRI; SUV, standard uptake value; SUVr, SUV ratio; 3D-SSP, three-dimensional stereotactic surface projection.
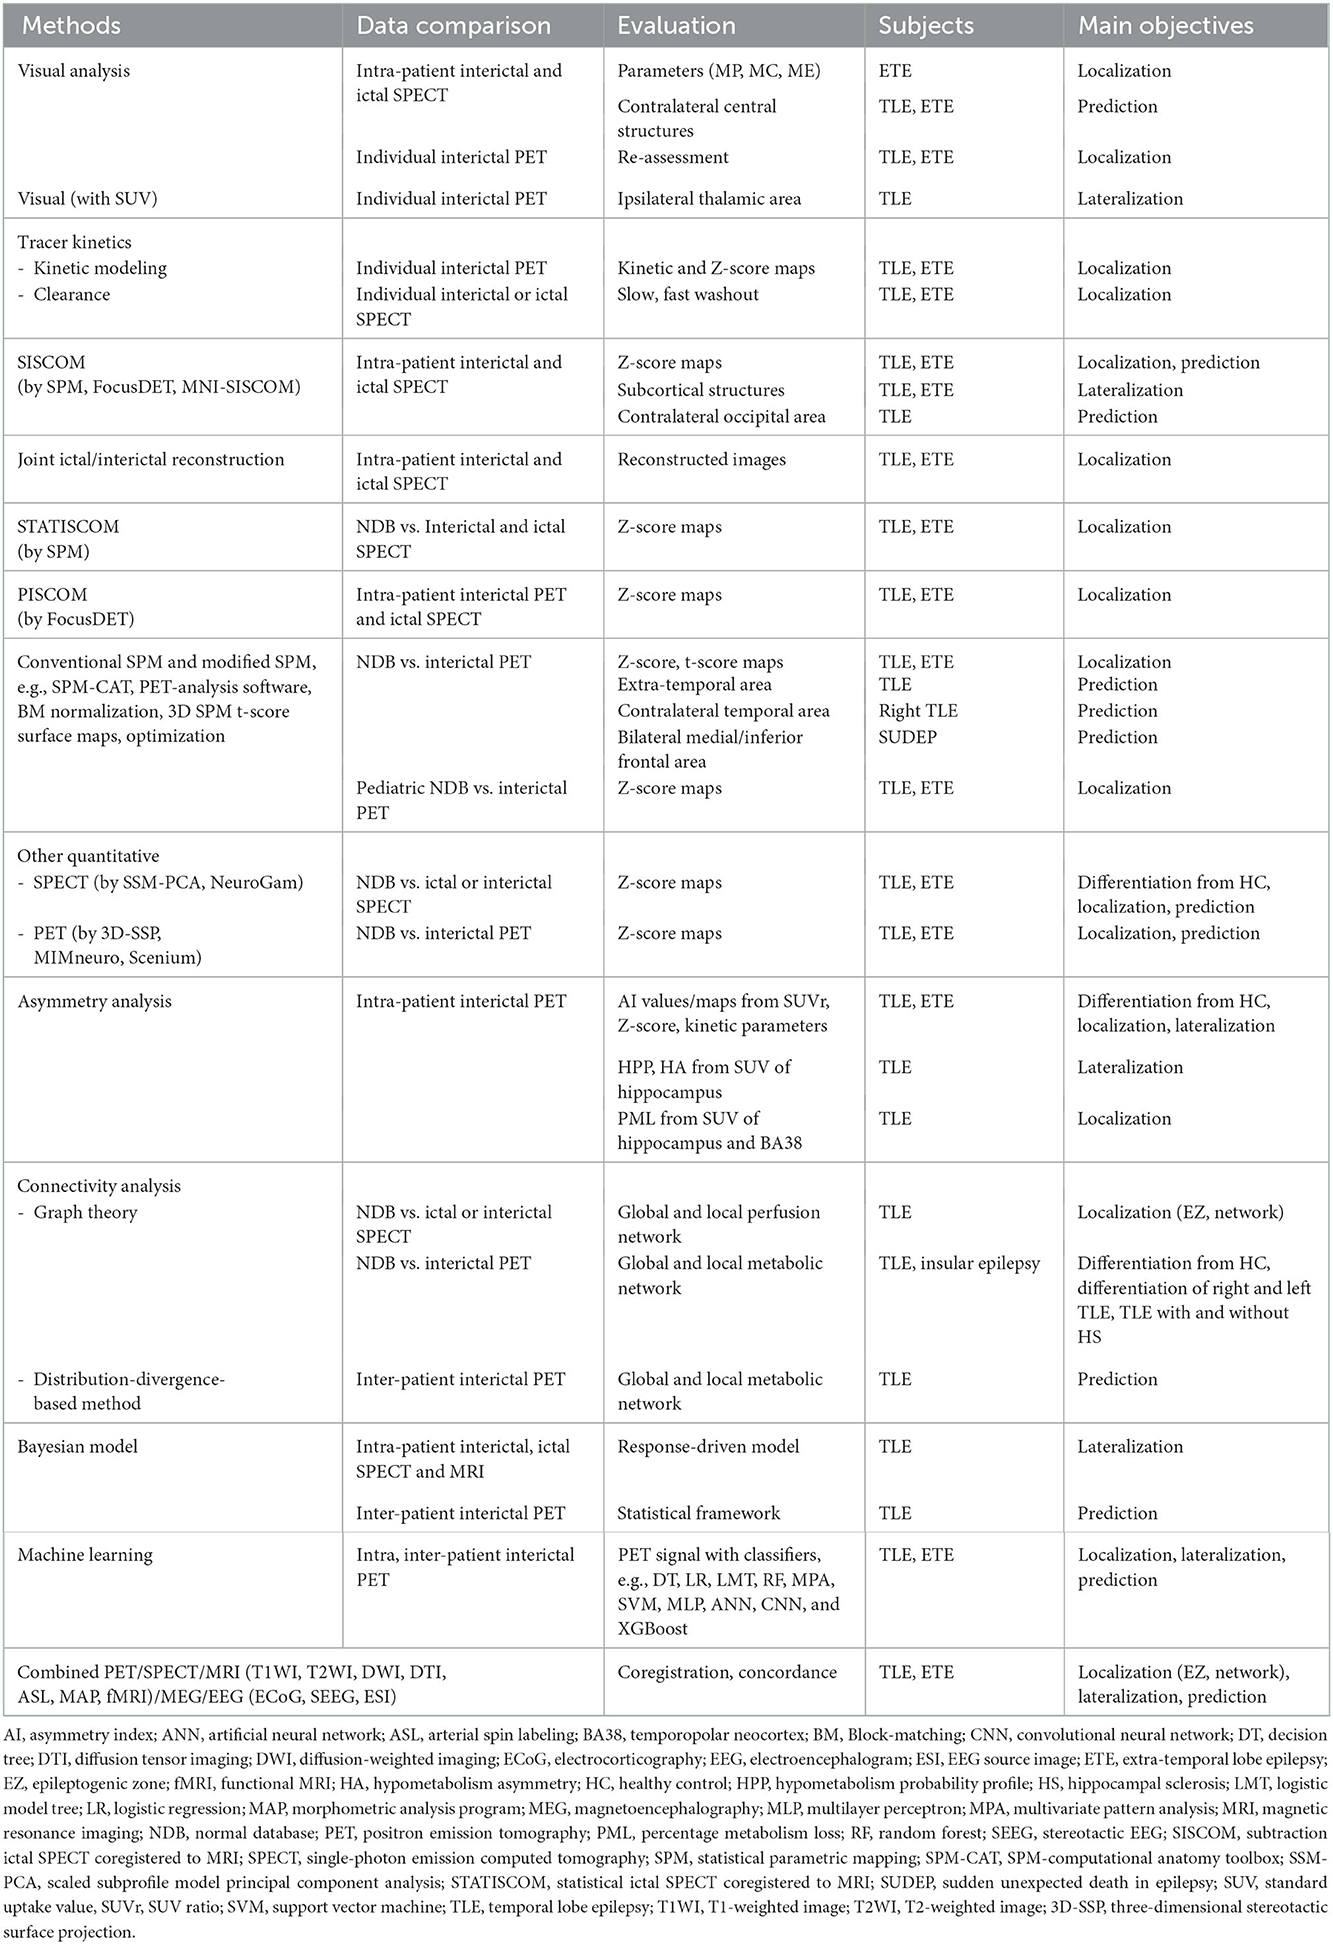
Table 2. Overall methods and software for EZ localization and surgical outcome prediction.
Conclusion
In the recent decade, research in the epilepsy field is still ongoing. The main aims were not only for better delineation of EZ but also for a better understanding of the disease. Collaborations between multidisciplinary teams and a combination of multiple neuroimaging modalities are keys for good EZ localization. Concordant results among each imaging modality usually predict good surgical outcomes. There have been newly emerging radiopharmaceuticals development and increasing indications for their usage. Specific radiopharmaceuticals are still in need of more specific delineation of epileptogenic focus, not only generally, but also for specific epileptic syndromes. Many simple and sophisticated techniques to aid in better EZ identification or revealing the epileptogenic network were implemented. Although many sophisticated techniques have been used as tools to identify epileptic networks, more research is still needed to confirm the usage of these tools in clinical settings. The trend is moving toward the theory of an epileptic network rather than a single epileptogenic focus, which underlies surgically refractory epilepsy. A hybrid PET/MR scanner might avoid multiple scanning sessions and improve the workflow in pre-surgical evaluation. Furthermore, automatic software or more user-friendly programs may ease routine clinical usage. All these developments will potentially result in a rising standard for epilepsy care in the future.
Data availability statement
The raw data supporting the conclusions of this article will be made available by the authors, without undue reservation.
Author contributions
CS: wrote the original draft, designed, and created Figures 1–3. ST: reviewed and edited the original draft manuscript and the selection process. CS and ST: conceptualization, performed independently the literature search and data extraction, compared their final report selection, and reviewed the final manuscript. All authors contributed to the article and approved the submitted version.
Acknowledgments
Figures 1, 3 were created with BioRender.com. Figure 2 was adapted from “Glutamate Synthesis and Cycling”, by BioRender.com (2022). Retrieved from https://app.biorender.com/biorender-templates.
Conflict of interest
The authors declare that the research was conducted in the absence of any commercial or financial relationships that could be construed as a potential conflict of interest.
Publisher's note
All claims expressed in this article are solely those of the authors and do not necessarily represent those of their affiliated organizations, or those of the publisher, the editors and the reviewers. Any product that may be evaluated in this article, or claim that may be made by its manufacturer, is not guaranteed or endorsed by the publisher.
References
1. Kalilani L, Sun X, Pelgrims B, Noack-Rink M, Villanueva V. The epidemiology of drug-resistant epilepsy: a systematic review and meta-analysis. Epilepsia. (2018) 59:2179–93. doi: 10.1111/epi.14596
2. Luders HO, Najm I, Nair D, Widdess-Walsh P, Bingman W. The epileptogenic zone: general principles. Epileptic Disorders Int Epilepsy J Videotape. (2006) 8:S1–9.
3. Kaewchur T, Chamroonrat W, Thientunyakit T, Khiewvan B, Wongsurawat N, Chotipanich C, et al. Thai national guideline for nuclear medicine investigations in epilepsy. Asia Ocean J Nucl Med Biol. (2021) 9:188–206. doi: 10.22038/AOJNMB.2021.54567.1379
4. Chugani HT, Luat AF, Kumar A, Govindan R, Pawlik K, Asano E. A-[11c]-Methyl-L-tryptophan—pet in 191 patients with tuberous sclerosis complex. Neurology. (2013) 81:674–80. doi: 10.1212/WNL.0b013e3182a08f3f
5. Rubí S, Costes N, Heckemann RA, Bouvard S, Hammers A, Martí Fuster B, et al. Positron Emission Tomography with A-[11c]Methyl-L-Tryptophan in Tuberous Sclerosis Complex-Related Epilepsy. Epilepsia. (2013) 54:2143–50. doi: 10.1111/epi.12412
6. Bagla S, Cukovic D, Asano E, Sood S, Luat A, Chugani HT, et al. A distinct microrna expression profile is associated with A [(11)C]-Methyl-L-Tryptophan (Amt) pet uptake in epileptogenic cortical tubers resected from patients with tuberous sclerosis complex. Neurobiol Dis. (2018) 109:76–87. doi: 10.1016/j.nbd.2017.10.004
7. Theodore WH, Martinez AR, Khan OI, Liew CJ, Auh S, Dustin IM, et al. Pet of serotonin 1a receptors and cerebral glucose metabolism for temporal lobectomy. J Nucl Med. (2012) 53:1375–82. doi: 10.2967/jnumed.112.103093
8. Komoto D, Iida K, Higaki T, Kaichi Y, Takauchi K, Arihiro K, et al. Diagnostic performance of positron emission tomography for the presurgical evaluation of patients with non-lesional intractable partial epilepsy: comparison among 18f-Fdg, 11c-Flumazenil, and 11c-Flumazenil binding potential imaging using statistical imaging analysis. Hiroshima J Med Sci. (2015) 64:51–7.
9. Nugent AC, Martinez A, D'Alfonso A, Zarate CA, Theodore WH. The relationship between glucose metabolism, resting-state fmri bold signal, and gabaa-binding potential: a preliminary study in healthy subjects and those with temporal lobe epilepsy. J Cerebral Blood Flow Metabol Official J Int Soc Cerebral Blood Flow Metabol. (2015) 35:583–91. doi: 10.1038/jcbfm.2014.228
10. Yankam Njiwa J, Bouvard S, Catenoix H, Mauguiere F, Ryvlin P, Hammers A. Periventricular [(11)C]Flumazenil binding for predicting post-operative outcome in individual patients with temporal lobe epilepsy and hippocampal sclerosis. NeuroImage Clinical. (2013) 3:242–8. doi: 10.1016/j.nicl.2013.07.008
11. Yankam Njiwa J, Gray KR, Costes N, Mauguiere F, Ryvlin P, Hammers A. Advanced [(18)F]Fdg and [(11)C]Flumazenil pet analysis for individual outcome prediction after temporal lobe epilepsy surgery for hippocampal sclerosis. NeuroImage Clinical. (2015) 7:122–31. doi: 10.1016/j.nicl.2014.11.013
12. Niu N, Xing H, Wu M, Ma Y, Liu Y, Ba J, et al. Performance of pet imaging for the localization of epileptogenic zone in patients with epilepsy: a meta-analysis. Eur Radiol. (2021) 31:6353–66. doi: 10.1007/s00330-020-07645-4
13. Vivash L, Gregoire MC, Lau EW, Ware RE, Binns D, Roselt P, et al. 18f-Flumazenil: A Γ-aminobutyric acid a-specific pet radiotracer for the localization of drug-resistant temporal lobe epilepsy. J Nucl Med. (2013) 54:1270–7. doi: 10.2967/jnumed.112.107359
14. Avendaño-Estrada A, Velasco F, Velasco AL, Cuellar-Herrera M, Saucedo-Alvarado PE, Marquez-Franco R, et al. Quantitative analysis of [18f]Ffmz and [18f]FDG-PET studies in the localization of seizure onset zone in drug-resistant temporal lobe epilepsy. Stereotact Funct Neurosurg. (2019) 97:232–40. doi: 10.1159/000503692
15. Kato H, Matsuda K, Baba K, Shimosegawa E, Isohashi K, Imaizumi M, et al. Mr imaging-based correction for partial volume effect improves detectability of intractable epileptogenic foci on iodine 123 iomazenil brain spect images: an extended study with a larger sample size. AJNR Am J Neuroradiol. (2012) 33:2088–94. doi: 10.3174/ajnr.A3121
16. Hosomi K, Kishima H, Oshino S, Hirata M, Tani N, Maruo T, et al. Altered extrafocal iomazenil activity in mesial temporal lobe epilepsy. Epilepsy Res. (2013) 103:195–204. doi: 10.1016/j.eplepsyres.2012.07.001
17. Shiga T, Suzuki A, Sakurai K, Kurita T, Takeuchi W, Toyonaga T, et al. Dual isotope spect study with epilepsy patients using semiconductor spect system. Clin Nucl Med. (2017) 42:663–8. doi: 10.1097/RLU.0000000000001732
18. Fujitani S, Matsuda K, Nakamura F, Baba K, Usui N, Tottori T, et al. Statistical parametric mapping of interictal 123i-iomazenil spect in temporal lobe epilepsy surgery. Epilepsy Res. (2013) 106:173–80. doi: 10.1016/j.eplepsyres.2013.03.008
19. McGinnity CJ, Riaño Barros DA, Hinz R, Myers JF, Yaakub SN, Thyssen C, et al. Alpha 5 Subunit-containing gaba(a) receptors in temporal lobe epilepsy with normal mri. Brain Commun. (2021) 3:fcaa190. doi: 10.1093/braincomms/fcaa190
20. McGinnity CJ, Koepp MJ, Hammers A, Riaño Barros DA, Pressler RM, Luthra S, et al. Nmda receptor binding in focal epilepsies. J Neurol Neurosurg Psychiatry. (2015) 86:1150–7. doi: 10.1136/jnnp-2014-309897
21. Vibholm AK, Dietz MJ, Beniczky S, Christensen J, Højlund A, Jacobsen J, et al. Activated N-Methyl-D-Aspartate receptor ion channels detected in focal epilepsy with [(18) F]Ge-179 positron emission tomography. Epilepsia. (2021) 62:2899–908. doi: 10.1111/epi.17074
22. Miyazaki T, Nakajima W, Hatano M, Shibata Y, Kuroki Y, Arisawa T, et al. Visualization of ampa receptors in living human brain with positron emission tomography. Nat Med. (2020) 26:281–8. doi: 10.1038/s41591-019-0723-9
23. Miyazaki T, Takayama Y, Iwasaki M, Hatano M, Nakajima W, Ikegaya N, et al. Epileptic discharges initiate from brain areas with elevated accumulation of A-Amino-3-Hydroxy-5-Methyl-4-Isoxazole propionic acid receptors. Brain Commun. (2022) 4:fcac023. doi: 10.1093/braincomms/fcac023
24. DuBois JM, Rousset OG, Guiot MC, Hall JA, Reader AJ, Soucy JP, et al. Metabotropic glutamate receptor type 5 (Mglur5) cortical abnormalities in focal cortical dysplasia identified in vivo with [11c]Abp688 positron-emission tomography (Pet) imaging. Cerebral Cortex. (2016) 26:4170–9. doi: 10.1093/cercor/bhw249
25. DuBois JM, Mathotaarachchi S, Rousset OG, Sziklas V, Sepulcre J, Guiot MC, et al. Large-scale mglur5 network abnormalities linked to epilepsy duration in focal cortical dysplasia. NeuroImage Clin. (2021) 29:102552. doi: 10.1016/j.nicl.2020.102552
26. Lam J, DuBois JM, Rowley J, González-Otárula KA, Soucy JP, Massarweh G, et al. In vivo metabotropic glutamate receptor type 5 abnormalities localize the epileptogenic zone in mesial temporal lobe epilepsy. Ann Neurol. (2019) 85:218–28. doi: 10.1002/ana.25404
27. Lam J, DuBois JM, Rowley J, Rousset OG, González-Otárula KA, Soucy JP, et al. In vivo hippocampal cornu ammonis 1–3 glutamatergic abnormalities are associated with temporal lobe epilepsy surgery outcomes. Epilepsia. (2021) 62:1559–68. doi: 10.1111/epi.16952
28. Bernedo Paredes VE, Buchholz HG, Gartenschläger M, Breimhorst M, Schreckenberger M, Werhahn KJ. Reduced D2/D3 receptor binding of extrastriatal and striatal regions in temporal lobe epilepsy. PLoS ONE. (2015) 10:e0141098. doi: 10.1371/journal.pone.0141098
29. Garibotto V, Corpataux T, Dupuis-Lozeron E, Haller S, Fontolliet T, Picard F. Higher nicotinic receptor availability in the cingulo-insular network is associated with lower cardiac parasympathetic tone. J Comp Neurol. (2019) 527:3014–22. doi: 10.1002/cne.24726
30. Garibotto V, Wissmeyer M, Giavri Z, Goldstein R, Seimbille Y, Seeck M, et al. Nicotinic receptor abnormalities as a biomarker in idiopathic generalized epilepsy. Eur J Nucl Med Mol Imaging. (2019) 46:385–95. doi: 10.1007/s00259-018-4175-0
31. McGinnity CJ, Shidahara M, Feldmann M, Keihaninejad S, Riaño Barros DA, Gousias IS, et al. Quantification of opioid receptor availability following spontaneous epileptic seizures: correction of [11c]Diprenorphine pet data for the partial-volume effect. Neuroimage. (2013) 79:72–80. doi: 10.1016/j.neuroimage.2013.04.015
32. Finnema SJ, Nabulsi NB, Eid T, Detyniecki K, Lin SF, Chen MK, et al. Imaging synaptic density in the living human brain. Science Translat. Med. (2016) 8:348ra96. doi: 10.1126/scitranslmed.aaf6667
33. Finnema SJ, Toyonaga T, Detyniecki K, Chen MK, Dias M, Wang Q, et al. Reduced synaptic vesicle protein 2a binding in temporal lobe epilepsy: a [(11) C]Ucb-J positron emission tomography study. Epilepsia. (2020) 61:2183–93. doi: 10.1111/epi.16653
34. Tang Y, Yu J, Zhou M, Li J, Long T, Li Y, et al. Cortical abnormalities of synaptic vesicle protein 2a in focal cortical dysplasia type ii identified in vivo with (18)F-Synvest-1 positron emission tomography imaging. Eur J Nucl Med Mol Imaging. (2022). doi: 10.1007/s00259-021-05665-w
35. Bauer M, Karch R, Zeitlinger M, Liu J, Koepp MJ, Asselin MC, et al. In vivo P-Glycoprotein function before and after epilepsy surgery. Neurology. (2014) 83:1326–31. doi: 10.1212/WNL.0000000000000858
36. Shin JW, Chu K, Shin SA, Jung KH, Lee ST, Lee YS, et al. Clinical applications of simultaneous Pet/Mr imaging using (R)-[11c]-verapamil with cyclosporin a: preliminary results on a surrogate marker of drug-resistant epilepsy. AJNR Am J Neuroradiol. (2016) 37:600–6. doi: 10.3174/ajnr.A4566
37. Ilyas-Feldmann M, Asselin MC, Wang S, McMahon A, Anton-Rodriguez J, Brown G, et al. P-Glycoprotein overactivity in epileptogenic developmental lesions measured in vivo using (R)-[(11) C]Verapamil pet. Epilepsia. (2020) 61:1472–80. doi: 10.1111/epi.16581
38. Mansor S, Boellaard R, Froklage FE, Bakker ED, Yaqub M, Voskuyl RA, et al. Quantification of dynamic 11c-phenytoin pet studies. J Nucl Med. (2015) 56:1372–7. doi: 10.2967/jnumed.115.158055
39. Butler T, Li Y, Tsui W, Friedman D, Maoz A, Wang X, et al. Transient and chronic seizure-induced inflammation in human focal epilepsy. Epilepsia. (2016) 57:e191–4. doi: 10.1111/epi.13457
40. Kagitani-Shimono K, Kato H, Kuwayama R, Tominaga K, Nabatame S, Kishima H, et al. Clinical evaluation of neuroinflammation in child-onset focal epilepsy: a translocator protein pet study. J Neuroinflammation. (2021) 18:8. doi: 10.1186/s12974-020-02055-1
41. Gershen LD, Zanotti-Fregonara P, Dustin IH, Liow JS, Hirvonen J, Kreisl WC, et al. Neuroinflammation in temporal lobe epilepsy measured using positron emission tomographic imaging of translocator protein. JAMA Neurol. (2015) 72:882–8. doi: 10.1001/jamaneurol.2015.0941
42. Dickstein LP, Liow JS, Austermuehle A, Zoghbi S, Inati SK, Zaghloul K, et al. Neuroinflammation in neocortical epilepsy measured by pet imaging of translocator protein. Epilepsia. (2019) 60:1248–54. doi: 10.1111/epi.15967
43. Rheims S, Rubi S, Bouvard S, Bernard E, Streichenberger N, Guenot M, et al. Accuracy of distinguishing between dysembryoplastic neuroepithelial tumors and other epileptogenic brain neoplasms with [11c]Methionine Pet. Neuro Oncol. (2014) 16:1417–26. doi: 10.1093/neuonc/nou022
44. Sone D, Ito K, Taniguchi G, Murata Y, Nakata Y, Watanabe Y, et al. Evaluation of amygdala pathology using (11)C-methionine positron emission tomography/computed tomography in patients with temporal lobe epilepsy and amygdala enlargement. Epilepsy Res. (2015) 112:114–21. doi: 10.1016/j.eplepsyres.2015.02.018
45. Chen YF, Wei R, Yuan GQ, Gao DD, Jin Q, Cui XY, et al. A new role of (11) C-choline pet in localizing the epileptogenic foci in insular cortex in the patients. CNS Neurosci Ther. (2020) 26:144–7. doi: 10.1111/cns.13215
46. Kumar A, Chugani HT. The role of radionuclide imaging in epilepsy, part 1: sporadic temporal and extratemporal lobe epilepsy. J Nucl Med. (2013) 54:1775–81. doi: 10.2967/jnumed.112.114397
47. Ramchuankiat S, Jarumaneeroj P, Limotai C, Tepmongkol S, Rakvongthai Y. Impact of injection time on migration of spect seizure onset in temporal lobe epilepsy. Annu Int Conf IEEE Eng Med Biol Soc. (2017) 2017:1465–8. doi: 10.1109/EMBC.2017.8037111
48. Kim S, Holder DL, Laymon CM, Tudorascu DL, Deeb EL, Panigrahy A, et al. Clinical value of the first dedicated, commercially available automatic injector for Ictal brain spect in presurgical evaluation of pediatric epilepsy: comparison with manual injection. J Nucl Med. (2013) 54:732–8. doi: 10.2967/jnumed.112.105189
49. Crawford A, Conners SM, Czachowski M, Muthukrishnan A. Remote-controlled automatic injection vs. manual injection in Ictal spect of seizure patients: experience from a children's hospital. J Nucl Med Technol. (2014) 42:161–2. doi: 10.2967/jnmt.114.145854
50. Setoain X, Campos F, Donaire A, Mayoral M, Perissinotti A, Niñerola-Baizan A, et al. How to inject Ictal spect? From manual to automated injection. Epilepsy Res. (2021) 175:106691. doi: 10.1016/j.eplepsyres.2021.106691
51. Yassin A, Al-Mistarehi AH, El-Salem K, Urban A, Plummer C, Mohammadi S, et al. Effect of automatic injectors on the injection latency, safety, and seizure onset zone localization of Ictal single photon emission computed tomography studies in adult epilepsy monitoring unit. Epilepsy Res. (2021) 169:106522. doi: 10.1016/j.eplepsyres.2020.106522
52. Doshi R, Sankar AR, Nagaraj K, Vazhayil V, Nagaraj C, Rao M. Eeg driven autonomous injection system for an epileptic neuroimaging application. Annu Int Conf IEEE Eng Med Biol Soc. (2021) 2021:1480–6. doi: 10.1109/EMBC46164.2021.9629573
53. Tepmongkol S, Tangtrairattanakul K, Lerdlum S, Desudchit T. Comparison of brain perfusion spect parameters accuracy for seizure localization in extratemporal lobe epilepsy with discordant pre-surgical data. Ann Nucl Med. (2015) 29:21–8. doi: 10.1007/s12149-014-0905-y
54. Haemels M, Van Weehaeghe D, Cleeren E, Dupont P, van Loon J, Theys T, et al. Predictive value of metabolic and perfusion changes outside the seizure onset zone for post-operative outcome in patients with refractory focal epilepsy. Acta Neurol Belg. (2022) 122:325–35. doi: 10.1007/s13760-020-01569-y
55. Newey CR, Wong C, Wang ZI, Chen X, Wu G, Alexopoulos AV. Optimizing spect siscom analysis to localize seizure-onset zone by using varying Z scores. Epilepsia. (2013) 54:793–800. doi: 10.1111/epi.12139
56. De Coster L, Van Laere K, Cleeren E, Baete K, Dupont P, Van Paesschen W, et al. On the optimal Z-score threshold for siscom analysis to localize the Ictal onset zone. EJNMMI Res. (2018) 8:34. doi: 10.1186/s13550-018-0381-9
57. Perissinotti A, Setoain X, Aparicio J, Rubí S, Fuster BM, Donaire A, et al. Clinical role of subtraction Ictal spect coregistered to Mr imaging and (18)F-Fdg pet in pediatric epilepsy. J Nucl Med. (2014) 55:1099–105. doi: 10.2967/jnumed.113.136432
58. Oliveira Young C, Etchbehere E, Souza EM, Brunetto SQ, Santos AO, Lima MCL, et al. Clinical usefulness of siscom-spm compared to visual analysis to locate the epileptogenic zone. Front Neurol. (2020) 11:467. doi: 10.3389/fneur.2020.00467
59. Foiadelli T, Lagae L, Goffin K, Theys T, De Amici M, Sacchi L, et al. Subtraction Ictal spect coregistered to mri (siscom) as a guide in localizing childhood epilepsy. Epilepsia open. (2020) 5:61–72. doi: 10.1002/epi4.12373
60. Aupy J, Wongwiangjunt S, Wang ZI, Wu G, Alexopoulos A. Subcortical siscom hyperperfusion: should we pay more attention to it? Seizure. (2018) 62:43–8. doi: 10.1016/j.seizure.2018.09.017
61. Batista García-Ramó K, Sanchez Catasus CA, Morales Chacón L, Aguila Ruiz A, Sánchez Corneaux A, Rojas López P, et al. A novel noninvasive approach based on spect and eeg for the location of the epileptogenic zone in pharmacoresistant non-lesional epilepsy. Medicina. (2019) 55:478. doi: 10.3390/medicina55080478
62. Chen T, Guo L. The role of siscom in preoperative evaluation for patients with epilepsy surgery: a meta-analysis. Seizure. (2016) 41:43–50. doi: 10.1016/j.seizure.2016.06.024
63. Jalota A, Rossi MA, Pylypyuk V, Stein M, Stoub T, Balabanov A, et al. Resecting critical nodes from an epileptogenic circuit in refractory focal-onset epilepsy patients using subtraction Ictal spect coregistered to mri. J Neurosurg. (2016) 125:1565–76. doi: 10.3171/2015.6.JNS141719
64. Hwang Y, Lee HR, Jo H, Kim D, Joo EY, Seo DW, et al. Regional Ictal hyperperfusion in the contralateral occipital area may be a poor prognostic marker of anterior temporal lobectomy: a siscom analysis of mtle cases. Neuropsychiatr Dis Treat. (2021) 17:2421–7. doi: 10.2147/NDT.S317915
65. Aungaroon G, Trout AT, Radhakrishnan R, Horn PS, Arya R, Tenney JR, et al. Subtraction Ictal spect co-registered to mri (siscom) patterns in children with temporal lobe epilepsy. Epilepsy Behav. (2021) 121:108074. doi: 10.1016/j.yebeh.2021.108074
66. Onwanna J, Chantadisai M, Tepmongkol S, Fahey F, Ouyang J, Rakvongthai Y. Impact of reconstruction parameters on lesion detection and localization in joint Ictal /inter- Ictal spect reconstruction. Ann Nucl Med. (2022) 36:24–32. doi: 10.1007/s12149-021-01680-x
67. Rakvongthai Y, Fahey F, Borvorntanajanya K, Tepmongkol S, Vutrapongwatana U, Zukotynski K, et al. Joint reconstruction of Ictal /inter- Ictal spect data for improved epileptic foci localization. Med Phys. (2017) 44:1437–44. doi: 10.1002/mp.12167
68. Sukprakun C, Limotai C, Khamwan K, Pasawang P, Tepmongkol S, A. Novel method of seizure onset zone localization by serial Tc-99 m Ecd brain perfusion spect clearance patterns. Brain Imaging Behav. (2022). doi: 10.21203/rs.3.rs-672209/v1
69. Taherpour J, Jaber M, Voges B, Apostolova I, Sauvigny T, House PM, et al. Predicting the outcome of epilepsy surgery by covariance pattern analysis of Ictal perfusion spect. J Nucl Med. (2022) 63:925–30. doi: 10.2967/jnumed.121.262702
70. Sulc V, Stykel S, Hanson DP, Brinkmann BH, Jones DT, Holmes DR 3rd, et al. Statistical spect processing in mri-negative epilepsy surgery. Neurology. (2014) 82:932–9. doi: 10.1212/WNL.0000000000000209
71. Hlauschek G, Sinclair B, Brinkmann B, Fuge J, Kwan P, O'Brien TJ, et al. The effect of injection time on rates of epileptogenic zone localization using siscom and statiscom. Epilepsy Behav E&B. (2021) 118:107945. doi: 10.1016/j.yebeh.2021.107945
72. Martí Fuster B, Esteban O, Planes X, Aguiar P, Crespo C, Falcon C, et al. Focusdet, a new toolbox for siscom analysis. Evaluat Registrat Accuracy Using Monte Carlo Simulat Neuroinform. (2013) 11:77–89. doi: 10.1007/s12021-012-9158-x
73. Moreau JT, Saint-Martin C, Baillet S, Dudley RWR. Mni Siscom: an open-source tool for computing subtraction Ictal single-photon emission Ct coregistered to Mri. J Digit Imag. (2021) 34:357–61. doi: 10.1007/s10278-021-00422-9
74. Long Z, Hanson DP, Mullan BP, Hunt CH, Holmes DR 3rd, Brinkmann BH, et al. Analysis of brain spect images coregistered with mri in patients with epilepsy: comparison of three methods. J Neuroimag Official J Am Soc Neuroimag. (2018) 28:307–12. doi: 10.1111/jon.12496
75. Fu P, Wei L, Zhang F, Gao J, Jing J, Wu W, et al. Added value of neurogam software analysis in single photon emission computed tomography localization diagnosis of epilepsy in interictal stage. Med Sci Monit Int Med J Exp Clin Res. (2018) 24:1494–501. doi: 10.12659/MSM.908437
76. Fu P, Zhang F, Gao J, Jing J, Pan L, Li D, et al. Neurogam software analysis in epilepsy diagnosis using 99mtc-Ecd brain perfusion spect imaging. Med Sci Monit Int Med J Exp Clin Res. (2015) 21:2801–8. doi: 10.12659/MSM.894566
77. Jaraba S, Reynés-Llompart G, Sala-Padró J, Veciana M, Miró J, Pedro J, et al. Usefulness of hmpao-spect in the diagnosis of nonconvulsive status epilepticus. Epilepsy Behav. (2019) 101:106544. doi: 10.1016/j.yebeh.2019.106544
78. Barrio JR, Huang SC, Satyamurthy N, Scafoglio CS Yu AS, Alavi A, et al. Does 2-Fdg Pet accurately reflect quantitative in vivo glucose utilization? J Nucl Med. (2020) 61:931–7. doi: 10.2967/jnumed.119.237446
79. Mayoral M, Marti-Fuster B, Carreño M, Carrasco JL, Bargalló N, Donaire A, et al. Seizure-onset zone localization by statistical parametric mapping in visually normal (18) F-Fdg Pet studies. Epilepsia. (2016) 57:1236–44. doi: 10.1111/epi.13427
80. Mendes Coelho VC, Morita ME, Amorim BJ, Ramos CD, Yasuda CL, Tedeschi H, et al. Automated online quantification method for (18)F-Fdg positron emission tomography/Ct improves detection of the epileptogenic zone in patients with pharmacoresistant epilepsy. Front Neurol. (2017) 8:453. doi: 10.3389/fneur.2017.00453
81. Debets RM, Comans EF, Bouvard S, et al. Can we increase the yield of Fdg-Pet in the preoperative work-up for epilepsy surgery? Epilepsy Res. (2014) 108:1095–105. doi: 10.1016/j.eplepsyres.2014.04.011
82. Jain A, Struck AF, Woo KM, Jaskowiak CJ, Hall LT. Thalamic and basal ganglia metabolism on interictal (18)F-Fdg Pet in temporal lobe epilepsy: an suv-based analysis. Am J Nucl Med Mol Imag. (2018) 8:41–9.
83. Peter J, Houshmand S, Werner TJ, Rubello D, Alavi A. Novel assessment of global metabolism by 18f-Fdg-Pet for localizing affected lobe in temporal lobe epilepsy. Nucl Med Commun. (2016) 37:882–7. doi: 10.1097/MNM.0000000000000526
84. Hu WH, Liu LN, Zhao BT, Wang X, Zhang C, Shao XQ, et al. Use of an automated quantitative analysis of hippocampal volume, signal, and glucose metabolism to detect hippocampal sclerosis. Front Neurol. (2018) 9:820. doi: 10.3389/fneur.2018.00820
85. Tang Y, Liao G, Li J, Long T, Li Y, Feng L, et al. Fdg-Pet profiles of extratemporal metabolism as a predictor of surgical failure in temporal lobe epilepsy. Front Med. (2020) 7:605002. doi: 10.3389/fmed.2020.605002
86. Kojan M, DoleŽalová I, Koritáková E, Mareček R, Rehák Z, Hermanová M, et al. Predictive value of preoperative statistical parametric mapping of regional glucose metabolism in mesial temporal lobe epilepsy with hippocampal sclerosis. Epilepsy Behav. (2018) 79:46–52. doi: 10.1016/j.yebeh.2017.11.014
87. Takahashi M, Soma T, Kawai K, Koyama K, Ohtomo K, Momose T. Voxel-based comparison of preoperative fdg-pet between mesial temporal lobe epilepsy patients with and without post-operative seizure-free outcomes. Ann Nucl Med. (2012) 26:698–706. doi: 10.1007/s12149-012-0629-9
88. Cahill V, Sinclair B, Malpas CB, McIntosh AM, Chen Z, Vivash LE, et al. Metabolic patterns and seizure outcomes following anterior temporal lobectomy. Ann Neurol. (2019) 85:241–50. doi: 10.1002/ana.25405
89. Kumar A, Alhourani H, Abdelkader A, Shah AK, Juhász C, Basha MM. Frontal Lobe hypometabolism associated with sudden unexpected death in epilepsy (Sudep) risk: an objective pet study. Epilepsy Behav. (2021) 122:108185. doi: 10.1016/j.yebeh.2021.108185
90. Mayoral M, Niñerola-Baizán A, Marti-Fuster B, Donaire A, Perissinotti A, Rumià J, et al. Epileptogenic zone localization with (18)FDG-PET using a new dynamic parametric analysis. Front Neurol. (2019) 10:380. doi: 10.3389/fneur.2019.00380
91. Bacon EJ, Jin C, He D, Hu S, Wang L, Li H, et al. Epileptogenic zone localization in refractory epilepsy by Fdg-Pet: the comparison of spm and spm-cat with different parameter settings. Front Neurol. (2021) 12:724680. doi: 10.3389/fneur.2021.724680
92. Verger A, Yagdigul Y, Van Der Gucht A, Poussier S, Guedj E, Maillard L, et al. Temporal epilepsy lesions may be detected by the voxel-based quantitative analysis of brain Fdg-Pet images using an original block-matching normalization software. Ann Nucl Med. (2016) 30:272–8. doi: 10.1007/s12149-016-1060-4
93. Jeong JW, Asano E, Kumar Pilli V, Nakai Y, Chugani HT, Juhász C. Objective 3d surface evaluation of intracranial electrophysiologic correlates of cerebral glucose metabolic abnormalities in children with focal epilepsy. Hum Brain Mapp. (2017) 38:3098–112. doi: 10.1002/hbm.23577
94. Wei L, Guo K, Li Y, Guo Z, Gao C, Yuan M, et al. Construction of a novel chinese normal brain database using (18)F-FDG-PET images and mimneuro software, the initial application in epilepsy. Int J Neurosci. (2019) 129:417–22. doi: 10.1080/00207454.2018.1538138
95. Guo K, Wei Y, Yuan M, Wei L, Lu J. Identifying the characteristics of brain glucose metabolism using normal (18)F-FDG-PET database in patients with temporal lobe epilepsy. Neurol Sci Official J Italian Neurol Soc Italian Soc Clin Neurophysiol. (2020) 41:3219–26. doi: 10.1007/s10072-020-04426-1
96. Guo K, Yuan M, Wei L, Lu J. Epileptogenic zone localization using a new automatic quantitative analysis based on normal brain glucose metabolism database. Int J Neurosci. (2021) 131:128–34. doi: 10.1080/00207454.2020.1733561
97. Pilli VK, Jeong JW, Konka P, Kumar A, Chugani HT, Juhász C. Objective pet study of glucose metabolism asymmetries in children with epilepsy: implications for normal brain development. Hum Brain Mapp. (2019) 40:53–64. doi: 10.1002/hbm.24354
98. Archambaud F, Bouilleret V, Hertz-Pannier L, Chaumet-Riffaud P, Rodrigo S, Dulac O, et al. Optimizing statistical parametric mapping analysis of 18f-FDG-PET in children. EJNMMI Res. (2013) 3:2. doi: 10.1186/2191-219X-3-2
99. De Blasi B, Barnes A, Galazzo IB, Hua CH, Shulkin B, Koepp M, et al. Age-specific (18)F-fdg image processing pipelines and analysis are essential for individual mapping of seizure foci in pediatric patients with intractable epilepsy. J Nucl Med. (2018) 59:1590–6. doi: 10.2967/jnumed.117.203950
100. Zhang T, Li Y, Zhao S, Xu Y, Zhang X, Wu S, et al. High-resolution pediatric age-specific (18)F-FDG-PET template: a pilot study in epileptogenic focus localization. Eur J Nucl Med Mol Imaging. (2022) 49:1560–73. doi: 10.1007/s00259-021-05611-w
101. Wang K, Liu T, Zhao X, Xia X, Zhang K, Qiao H, et al. Comparative study of voxel-based epileptic foci localization accuracy between statistical parametric mapping and three-dimensional stereotactic surface projection. Front Neurol. (2016) 7:164. doi: 10.3389/fneur.2016.00164
102. Higo T, Sugano H, Nakajima M, Karagiozov K, Iimura Y, Suzuki M, et al. The Predictive value of Fdg-Pet with 3d-Ssp for surgical outcomes in patients with temporal lobe epilepsy. Seizure. (2016) 41:127–33. doi: 10.1016/j.seizure.2016.07.019
103. Zhou H, Zhang W, Tan Z, Zhou Z, Li Y, Zhang S, et al. Localizing epileptic foci before surgery in patients with Mri-negative refractory epilepsy using statistical parameter mapping and three-dimensional stereotactic surface projection based on (18)F-FDG-PET. Front Bioeng Biotechnol. (2021) 9:810890. doi: 10.3389/fbioe.2021.810890
104. Zhu Y, Feng J, Wu S, Hou H, Ji J, Zhang K, et al. Glucose metabolic profile by visual assessment combined with statistical parametric mapping analysis in pediatric patients with epilepsy. J Nucl Med. (2017) 58:1293–9. doi: 10.2967/jnumed.116.187492
105. Li Y, Feng J, Zhang T, Shi K, Ding Y, Zhang X, et al. Brain metabolic characteristics distinguishing typical and atypical benign epilepsy with centro-temporal spikes. Eur Radiol. (2021) 31:9335–45. doi: 10.1007/s00330-021-08051-0
106. Wang YH, An Y, Fan XT, Lu J, Ren LK, Wei PH, et al. Comparison between simultaneously acquired arterial spin labeling and (18)F-FDG-PET in mesial temporal lobe epilepsy assisted by a Pet/Mr system and seeg. NeuroImage Clin. (2018) 19:824–30. doi: 10.1016/j.nicl.2018.06.008
107. Zhang M, Huang H, Liu W, Tang L, Li Q, Wang J, et al. Combined quantitative T2 mapping and [(18)F]FDG-PET could improve lateralization of mesial temporal lobe epilepsy. Eur Radiol. (2022) 28:1–10. doi: 10.1007/s00330-022-08707-5
108. Boscolo Galazzo I, Mattoli MV, Pizzini FB, De Vita E, Barnes A, Duncan JS, et al. Cerebral metabolism and perfusion in Mr-negative individuals with refractory focal epilepsy assessed by simultaneous acquisition of (18)F-FDG-PET and arterial spin labeling. NeuroImage Clinical. (2016) 11:648–57. doi: 10.1016/j.nicl.2016.04.005
109. Poirier SE, Kwan BYM, Jurkiewicz MT, Samargandy L, Steven DA, Suller-Marti A, et al. (18)F-FDG-PET-guided diffusion tractography reveals white matter abnormalities around the epileptic focus in medically refractory epilepsy: implications for epilepsy surgical evaluation. Europ J Hybrid Imag. (2020) 4:10. doi: 10.1186/s41824-020-00079-7
110. Liu F, Ruan W, Deng X, Song Y, Song W, Hu F, et al. Efficacy of Delayed (18)F-Fdg hybrid Pet/Mri for epileptic focus identification: a prospective cohort study. Eur J Nucl Med Mol Imag. (2021) 48:293–301. doi: 10.1007/s00259-020-04935-3
111. Tang Y, Liow JS, Zhang Z, Li J, Long T, Li Y, et al. The evaluation of dynamic fdg-pet for detecting epileptic foci and analyzing reduced glucose phosphorylation in refractory epilepsy. Front Neurosci. (2018) 12:993. doi: 10.3389/fnins.2018.00993
112. Elisevich K, Davoodi-Bojd E, Heredia JG, Soltanian-Zadeh H. Prospective quantitative neuroimaging analysis of putative temporal lobe epilepsy. Front Neurol. (2021) 12:747580. doi: 10.3389/fneur.2021.747580
113. Aslam S, Rajeshkannan R, Sandya CJ, Sarma M, Gopinath S, Pillai A. Statistical asymmetry analysis of volumetric mri and FDG-PET in temporal lobe epilepsy. Epilepsy & behavior: E&B. (2022) 134:108810. doi: 10.1016/j.yebeh.2022.108810
114. Seshadri V, Zarroli KA, Schetlick RS, Massey JC, Reyes JM, Eluvathingal Muttikal TJ, et al. Dynamic Fdg-Pet in localization of focal epilepsy: a pilot study. Epilepsy Behav. (2021) 122:108204. doi: 10.1016/j.yebeh.2021.108204
115. Traub-Weidinger T, Muzik O, Sundar LKS, Aull-Watschinger S, Beyer T, Hacker M, et al. Utility of absolute quantification in non-lesional extratemporal lobe epilepsy using FDG-PET/Mr imaging. Front Neurol. (2020) 11:54. doi: 10.3389/fneur.2020.00054
116. Trotta N, Goldman S, Legros B, Baete K, Van Laere K, Van Bogaert P, et al. Changes in functional integration with the non-epileptic temporal lobe of patients with unilateral mesiotemporal epilepsy. PLoS ONE. (2013) 8:e67053. doi: 10.1371/journal.pone.0067053
117. Wang KL, Hu W, Liu TH, Zhao XB, Han CL, Xia XT, et al. Metabolic covariance networks combining graph theory measuring aberrant topological patterns in mesial temporal lobe epilepsy. CNS Neurosci Ther. (2019) 25:396–408. doi: 10.1111/cns.13073
118. Vanicek T, Hahn A, Traub-Weidinger T, Hilger E, Spies M, Wadsak W, et al. Insights into intrinsic brain networks based on graph theory and pet in right- compared to left-sided temporal lobe epilepsy. Sci Rep. (2016) 6:28513. doi: 10.1038/srep28513
119. Shim HK, Lee HJ, Kim SE, Lee BI, Park S, Park KM. Alterations in the metabolic networks of temporal lobe epilepsy patients: a graph theoretical analysis using Fdg-Pet. NeuroImage Clin. (2020) 27:102349. doi: 10.1016/j.nicl.2020.102349
120. Cho KH, Park KM, Lee HJ, Cho H, Lee DA, Heo K, et al. Metabolic network is related to surgical outcome in temporal lobe epilepsy with hippocampal sclerosis: a brain fdg-Pet study. J Neuroimag Official J Am Soc Neuroimag. (2022) 32:300–13. doi: 10.1111/jon.12941
121. Ren S, Huang Q, Bao W, Jiang D, Xiao J, Li J, et al. Metabolic brain network and surgical outcome in temporal lobe epilepsy: a graph theoretical study based on (18)F-fluorodeoxyglucose pet. Neuroscience. (2021) 478:39–48. doi: 10.1016/j.neuroscience.2021.10.012
122. Sequeira KM, Tabesh A, Sainju RK, DeSantis SM, Naselaris T, Joseph JE, et al. Perfusion network shift during seizures in medial temporal lobe epilepsy. PLoS ONE. (2013) 8:e53204. doi: 10.1371/journal.pone.0053204
123. Zhao B, Seguin C, Ai L, Sun T, Hu W, Zhang C, et al. Aberrant metabolic patterns networks in insular epilepsy. Front Neurol. (2020) 11:605256. doi: 10.3389/fneur.2020.605256
124. Aparicio J, Carreño M, Bargalló N, Setoain X, Rubí S, Rumià J, et al. Combined (18)F-Fdg-Pet and diffusion tensor imaging in mesial temporal lobe epilepsy with hippocampal sclerosis. NeuroImage Clinical. (2016) 12:976–89. doi: 10.1016/j.nicl.2016.05.002
125. Zhu Z, Zhang Z, Gao X, Feng L, Chen D, Yang Z, et al. Individual brain metabolic connectome indicator based on jensen-shannon divergence similarity estimation predicts seizure outcomes of temporal lobe epilepsy. Front Cell Develop Biol. (2021) 9:803800. doi: 10.3389/fcell.2021.803800
126. Chiang S, Guindani M, Yeh HJ, Dewar S, Haneef Z, Stern JM, et al. A hierarchical bayesian model for the identification of Pet markers associated to the prediction of surgical outcome after anterior temporal lobe resection. Front Neurosci. (2017) 11:669. doi: 10.3389/fnins.2017.00669
127. Kerr WT, Cho AY, Anderson A, Douglas PK, Lau EP, Hwang ES, et al. Balancing clinical and pathologic relevence in the machine learning diagnosis of epilepsy. Int Workshop Pattern Recognit NeuroImag Int Workshop Pattern Recognit NeuroImag. (2013) 2013:86–9. doi: 10.1109/PRNI.2013.31
128. Kerr WT, Nguyen ST, Cho AY, Lau EP, Silverman DH, Douglas PK, et al. Computer-aided diagnosis and localization of lateralized temporal lobe epilepsy using interictal Fdg-Pet. Front Neurol. (2013) 4:31. doi: 10.3389/fneur.2013.00031
129. Peter J, Khosravi M, Werner TJ, Alavi A. Global temporal lobe asymmetry as a semi-quantitative imaging biomarker for temporal lobe epilepsy lateralization: a machine learning classification study. Hell J Nucl Med. (2018) 21:95–101. doi: 10.1967/s002449910800
130. Akdemir U, Yildirim I, Aydos U, Gulbahar Ates S, Kurt G, Atay L. The evaluation of brain FDG-PET images in temporal lobe epilepsy by data mining methods in terms of lateralization of epileptogenic focus. Eur J Nuclear Med Mol Imag. (2019) 46:S391.
131. Beheshti I, Sone D, Maikusa N, Kimura Y, Shigemoto Y, Sato N, et al. Pattern analysis of glucose metabolic brain data for lateralization of Mri-negative temporal lobe epilepsy. Epilepsy Res. (2020) 167:106474. doi: 10.1016/j.eplepsyres.2020.106474
132. Wu D, Yang L, Gong G, Zheng Y, Jin C, Qi L, et al. Characterizing the hyper- and hypometabolism in temporal lobe epilepsy using multivariate machine learning. J Neurosci Res. (2021) 99:3035–46. doi: 10.1002/jnr.24951
133. Zhang Q, Liao Y, Wang X, Zhang T, Feng J, Deng J, et al. A deep learning framework for (18)F-FDG-PET imaging diagnosis in pediatric patients with temporal lobe epilepsy. Eur J Nucl Med Mol Imag. (2021) 48:2476–85. doi: 10.1007/s00259-020-05108-y
134. Shih YC, Lee TH Yu HY, Chou CC, Lee CC, Lin PT, et al. Machine learning quantitative analysis of FDG-PET images of medial temporal lobe epilepsy patients. Clin Nucl Med. (2022) 47:287–93. doi: 10.1097/RLU.0000000000004072
135. Tan YL, Kim H, Lee S, Tihan T, Ver Hoef L, Mueller SG, et al. Quantitative surface analysis of combined Mri and Pet enhances detection of focal cortical dysplasias. Neuroimage. (2018) 166:10–8. doi: 10.1016/j.neuroimage.2017.10.065
136. Lin Y, Mo J, Jin H, Cao X, Zhao Y, Wu C, et al. Automatic analysis of integrated magnetic resonance and positron emission tomography images improves the accuracy of detection of focal cortical dysplasia type Iib lesions. Eur J Neurosci. (2021) 53:3231–41. doi: 10.1111/ejn.15185
137. Kini LG, Thaker AA, Hadar PN, Shinohara RT, Brown MG, Dubroff JG, et al. Quantitative ([)(18)(])FDG-PET asymmetry features predict long-term seizure recurrence in refractory epilepsy. Epilepsy Behav. (2021) 116:107714. doi: 10.1016/j.yebeh.2020.107714
138. Vunckx K, Dupont P, Goffin K, Van Paesschen W, Van Laere K, Nuyts J. Voxel-based comparison of state-of-the-art reconstruction algorithms for 18f-FDG-PET brain imaging using simulated and clinical data. Neuroimage. (2014) 102:875–84. doi: 10.1016/j.neuroimage.2014.06.068
139. Elkins KC, Moncayo VM, Kim H, Olson LD. Utility of gray-matter segmentation of ictal-interictal perfusion spect and interictal (18)F-Fdg-Pet in medically refractory epilepsy. Epilepsy Res. (2017) 130:93–100. doi: 10.1016/j.eplepsyres.2017.01.009
140. Paldino MJ, Yang E, Jones JY, Mahmood N, Sher A, Zhang W, et al. Comparison of the diagnostic accuracy of Pet/Mri to Pet/Ct-acquired Fdg brain exams for seizure focus detection: a prospective study. Pediatr Radiol. (2017) 47:1500–7. doi: 10.1007/s00247-017-3888-8
141. Poirier SE, Kwan BYM, Jurkiewicz MT, Samargandy L, Iacobelli M, Steven DA, et al. An evaluation of the diagnostic equivalence of (18)F-Fdg-Pet between hybrid Pet/Mri and Pet/Ct in drug-resistant epilepsy: a pilot study. Epilepsy Res. (2021) 172:106583. doi: 10.1016/j.eplepsyres.2021.106583
142. Wang J, Yang H, Cui B, Shan B, Lu J. Effects of Mri protocols on brain Fdg uptake in simultaneous Pet/Mr imaging. Eur J Nucl Med Mol Imag. (2022) 49:2812–20. doi: 10.1007/s00259-022-05703-1
143. Grouiller F, Delattre BM, Pittau F, Heinzer S, Lazeyras F, Spinelli L, et al. All-in-one interictal presurgical imaging in patients with epilepsy: single-session Eeg/Pet/(F)Mri. Eur J Nucl Med Mol Imag. (2015) 42:1133–43. doi: 10.1007/s00259-015-3045-2
144. Pustina D, Avants B, Sperling M, Gorniak R, He X, Doucet G, et al. Predicting the laterality of temporal lobe epilepsy from Pet, Mri, and Dti: a multimodal study. NeuroImage Clin. (2015) 9:20–31. doi: 10.1016/j.nicl.2015.07.010
145. Nazem-Zadeh MR, Elisevich KV, Schwalb JM, Bagher-Ebadian H, Mahmoudi F, Soltanian-Zadeh H. Lateralization of temporal lobe epilepsy by multimodal multinomial hippocampal response-driven models. J Neurol Sci. (2014) 347:107–18. doi: 10.1016/j.jns.2014.09.029
146. Aparicio J, Niñerola-Baizán A, Perissinotti A, Rubí S, Muchart J, Candela-Cantó S, et al. Presurgical evaluation of drug-resistant paediatric focal epilepsy with piscom compared to siscom and Fdg-Pet. Seizure. (2022) 97:43–9. doi: 10.1016/j.seizure.2022.03.010
147. Perissinotti A, Niñerola-Baizán A, Rubí S, Carreño M, Marti-Fuster B, Aparicio J, et al. Piscom: a new procedure for epilepsy combining Ictal spect and interictal pet. Eur J Nucl Med Mol Imag. (2018) 45:2358–67. doi: 10.1007/s00259-018-4080-6
148. Fernández S, Donaire A, Serès E, Setoain X, Bargalló N, Falcón C, et al. Pet/Mri and Pet/Mri/Siscom coregistration in the presurgical evaluation of refractory focal epilepsy. Epilepsy Res. (2015) 111:1–9. doi: 10.1016/j.eplepsyres.2014.12.011
149. Hu WH, Wang X, Liu LN, Shao XQ, Zhang K, Ma YS, et al. Multimodality image post-processing in detection of extratemporal Mri-negative cortical dysplasia. Front Neurol. (2018) 9:450. doi: 10.3389/fneur.2018.00450
150. Lin Y, Fang YD, Wu G, Jones SE, Prayson RA, Moosa ANV, et al. Quantitative positron emission tomography-guided magnetic resonance imaging post-processing in magnetic resonance imaging-negative epilepsies. Epilepsia. (2018) 59:1583–94. doi: 10.1111/epi.14474
151. Sun K, Ren Z, Yang D, Wang X, Yu T, Ni D, et al. Voxel-based morphometric Mri Post-processing and Pet/Mri Co-registration reveal subtle abnormalities in cingulate epilepsy. Epilepsy Res. (2021) 171:106568. doi: 10.1016/j.eplepsyres.2021.106568
152. Guo K, Wang J, Wang Z, Wang Y, Cui B, Zhao G, et al. Morphometric analysis program and quantitative positron emission tomography in presurgical localization in Mri-negative epilepsies: a simultaneous Pet/Mri study. Eur J Nucl Med Mol Imaging. (2022) 49:1930–8. doi: 10.1007/s00259-021-05657-w
153. Mareček R, Ríha P, Bartonová M, Kojan M, Lamoš M, Gajdoš M, et al. Automated fusion of multimodal imaging data for identifying epileptogenic lesions in patients with inconclusive magnetic resonance imaging. Hum Brain Mapp. (2021) 42:2921–30. doi: 10.1002/hbm.25413
154. Guo K, Wang J, Cui B, Wang Y, Hou Y, Zhao G, et al. [(18)F]FDG-PET/Mri and magnetoencephalography may improve presurgical localization of temporal lobe epilepsy. Eur Radiol. (2022) 32:3024–34. doi: 10.1007/s00330-021-08336-4
155. Lagarde S, Boucekine M, McGonigal A, Carron R, Scavarda D, Trebuchon A, et al. Relationship between Pet metabolism and seeg epileptogenicity in focal lesional epilepsy. Eur J Nucl Med Mol Imag. (2020) 47:3130–42. doi: 10.1007/s00259-020-04791-1
156. Ding YS, Chen BB, Glielmi C, Friedman K, Devinsky O, A pilot study in epilepsy patients using simultaneous Pet/Mr. Am J Nucl Med Mol Imag. (2014) 4:459–70.
157. Oldan JD, Shin HW, Khandani AH, Zamora C, Benefield T, Jewells V. Subsequent experience in hybrid Pet-Mri for evaluation of refractory focal onset epilepsy. Seizure. (2018) 61:128–34. doi: 10.1016/j.seizure.2018.07.022
158. Guo K, Cui B, Shang K, Hou Y, Fan X, Yang H, et al. Assessment of localization accuracy and post-surgical prediction of simultaneous (18)F-FDG-PET/Mri in refractory epilepsy patients. Eur Radiol. (2021) 31:6974–82. doi: 10.1007/s00330-021-07738-8
159. Kikuchi K, Togao O, Yamashita K, Momosaka D, Nakayama T, Kitamura Y, et al. Diagnostic accuracy for the epileptogenic zone detection in focal epilepsy could be higher in Fdg-Pet/Mri than in Fdg-Pet/Ct. Eur Radiol. (2021) 31:2915–22. doi: 10.1007/s00330-020-07389-1
160. Shang K, Wang J, Fan X, Cui B, Ma J, Yang H, et al. Clinical value of hybrid Tof-Pet/Mr imaging-based multiparametric imaging in localizing seizure focus in patients with Mri-negative temporal lobe epilepsy. AJNR Am J Neuroradiol. (2018) 39:1791–8. doi: 10.3174/ajnr.A5814
161. Khalaf AM, Nadel HR, Dahmoush HM. Simultaneously acquired Mri arterial Spin-labeling and interictal Fdg-Pet improves diagnosis of pediatric temporal lobe epilepsy. AJNR Am J Neuroradiol. (2022) 43:468–73. doi: 10.3174/ajnr.A7421
162. Zhang M, Liu W, Huang P, Lin X, Huang X, Meng H, et al. Utility of hybrid pet/mri multiparametric imaging in navigating seeg placement in refractory epilepsy. Seizure. (2020) 81:295–303. doi: 10.1016/j.seizure.2020.08.027
163. Zhang M, Qin Q, Zhang S, Liu W, Meng H, Xu M, et al. Aerobic glycolysis imaging of epileptic Foci during the inter-Ictal period. EBioMedicine. (2022) 79:104004. doi: 10.1016/j.ebiom.2022.104004
164. Wang J, Shan Y, Dai J, Cui B, Shang K, Yang H, et al. Altered coupling between resting-state glucose metabolism and functional activity in epilepsy. Ann Clin Translat Neurol. (2020) 7:1831–42. doi: 10.1002/acn3.51168
165. Flaus A, Mellerio C, Rodrigo S, Brulon V, Lebon V, Chassoux F. (18)F-FDG-PET/Mr in focal epilepsy: a new step for improving the detection of epileptogenic lesions. Epilepsy Res. (2021) 178:106819. doi: 10.1016/j.eplepsyres.2021.106819
166. Tóth M, Barsi P, Tóth Z, Borbély K, Lückl J, Emri M, et al. The role of hybrid Fdg-Pet/Mri on decision-making in presurgical evaluation of drug-resistant epilepsy. BMC Neurol. (2021) 21:363. doi: 10.1186/s12883-021-02352-z
Keywords: epilepsy, nuclear medicine, SPECT, PET, radiopharmaceuticals, techniques, presurgical localization
Citation: Sukprakun C and Tepmongkol S (2022) Nuclear imaging for localization and surgical outcome prediction in epilepsy: A review of latest discoveries and future perspectives. Front. Neurol. 13:1083775. doi: 10.3389/fneur.2022.1083775
Received: 29 October 2022; Accepted: 25 November 2022;
Published: 16 December 2022.
Edited by:
Daichi Sone, Jikei University School of Medicine, JapanReviewed by:
Hiroshi Matsuda, Southern TOHOKU Research Institute for Neuroscience, JapanJens P. Bankstahl, Hannover Medical School, Germany
Copyright © 2022 Sukprakun and Tepmongkol. This is an open-access article distributed under the terms of the Creative Commons Attribution License (CC BY). The use, distribution or reproduction in other forums is permitted, provided the original author(s) and the copyright owner(s) are credited and that the original publication in this journal is cited, in accordance with accepted academic practice. No use, distribution or reproduction is permitted which does not comply with these terms.
*Correspondence: Supatporn Tepmongkol,  supatporn.t@chula.ac.th