

ADVERTISEMENT
Components of the EP Study, Part 2: Decremental Ventricular Pacing (DVP)
Read Part 1, Part 3, and Part 4 here.
The basic EP study is pivotal to understanding the capabilities of the conduction system in the production of arrhythmias. The initial part of the EP study, which we covered in last month’s issue of EP Lab Digest, involves the measurement of baseline intervals. The second part is decremental ventricular pacing (DVP). The following is a review of how this is performed and what findings are possible. This material has been adapted from content from the Order and Disorder EP Training Program.
DVP involves continuous pacing from the right ventricular apex (or RVOT) with progressively shorter cycle lengths, or at a faster rate, until VA block occurs. This is retrograde AV nodal block as the pacing is initiated in the ventricle. This step allows for assessment of retrograde AV nodal function in addition to identifying conduction over either the fast or slow AV nodal pathway. Conduction over a route which is neither the fast or slow AV nodal pathway means you have discovered an accessory pathway.
DVP is often considered the most important part of the EP study because it provides information about how the atria and ventricle are electrically connected. Since PSVT is a very common rhythm problem evaluated in the EP lab, DVP’s most important value is in providing insight into the PSVT mechanism, specifically the “retrograde limb” of the circuit. In 90% of all PSVTs, the tachycardia mechanism utilizes two pathways. Usually this involves a macroreentrant circuit with an antegrade route from atria to ventricles, and a retrograde route from ventricles to atria. The most common antegrade route is via the fast AV nodal pathway, the normal route for all supraventricular rhythms. In the retrograde direction, the route will be at least one of three: fast AV nodal pathway, slow AV nodal pathway, or accessory pathway. About 90% of patients have intact VA conduction, most commonly utilizing the fast AV nodal pathway. However, combinations exist such as fast only, fast and slow (but never simultaneously), or slow only.
Decremental Ventricular Pacing Process
At the outset of DVP, pacing is begun at a cycle length slightly shorter than the sinus cycle length. When the pacing cycle length (PCL) becomes shorter than the sinus cycle length (SCL), the ventricular rhythm is a paced rhythm. You will immediately be able to see if 1:1 VA conduction is present. If present, each A will appear to be linked to the V that produced it. You can verify this by taking the calipers and checking to see if the A1-A1 interval remains identical to the V1-V1 interval.
If VA conduction is absent, there will be no V to A relationship. The A’s and V’s will be dissociated. If this is your finding, DVP is concluded and you would move to the next step in an EP study: decremental atrial pacing (DAP). In cases of absent VA conduction, isoproterenol may be administered at the end of the study to see if VA conduction develops. This is especially important if no arrhythmias were induced in the baseline study.
The PCL is then decremented by 10-20 msec about every 8-10 beats. Each time the PCL is shortened, it takes several beats for the AV node to accommodate to the new rate. This means that the V1-A1 interval will lengthen a bit for the first few beats, usually up to 10 msec, and then stabilize as the node accommodates to the new PCL. As long as the impulse conduction is limited to the AV nodal routes, the stabilized value will always be slightly longer than the V1-A1 interval at the previous PCL. If no change in autonomic tone has occurred, that V1-A1 will remain fixed as long as the PCL does not change. You stop pacing when VA block occurs (loss of 1:1 conduction).
During the 1:1 VA conduction, every V (lead V1) is followed by an A (RA intracardiac recording). The surface ECG V1 lead and RA are usually next to each other on the monitor, making it easy to verify this 1:1 relationship. You must keep your eyes on the V1 and RA tracings to recognize when VA block occurs. VA block is seen when there is sudden absence of an A. However, if instead of VA block, the impulse shifts to the slow pathway, it may appear initially that VA block occurred, but when you look closely, you’ll see a very late A or an A just preceding the next V.
Generally, when VA block occurs, it will happen at a specific PCL known as the Wenckebach cycle length and is usually evident within the first few beats of that cycle length.
Assessment of Retrograde AV Nodal Function
With the performance of DVP, two pieces of information are revealed: the limits of impulse input and transit time. In determining the limits of an impulse inputting through the AV node, you are assessing how rapidly the impulse can be delivered to the compact AV node and still make it through the node successfully. The assessment is only relevant while 1:1 conduction is present. This may be described in two ways. One is “the shortest V1-V1 interval or PCL associated with 1:1 VA conduction” (or the fastest rate associated with 1:1 conduction). Any shorter V1-V1 intervals are going to block. An equivalent way to express this limit is “the longest V1-V1 interval or PCL associated with VA block” (also referred to as the Wenckebach cycle length). This V1-V1 input limit can cover a fairly wide range, but is usually around 300-550 msec. For patients with retrograde dual physiology, the description can be more precise and include input limits to either the fast or slow pathway.
Transit time through the AV node, measured in msec, may be a little more difficult to understand. The true measure of retrograde AV nodal conduction time is the H1-A1 interval (opposite to the AH) during DVP. Without appropriate electrode spacing and good luck, it is difficult to consistently record a retrograde His potential, so we look to the next best thing, the V1-A1 interval. This is how it works: when pacing from the usual RV apical pacing site, impulse conduction time from apex to the interventricular basal septum (location of the His bundle) is roughly similar, whether you arrived via the His-Purkinje system or via ventricular muscle. Since the His bundle catheter provides recordings of the impulse’s arrival in this region, whether via muscle (V gram is His recording) or via the His-Purkinje system (hidden His spike), the onset of the V electrogram in the His recording can be used as a surrogate for the His electrogram since their timing of arrival is similar. The onset of the His V gram, therefore, represents what the His would indicate: “entrance” timing to the AV node. The His atrial electrogram represents the “exit” timing, and what lies between (VA interval) is the nodal transit time.
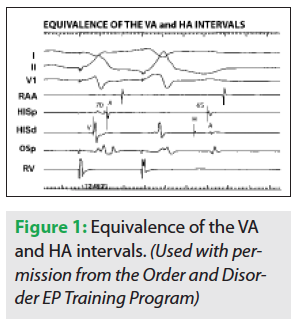 Figure 1 helps to clarify this. Notice that two ventricular paced beats are shown. For the first beat, retrograde conduction is seen to travel over the fast pathway: a short VA interval (70 msec) and with earliest atrial activation in the His. For the second paced beat, because it is premature, the delay seen in the His-Purkinje system results in late inscription of the His potential. The His spike is purposefully “pushed out” from its hidden location within the ventricular electrogram to unveil true retrograde AV nodal conduction, which is also taking place over the fast AV nodal pathway. Under normal conduction system circumstances, because retrograde atrial activation timing always depends on the His timing, the His atrial electrogram is also late. Owing to the delay in conduction through the His-Purkinje system following the premature ventricular paced beat, an HA interval can now be measured (65 msec), and is quite comparable to the surrogate VA interval of 70 msec.
Now we are able to measure the limits of retrograde AV nodal transit time in everyone using the VA interval (always measured in the His recording) and use it to distinguish fast from slow AV nodal pathway conduction based on very different and non-overlapping transit times. As discussed below, fast vs slow AV nodal pathway retrograde conduction can also be distinguished by noting where the earliest site of retrograde atrial activation is taking place: in the His recording (fast pathway) or in the CS os recording (slow pathway).
The AV junction can be considered as having three component parts:
- The compact AV node, where the conduction delay occurs;
- The anterosuperior approaches to the compact node known as the fast AV nodal pathway located in the anterosuperior interatrial septum near the apex of the triangle of Koch, and whose antegrade course is shown by the dashed line in Figure 2;
- The posteroinferior approaches extending from the compact node to the region of the coronary sinus os, known as the slow AV nodal pathway.
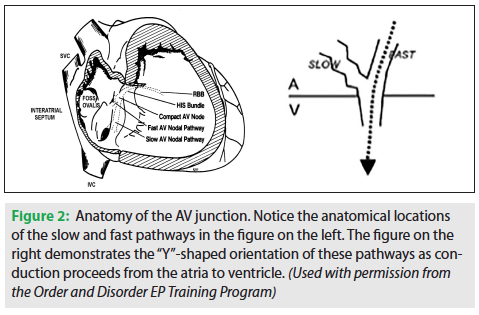
The anatomy of the AV junction is a Y-shaped structure, diagrammatically shown in Figure 2. From the perspective of a retrograde impulse, there is a choice of two different paths, if both are available. Travel over the fast AV nodal pathway will deliver the earliest atrial activation in the region of the His catheter, so the earliest atrial activation will be seen on His tracings. Retrograde conduction via the slow pathway produces earliest atrial activation in the region of the CS os. Because retrograde conduction via the fast pathway is relatively rapid, transit time is short and the His recording will disclose a short VA interval, invariably <150 msec. Thus, the hallmark of retrograde fast pathway conduction is a short (<150 msec) VA interval with earliest atrial activation seen in the His tracing. Retrograde slow pathway conduction is characterized by long (>150 msec) VA intervals as measured in the His, with earliest activation seen in the CS os region.
When retrograde AV nodal conduction is present, responses to DVP break down into only four possible patterns of VA conduction leading up to second-degree block. The first is seen as retrograde conduction occurring exclusively over the fast pathway up to the point of VA block. This is seen in about 41% of patients. The only available retrograde route is the fast AV nodal pathway. When second-degree VA block occurs, it will usually persist with either a 2:1 or a Mobitz I (Wenckebach) behavior.
The second possible pattern is that the retrograde conduction shifts from the fast path to the slow path, with the shift occurring immediately before the point of VA block. This individual has an “unstable” slow pathway with only a glimpse of it seen during DVP, and only during the Wenckebach cycle length. This is a more common finding than stable slow pathway conduction. Wenckebach conduction behavior is what is usually seen once second-degree block occurs.
The third possible pattern is that retrograde conduction shifts from the fast pathway to the slow pathway well before the point of VA block. In this situation, the slow pathway is stable and capable of maintaining 1:1 conduction for at least one PCL, or more. This pattern is more uncommon than the unstable slow pathway pattern. When second-degree block is reached, Wenckebach behavior is also the rule and 2:1 is rarely seen. This Wenckebach behavior is often confined to the slow pathway.
The stable and unstable patterns of slow pathway behavior together make up about 36% of patients.
The fourth pattern involves retrograde conduction occurring exclusively over the slow AV nodal pathway up to the point of block (12%). This is the least common situation. When VA block occurs, the pattern is usually 2:1, but sometimes Wenckebach is seen. With this pattern, earliest activation is always confined to the CS os region and VA intervals always exceed 150 msec.
The remaining possible outcome is that there is no VA conduction, and this seems to occur in about 11% of the population.
To summarize: an impulse is traveling retrograde over the fast AV nodal pathway when the V1-A1 interval is <150 msec measured in the His recording and the earliest site of retrograde atrial activation is found in the His recording. A retrograde impulse is traveling on the slow AV nodal pathway when the V1-A1 interval is >150 msec measured in the His recording and the earliest site of retrograde atrial activation is found in the CS os recording.
A comment about the relationship between the different available retrograde routes and PSVT mechanism is worth noting here. If you have a patient with retrograde fast pathway conduction (regardless of whether a slow pathway also exists), AV nodal reentry of the common variety might be the diagnosis, if PSVT has been documented because retrograde fast AV nodal pathway conduction is a necessity for that arrhythmia. If you have a patient with an available slow AV nodal pathway (regardless of the presence of a fast pathway), uncommon AV node reentry may be a possible explanation because that arrhythmia absolutely requires retrograde conduction over a slow pathway. If you have absent VA conduction even with isoproterenol, an atrial tachycardia is most likely and an accessory pathway is excluded. Amazingly, you will be prepared to predict which PSVT is likely present (or not) at the very first step of the EP study: DVP. That is why we do it first.
Purpose of DVP
The primary purpose of DVP is to discover what retrograde routes connecting ventricles to atria are available for impulse conduction. As outlined, there are four possible findings when VA conduction is present: fast only, fast and slow (two types), slow only. Otherwise, no VA conduction is the remaining situation. When both retrograde fast and slow conduction are present, conduction behavior over the slow pathway can be stable, implying a potential role in AV node reentry susceptibility. During DVP, there is also an opportunity to identify retrograde conduction over an accessory pathway, as seen with Wolff-Parkinson-White (WPW) syndrome or PJRT. The telling feature is a pattern of retrograde conduction that is not consistent with either fast or slow pathway conduction. DVP can often be used to initiate a tachycardia by forcing retrograde impulse conduction over a given route that is utilized in that same direction during the clinical tachycardia.
Subsequent discussion will illustrate what conduction over the different routes look like during DVP.
Example of DVP
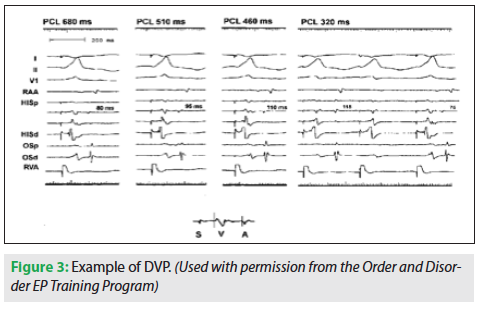 Figure 3 contains four panels, each DVP at four different PCLs. Recordings from four catheters are shown: an RA catheter, an octapolar His catheter, a quadripolar mapping/ablation catheter located in the CS os region, and the RV catheter.
Each PCL consists of 10 beats, allowing time for the AV node to accommodate to each new rate. Each panel shows the 10th beat. As the PCL decreases, the V1-A1 interval progressively lengthens from 80 to 115 msec. VA block is evident in the fourth panel by the missing A. Because there are no VA intervals longer than 115 msec (all <150 msec), and because the site of earliest retrograde atrial activation at all PCLs is in the His recording, one may conclude that the patient has only a fast AV nodal pathway available for retrograde conduction. The Wenckebach cycle length would be noted at 320 msec.
DVP with Isolated Retrograde Fast Pathway Conduction
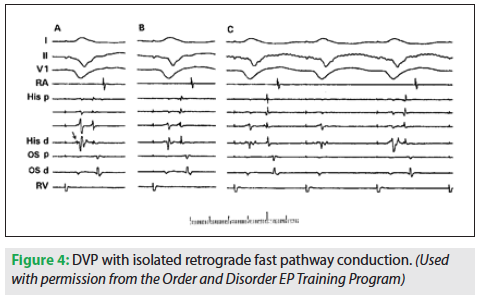 Figure 4 is an example of retrograde AV nodal conduction limited to the fast pathway. Three PCLs are shown, but their values were not labeled. In panel A, the PCL is longest and the VA interval measures 90 msec. In panel B, at a shorter PCL, the VA interval does not appear to have changed significantly. The shortest PCL is shown in panel C. The first VA interval measures 110 msec and earliest retrograde atrial activation is recorded in the His tracing, indicating fast pathway conduction. VA block is evident following the second paced beat, and in the third beat, conduction resumes with a VA measuring 80 msec. Panel C represents the Wenckebach cycle length. Since the longest VA interval during DVP was only 115 msec and earliest A is the His A, one can conclude that the patient has only a fast AV nodal pathway route for retrograde conduction. There are four His recordings, indicating an octapolar using four electrode pairs. A quadripolar mapping/ablation catheter is at the CS os site. The His potential is visible in the distal His electrogram (arrow) appearing as a little spike near the onset of the ventricular potential. Only close-spaced electrodes on the catheter will allow this type of recording resolution.
DVP with Retrograde Fast and Slow AV Nodal Pathway Conduction and an Unstable Slow Pathway
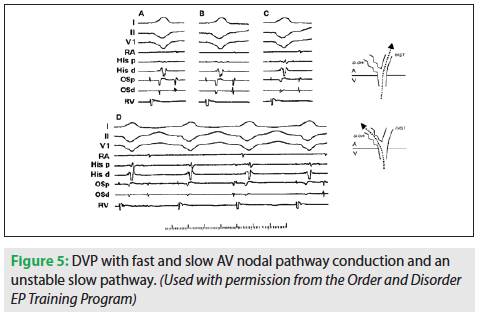 Figure 5 illustrates the second pattern that was discussed: a shift from the fast pathway to the slow pathway occurring immediately before block during the Wenckebach cycle length. Four different PCLs are shown in this figure, with each showing progressive shortening. Four catheters are also seen: RA, His, CS os, and RV. In panel A, the PCL is longest and the VA interval is shortest. The atrial electrogram is difficult to see on the His proximal, and not at all visible on the distal. In subsequent panels, as PCL shortens, the atrial electrogram becomes more evident. As one expects lengthening of the VA interval as you progress through DVP, the separation of the atrial component from the V electrogram becomes evident. If your atrial electrogram is hard to see, you need to withdraw the His catheter to make it easier to see.
On panels A-C, the activation pattern shows the His A to be the earliest and the VA intervals in each are <150 msec, indicating retrograde fast AV nodal pathway conduction at each PCL. Panel D shows that when a ventricular paced cycle length of 360 msec is reached, block in the fast AV nodal pathway occurs (beat #2). At that point, conduction over the slow AV nodal pathway begins as manifested by the sudden occurrence of significant VA lengthening (to values well >150 msec), and a shift of earliest atrial activation to the region near the coronary sinus os (earliest A is now seen in CS os recordings). Block in the slow AV nodal pathway occurs in the next beat (third). Because the slow pathway was the only other pathway, block in the slow pathway leads to second-degree AV block. In the fourth beat, conduction over the fast AV nodal pathway resumes as seen by the short VA interval and the earliest A seen in the His channel. This is the “unstable” pattern of slow pathway conduction leading to second-degree block, since 1:1 conduction over the slow pathway could not be maintained even for a single pacing cycle length.
DVP with Retrograde Fast and Slow AV Nodal Pathway Conduction Using a Stable Slow Pathway
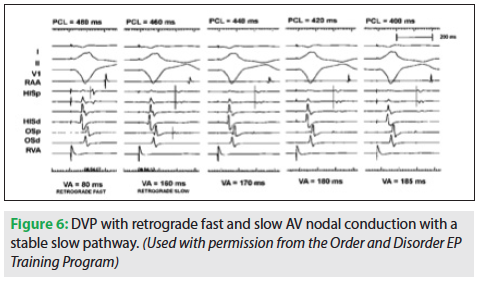 Figures 6 and 7 illustrate the third pattern of retrograde AV nodal pathway conduction which leads up to block, the patient with “stable” slow pathway conduction. In Figure 6, five different PCLs are shown, and the corresponding VA intervals are seen below each.
At PCL 480, the VA interval is 80 msec (<150 msec) and the earliest atrial activation is in the His recording, indicating retrograde fast AV nodal pathway conduction. At PCL 460, there is an obvious, sudden change in the VA interval as well as the site of earliest retrograde atrial activation. The VA interval in the His tracing lengthens to 160 msec (>150 msec), and earliest atrial activation is now seen in the CS os. The shift from fast pathway to slow pathway has occurred. All subsequent panels show atrial activation sequences consistent with conduction over the slow pathway: earliest A in the os and VA intervals >150 msec. Because 1:1 retrograde conduction was maintained over the slow pathway for more than one PCL, the patient is said to have “stable” slow pathway conduction.
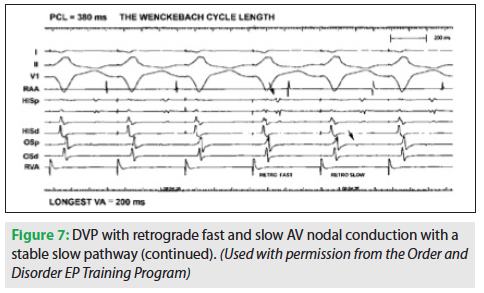 Figure 7 is a continuation of the same study and shows the Wenckebach CL at 380 msec. The VA interval lengthens between the first and second paced beats. The longest VA interval is seen in the last conducted beat (#2), which has a VA of 200 msec in the His. Remember that the last conducted beat will always tell you whether a slow pathway is present. If it is >150 msec, there is a slow pathway. In the third beat, VA conduction is lost because the slow pathway has reached its limit. For the fourth beat, the VA resumes and is now over the fast pathway, as there is a short VA and the earliest A is in the His. The fifth beat shows a jump to the slow pathway. The arrow identifies earliest retrograde atrial activation in the CS os recording. Conduction over the slow pathway continues for a beat or two, and then block recurs in a typical Wenckebach sequence.
DVP with Retrograde Slow Pathway Conduction Alone
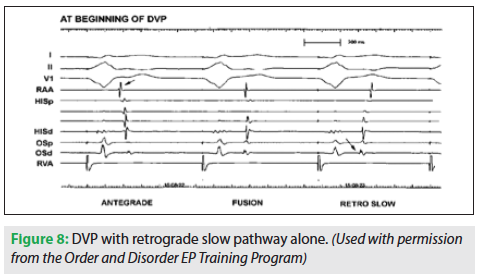 Figure 8 demonstrates only retrograde slow pathway conduction. To not miss seeing this pattern, you need to watch closely at the beginning of DVP, when the pacing begins at a cycle length shorter than the sinus cycle length. The ventricular rate is about to overtake the atrial rate.
The first paced complex is followed by an unrelated or dissociated antegrade sinus beat typical at the beginning of DVP. An “antegrade” atrial activation sequence is appreciated since the RA appendage electrogram (leftward arrow) precedes the His atrial electrogram. The second paced beat is followed by a different atrial activation sequence. There is a fusion between the antegrade sinus impulse and the retrograde impulse conducting through the AV node from the paced beat. The RA-His A relationship is consistent with antegrade activation, but the CS os electrogram onset is noted coincident with the RA appendage egram onset, meaning it is as early at the os.
 Finally, the third paced complex results in atrial capture since retrograde conduction is evident by the new RA-His A relationship: the RA follows His A. Also, the overall activation sequence places the CS os first (rightward arrow), followed by the His A, then RA. Thus, this is the slow pathway. The VA interval also exceeds 150 msec.
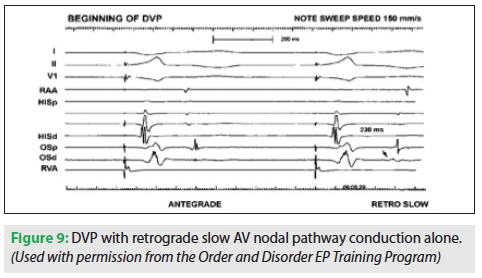
Figure 9 is another example of DVP with retrograde slow pathway alone. Note that this tracing is displayed with a sweep speed of 150 mm/s, so the intervals actually appear longer. The first ventricular paced beat is followed by a dissociated antegrade sinus impulse. The second paced beat results in retrograde conduction, because the impulse reached the atrium and the sinus node before it fired off the next beat. The long VA interval (>150 msec) and the CS os with the earliest atrial electrogram make this retrograde slow pathway conduction.
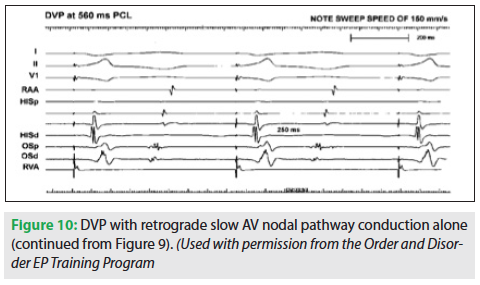 Figure 10 is a continuation of this same patient, showing retrograde slow pathway conduction at a PCL of 560 msec. The VA interval here is 250 msec. Figure 11 represents a further PCL shortening to 380 msec. At this point, the Wenckebach CL is reached and VA block occurs. The third paced beat resumes conduction over the slow pathway, as there is no available fast pathway to shift over to. Hence, Wenckebach occurs exclusively over the slow pathway.
DVP with No VA Conduction
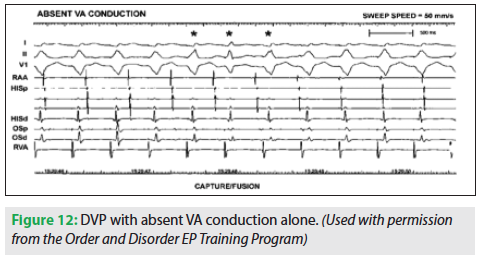
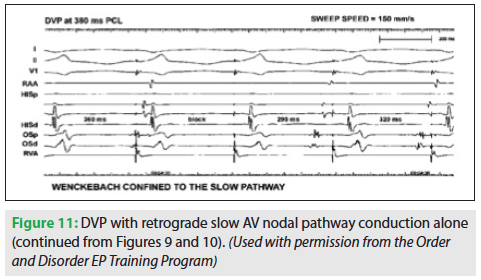 Figure 12 is an example of DVP with no VA conduction. This occurs with about 10-15% of patients, because there is no available route for retrograde impulse conduction, at least in the baseline state. This could change after isoproterenol is given. In this figure, the ventricular PCL is only slightly shorter than the sinus CL. With ventricular pacing, there is AV dissociation instead of a consistent atrial and ventricular relationship. Therefore, the ventricular and atrial timing relationship will change randomly.
Summary
 Decremental ventricular pacing opens the door to recognizing the possibilities of conduction between the atria and ventricles as well as clues to PSVT mechanism. Because a given retrograde atrial activation sequence reflects the site of impulse entry into the atria, a specific route can be identified. Only two routes providing access to the atria are found under “normal” conditions: the fast and slow AV nodal pathways. They each have unique VA interval range (either < or >150 msec) and a unique atrial activation sequence (early A is His or in the CS os region). The retrograde route(s) uncovered during DVP can disclose the “retrograde limb” of a PSVT circuit, leaving only the antegrade limb to be figured out. Because we all normally have antegrade fast AV nodal pathway conduction, it is invariably the fast AV nodal pathway.
Disclosures: The authors have no conflicts of interest to report regarding the content herein.


