 Invest
 (1)-202303311839388055001.png)
Explained: Fundamental analysis of companies through financial statements
For investors in stocks, it is very important to understand the companies that they are getting into. Fundamental analysis involves assessing a stock by considering relevant company, industry and economic factors to arrive at a suitable value.
The first step while considering a company for investment is to analyse its financials – profit & loss account, balance sheet and cashflow statements. These represent the fundamentals of a company.
Based on the understanding of the three key financial statements, some key ratios to calculate the valuation parameters of the company can be calculated to assess the fortunes of the firm under study. These statements are declared as of the end of a specific quarter or financial year.
Here is more about the three key financial statements and the basics of how fundamental analysis.
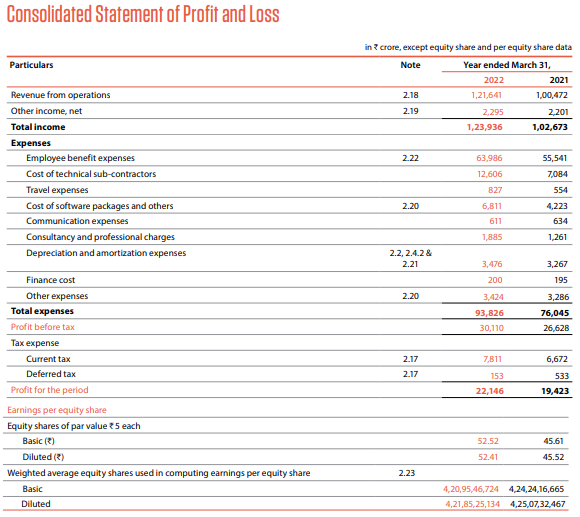
Income statement
The profit & loss or income statement is the most popular among financial report that is followed and analysed by equity investors, analysts, and various other stakeholders.
This income statement records the revenues, expenses, taxes and profits of the company at periodic intervals – quarterly, half-yearly and annual.
In general, the broad formula on which the income statement is constructed is as follows:
Revenues-Expenses=Profits.
Here are the key components.
- We have revenue from operations or sales, which is informally referred to as the top-line. This is the amount of money the company makes by selling its products or services or both.
- Then, there is ‘other’ income in some cases. This may accrue from a variety of non-core or non-operational factors such as foreign exchange gain, income from selling non-current assets and interest income. Revenue from operations present the correct picture of the business, while other income is generally one-off or non-core in nature.
- Then there is cost of sales. This would generally include employee costs, raw material expenses etc.
- We then have the selling, marketing, general and administrative expenses following.
When we subtract the revenues from these expenses, we get the operating profit. This is so called because this is the profit the company makes in the course of its operations after deducting the related expenses. It is called also referred to technically as EBITDA (earnings before interest, taxes, depreciation and amortisation).
- From the EBITDA, depreciation or decline in the value of an asset (machinery, computers, equipment etc.) due to wear and tear is taken. Then there is amortization which refers to the apportioning of the value or cost of intangible assets such as goodwill, patents etc. over its useful life.
- Finally, there are taxes that are to be paid to the government.
When these components are deducted from EBITDA, we get the net profit or loss for a company. Further the earnings per share, which is arrived at by dividing the net profits by total number of shares outstanding.
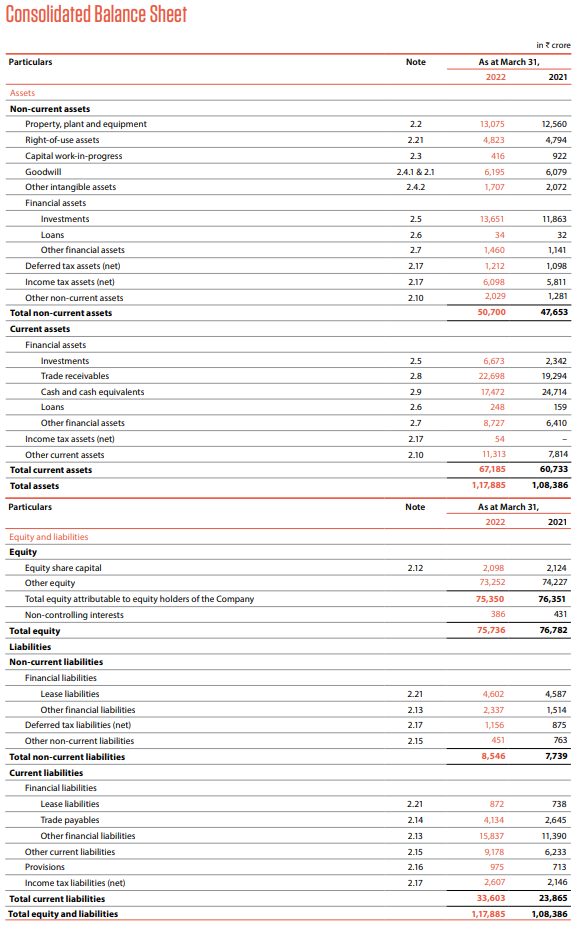
Balance sheet
The next key financial statement is the balance sheet. It lists out the assets, liabilities, shareholders’ equity, among other key components. The financial strength of a company, its ability to service debt, its capacity to generate cash and so on are judged from the balance sheet.
It works on the formula: Assets = Liabilities + Shareholders’ equity
Since the two sides of the equation have to be equal, or in other words balanced, this financial statement gets its name as balance sheet.
- Assets are divided into current and non-current assets.
- The first component under current assets is cash and cash equivalent, which includes short-term deposits (held in the bank), bonds or securities that are liquid or can be liquidated at short notice. Then there are available-for-sale securities, which are typically sold before maturity and at short notice.
- Then we have accounts receivable. These are revenues that are yet to flow through from clients or customers for products or services sold. When accounts receivable decreases, the cash component is expected to increase by the same amount. There are unbilled revenues as well, which, means products or services have been delivered but not yet invoiced or billed.
- Inventory can be finished goods, raw materials, and even work-in-progress items.
In short, current assets refer to those assets value can be realized at short notice by sale or billing.
- On the non-current assets side, which has assets that hold a long-term value, we have property, plant & equipment and tangible assets are listed out. Depreciation is reduced from the value of these assets.
- Then there are intangible assets such as patents, goodwill and brand value recorded.
Then come the liabilities.
- Current liabilities include accounts payable or the amount the company owes suppliers. Then there is current debt (due within a year) payable and the current portion of any long-term debt.
- Non-current liabilities include long term debt and long-term bonds payable, that are due over many years.
Finally, there is shareholders’ equity.
- There is share capital, or the amount that shareholders have invested in the company.
- Then we have the retained earnings, or the portion of net profits that the company decides to keep for long-term use after payment of dividends.
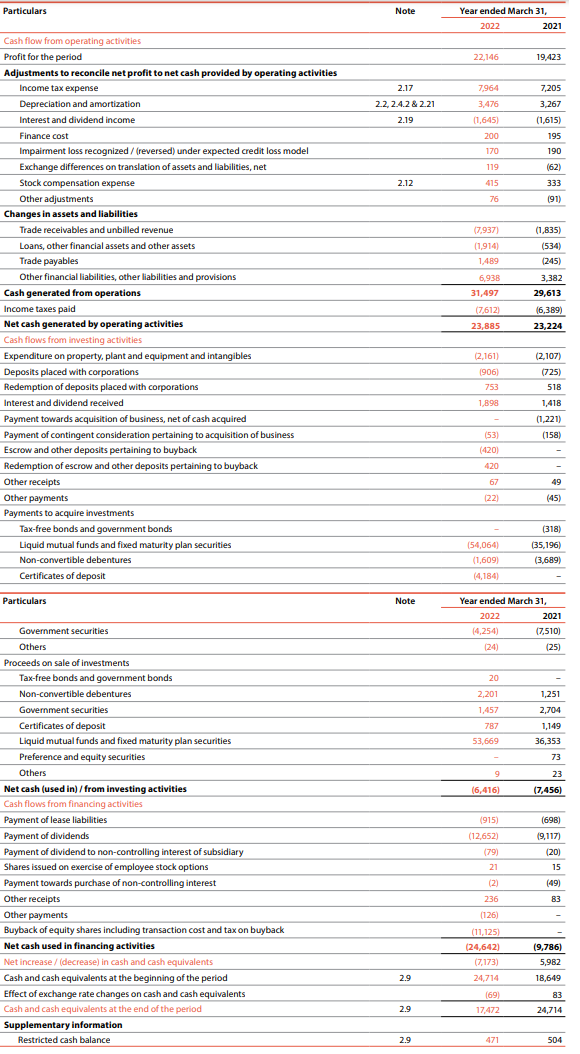
Cashflow statement
This statement gives details of how cash moves in and out of the company across three key activities: operating, investing, and financing. These cashflows are added to arrive at the cash increase or decrease in the company for a given period.
Operating activities: First, the net profit is taken. Non-cash items (that involve no actual outflow but are incurred) such as depreciation and amortization are added. Then we have the interest costs and income tax expenses and any change in working capital. These are added to get the cashflow provided by operating activities.
Investing activities: Expenditure on plant, equipment and property is taken. Investments in instruments such as liquid mutual funds come next, less any redemption of investments. Then there is payment for acquisition and the like. When added, these items together give the cash used in investing activities.
Fundamental analysis with financial statements
We can study the financial condition of the company via ratios that are calculated from the financial statements.
Some key ratios to track are: valuation, profitability, leverage and operational.
- Ratios, especially relating to valuation are used for comparison
- The comparison can be with the company’s own historic valuation multiples and see if the current levels are at a premium or discount
- They can be compared to other peers to understand relative valuation for buy or sell decisions
- Comparison can also be done of PE or other multiples with the industry average or a standard index for studying the attractiveness or otherwise of the stock.
Valuation ratios: The price-earnings multiple or PE ratio is the most followed by analysts and investors for a variety of industries and companies. It is calculated by dividing the market price of a company by its earnings per share (from the income statement). The PE ratio shows the amount of money investors are willing to pay for one rupee of profit generated.
- Price-to-book ratio is the next multiple. It is derived by dividing the sum of equity capital and reserves from the balance sheet with the number of shares outstanding. It is the value on a per share basis that the company would get if it were to sell all its assets.
- Price to sales is the third, which is usually applied for unprofitable companies such as new-age firms. If there a company is negative even at the EBITDA level, we use the price to sales ratio.
Profitability ratios: These include calculating the net profit and operating margins. The former is obtained by dividing the net profits with the total sales or revenues. Operating margin is obtained by dividing the EBITDA by the operating revenue.
Return on equity (RoE) is another popular metric. It is calculated by dividing the net profits with the shareholders’ equity. It shows what a shareholder gets back for the money invested in the business. We also have other metrics such as the return on capital employed and return on assets.
Leverage ratios: Interest coverage ratio is a key metric, which is arrived at by dividing the earnings before interest and taxes (EBIT) with the interest amount paid. It shows how much operating profits can service the interest payments.
Debt-equity ratio is the next. We get this by dividing the total debt with the total equity. Lower the ratio, the better for a company. Debt to assets and financial leverage are other key ratios measured.
Operating ratios: These are used to measure operating efficiency of a company. Inventory turnover, working capital turnover, fixed assets turnover and receivable turnover are some of the ratios measured.
These ratios from the financial statements help analysts conduct fundamental analysis. Of course, other aspects such as discounted cash flow, industry analysis, macroeconomic analysis and rigorous financial modelling are to be done to arrive at a fair value for a stock.
The starting point is an understanding of financial statements and the basics of fundamental analysis.
Source: Infosys Company Result
-
Share
-

-

-

-

-


