Reactivation of a Huge, Deep-Seated, Ancient Landslide: Formation Mechanism, Deformation Characteristics, and Stability


1
School of Civil Engineering, Chongqing University, Chongqing 400044, China
2
School of Civil and Transportation Engineering, Hebei University of Technology, Tianjin 300401, China
3
College of Geology Engineering and Geomatics, Chang’an University, Xi’an 710054, China
4
CIFI Group Company, Limited, Chongqing 400044, China
*
Author to whom correspondence should be addressed.
Water 2020, 12(7), 1960; https://doi.org/10.3390/w12071960
Submission received: 30 May 2020
/
Revised: 2 July 2020
/
Accepted: 7 July 2020
/
Published: 10 July 2020
(This article belongs to the Special Issue Rainfall Infiltration Processes and Their Effects on Landslide Hazard)
Abstract
:In this study, an investigation on the formation mechanisms, deformation characteristics, and stability of the Outang landslide, composed by three independent blocks (O1, O2, and O3), is performed by integrating site surveys, multi-technique monitoring data, and numerical simulation. The results show that the formation mechanism for blocks O1 and O3 is slide-bulking, and is planar slide for block O2. These three blocks slide along the incompetent layers (ILs): IL1 is the slip surface of block O1 and O2, and IL3 is the slip surface of block O3. Furthermore, the west local fast movement zone might evolve into deep failure. The slope surface movement is step-like, characterized by the alternation of rapid displacement followed by imperceptible displacement over each hydrological year. The surface displacement velocities increased upslope. Based on the numerical simulation, both precipitation and reservoir water are believed as the major factors driving the slope behaviors, and the slope stability would be decreased gradually under the effect of the periodic variation of water level and seasonal precipitation infiltration. As a result of this study, some countermeasures of landslide and long-term monitoring are recommended.
1. Introduction
The failure of reservoir bank slopes, including rockfalls and landslides, is the primary geological hazard to inhabitants and transportation routes in reservoir areas that is created by the construction of hydropower stations [1,2,3]. Since the first trial impoundment in 2003 in Three Gorges Reservoir (TGR) area, China, more than 5000 landslides along the reservoir banks have been identified [4,5]. These landslides have posed great threats to the residential houses [6,7], Yangtze shipping [8], and dam stability [9]. Consequently, a better insight into the behavior, triggering and conditioning factors, and evolution processes of these reservoir-induced landslides are of paramount importance for landslide control, management, and decision-making [6,10,11,12].
Currently, more than 4000 scientific works about the landslide hazard in TGR have been published [5]. These articles have focused massive attention on (1) characterizing individual landslide cases; (2) assessing how landslide case evolved and behaved; (3) designing, testing, and installing preventive stabilization measures; and (4) monitoring geohazards and implementing early warning protocols. For the reservoir-induced landslide, the reservoir impoundment and the subsequently fluctuating of the reservoir water level are considering the main triggering factors [12,13,14,15]. The corresponding triggering mechanism could be listed as (1) the change of hydraulic boundary conditions of the slope or (2) deterioration of mechanical properties of slope-formed materials under the effect of dry–wet circulation condition [16,17,18,19]. To reduce the potential likelihood of slope failure, and minimize the loss of human life and economic effects of landslide events to the greatest extent, it is very urgent to conduct the research of planning and management of landslide hazard. A landslide hazard is defined as the probability of occurrence of a potentially damaging landslide within a specified period of time and within a given area [20], and geographical information systems (GIS) are widely used in this field [21,22,23]. For example, landslide susceptibility maps between Zigui and Badong counties in the TGR area were finished by using a gradient-boosting decision tree [24]; an analytical hierarchy process (AHP) was also used to carry out the suitability estimation for urban development [25].
In the case of the Outang landslide, some reactivated issues, such as a brief reliability analysis [26] and landslide displacement prediction [27], have been conducted. Meanwhile, the stability of the slope under different scenarios of precipitation, reservoir water, and both precipitation and reservoir water has also been conducted [28] about the Outang landslide is rare. On the one hand, lots of ancient landslides occurred thousands of years ago, which resulted in the substantial reconstruction of the original slope’s topographic and geomorphic characteristics, and change in the landslide size. Thus, it is difficult and challenging to make sense of the formation processes [29]. On the other hand, although the stability of the Outang landslide under different environment conditions has been studied by Yang et al. [28], the works on long-term stability evolution of this slope are quite sparse. Generally, long-term stability evolution is the pre-requisite for the landslide risk management and risk governance. To fortify the literature in this area, this paper presents an assessment of the long-term stability evolution of the Outang landslide.
The aims of this paper are to investigate the formation mechanism, deformation characteristics, and stability of the Outang landslide, based on a comprehensive investigation of its remaining signs, geological condition, and in-site monitoring. The long-term stability evolution characteristics under the coupled effect of reservoir water and precipitation was also evaluated. We anticipate this work could help to better understand the reactivated ancient landslide issues, and then provide some practical experience and enlightenment on the studying reservoir-induced landslide.
2. Geological Setting
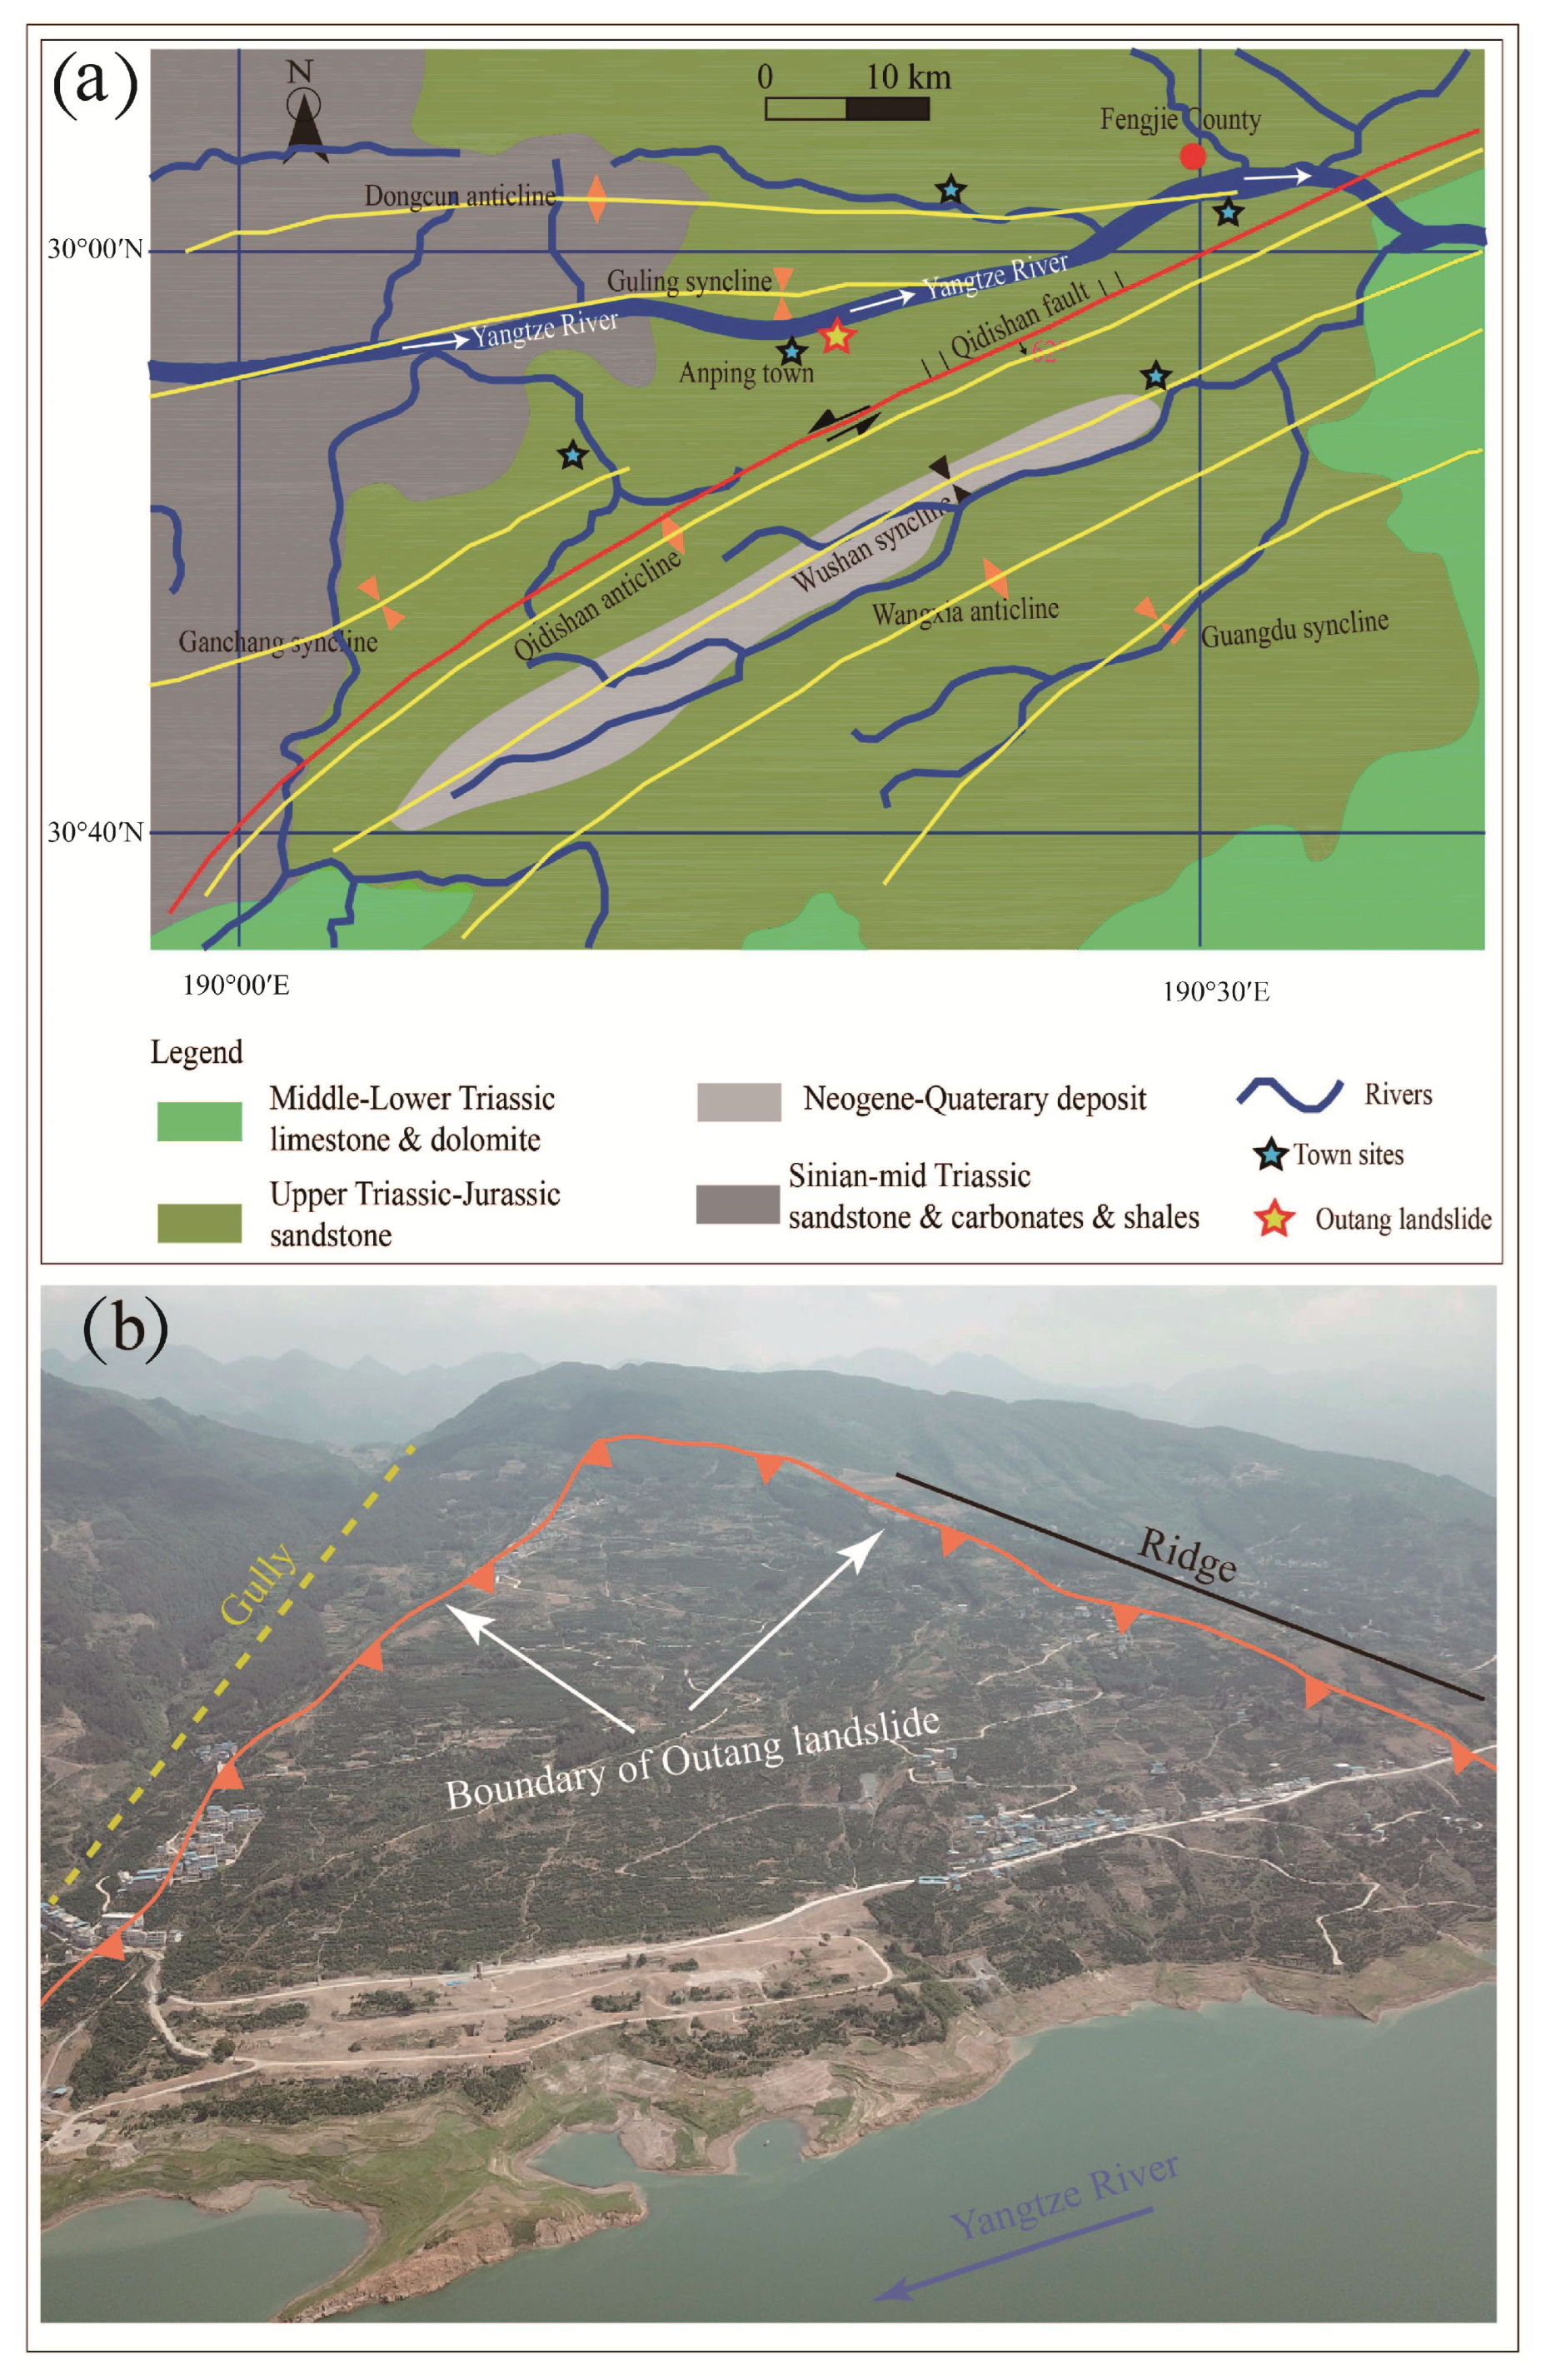
The Outang landslide (30°17′12″ N, 109°18′26″ E in Figure 1b) has been identified as a huge, deep-seated, ancient instability in the TGR area, and it occurred in the County of Fengjie, Chongqing, on the south bank of the Yangtze River, China. The climate of the study area is characterized by hot and humid summers and dry and cold winters. The average annual air temperature is between 16 °C and 18 °C, and the mean annual rainfall ranges from 987 mm to 1258 mm. The rainfall events usually concentrate in the flood season from May to September, among which the rainfall is featured with high frequency, long duration, and large cumulative precipitation. As for the water level of the Yangtze River, the lake filling of TGR has involved three periods. During the first period, from April 2003 to September 2006, the water level raised to 135 m, and then exhibited a seasonal variation lower than 5 m. During the second stage, from September 2006 to September 2008, the reservoir level increased to 156 m, and subsequently presented a seasonal variation between 145 m and 156 m. On 28 September 2008, the third period started, and the water level rose to 172 m by 14 November 2008. On 26 October 2010, the reservoir level reached its maximum designed elevation of 175 m. On a hydrological year basis, the reservoir water level fluctuates from 145 m during the wet season (May to September), for flood control, and up to 175 m during the dry season (October to April) for hydropower generation.
The study area (Figure 1a) belongs to the secondary tectonic unit of the upper Yangtze platform, and the secondary tectonic unit is composed of an anticline–syncline structure system. The strike of the geological structures in the study area is mainly the NE–SW direction (Figure 1a). The geology of the study area mainly consists of the Pre-Sinian crystalline basement and the supra-crustal sedimentary cover [30,31]. The crystalline basement is mainly composed of magmatic and metamorphic rocks, and outcrops only sporadically. The sedimentary widespread cover is composed of thick bulk limestone and dolomite, interbedded with thin layers of sandstone and shale. The bedrock in the area consists of a sequence of sedimentary rock units that correspond to the transition of the Middle Triassic to the Holocene. The severe river incision across the massive limestone mountains of the Lower Palaeozoic and Mesozoic age has resulted in a series of gentle slopes composed of colluvium from the limestone cliff.
3. Methodology
A combination of the field mapping, geological survey, monitoring network, and numerical modeling were used in this study. The landslide was mapped in detail at a scale of 1:200, and the geomorphic characteristics, such as slope altitude, location, and geomorphology of the landslide area, were studied. Geological surveys, including the horizontal adit, borehole, and trench explorations, were applied to reveal the material and structure of the accumulation mass. A total of 15 boreholes, reaching significant depths (ranging from 29.6 to 131.1 m) of the incompetent layers, have been drilled to obtain the lithology, components, and thickness of each deposited layer. One horizontal adit with a total length of 342 m and five trench sites (1.2–4.7 m in length 1.0–1.3 m in width and 0.5–3.6 m in depth) were used to define the formation and structural characteristics of the landslide deposit.
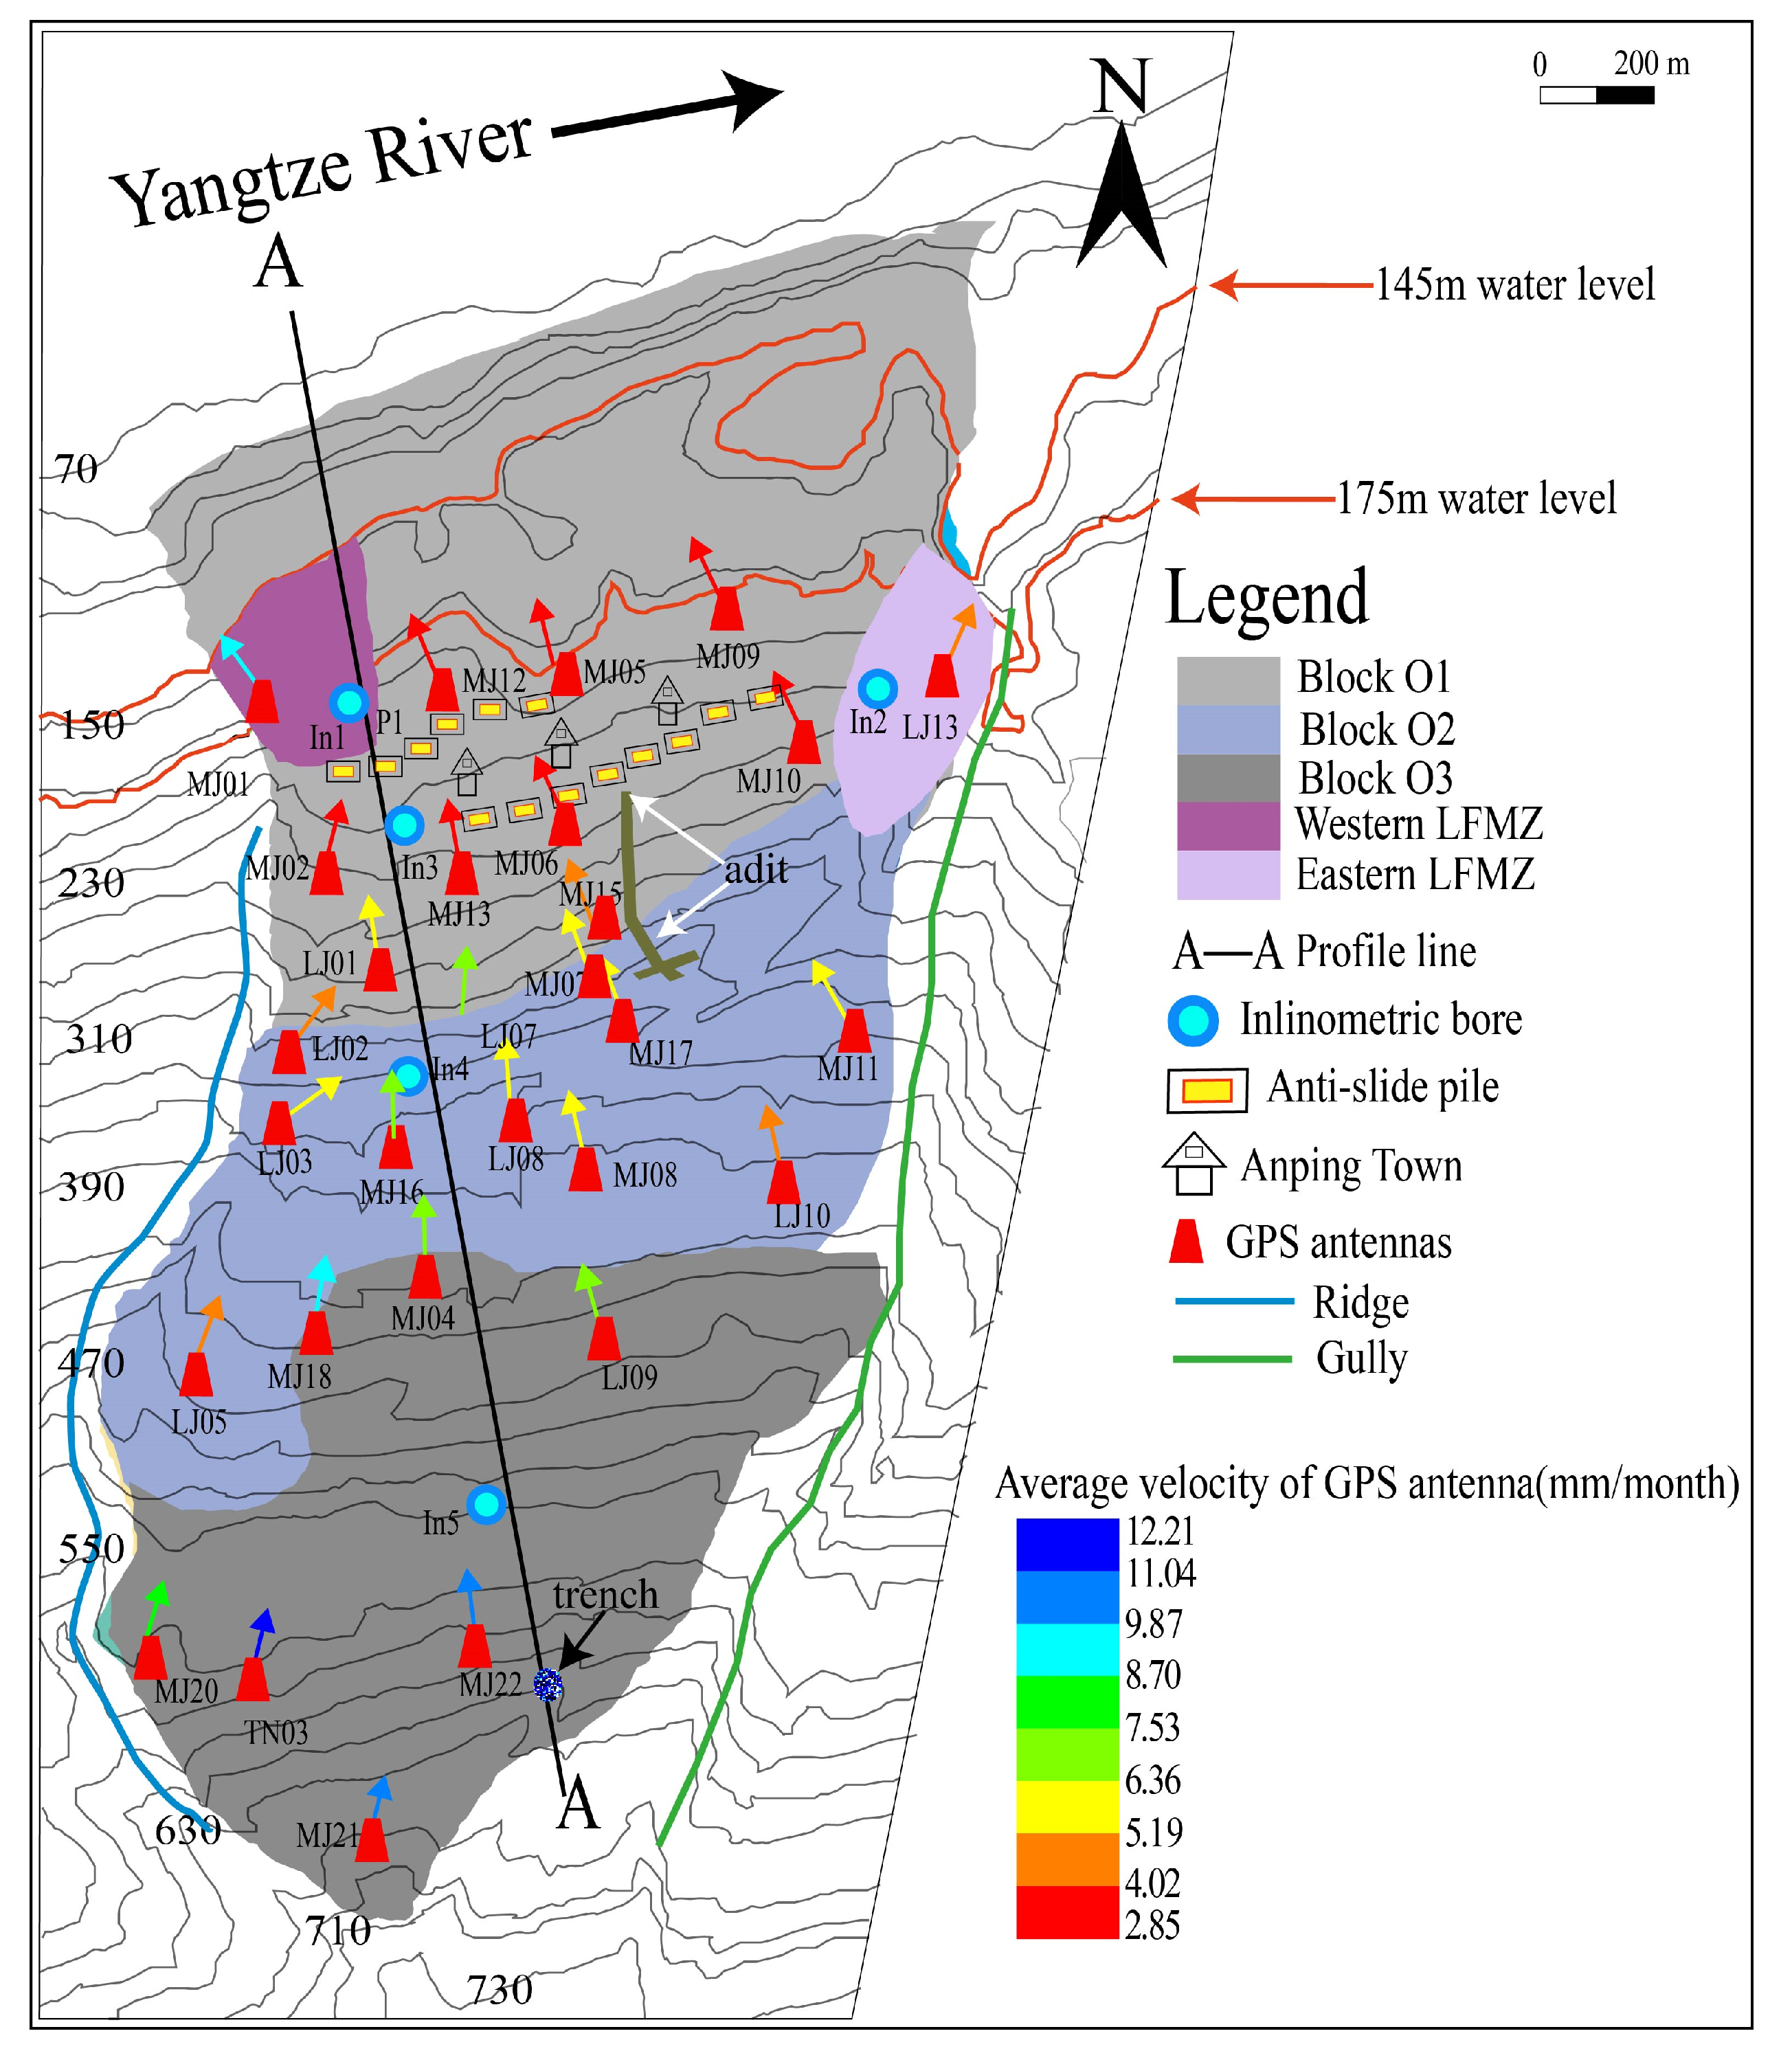
The systematic monitoring scheme consisted of two sub-monitoring items, namely surface displacement and deep displacement, with their locations marked in Figure 2. For the surface displacement, 30 global positioning system (GPS) sites were selected to measure the absolute displacement between December 2010 and April 2017. For the deep displacement, a total of five inclinometer casing tubes were used. In1 and In2 are located at the both sides of the landslide foot. In3, In4, and In5 are installed along the profile line A–A. The recording started on July 2011 and terminated at December 2013.
The GEO-STUDIO software [32] was used to perform the investigation of seepage and long-term stability evolution under the influence of seasonal precipitation and periodic variation of reservoir water. In this section, both the SEEP/W module and SLOPE/W module were used. The former is used for the presentation of seepage hydrology conditions, and then the derived data of seepage hydrology conditions were used in the SLOPE/W module for the evaluation of the slope stability. Morgenstern and Price’s method was selected to calculate the factor of safety (FOS). The hydrological data (reservoir water and rainfall) from December 2010 to April 2017, obtained from the weather station of Fengjie County, were incorporated to in the numerical simulation.
4. Results
4.1. Materials and Accumulation Features of the Landslide
4.1.1. Material Composition and Structures
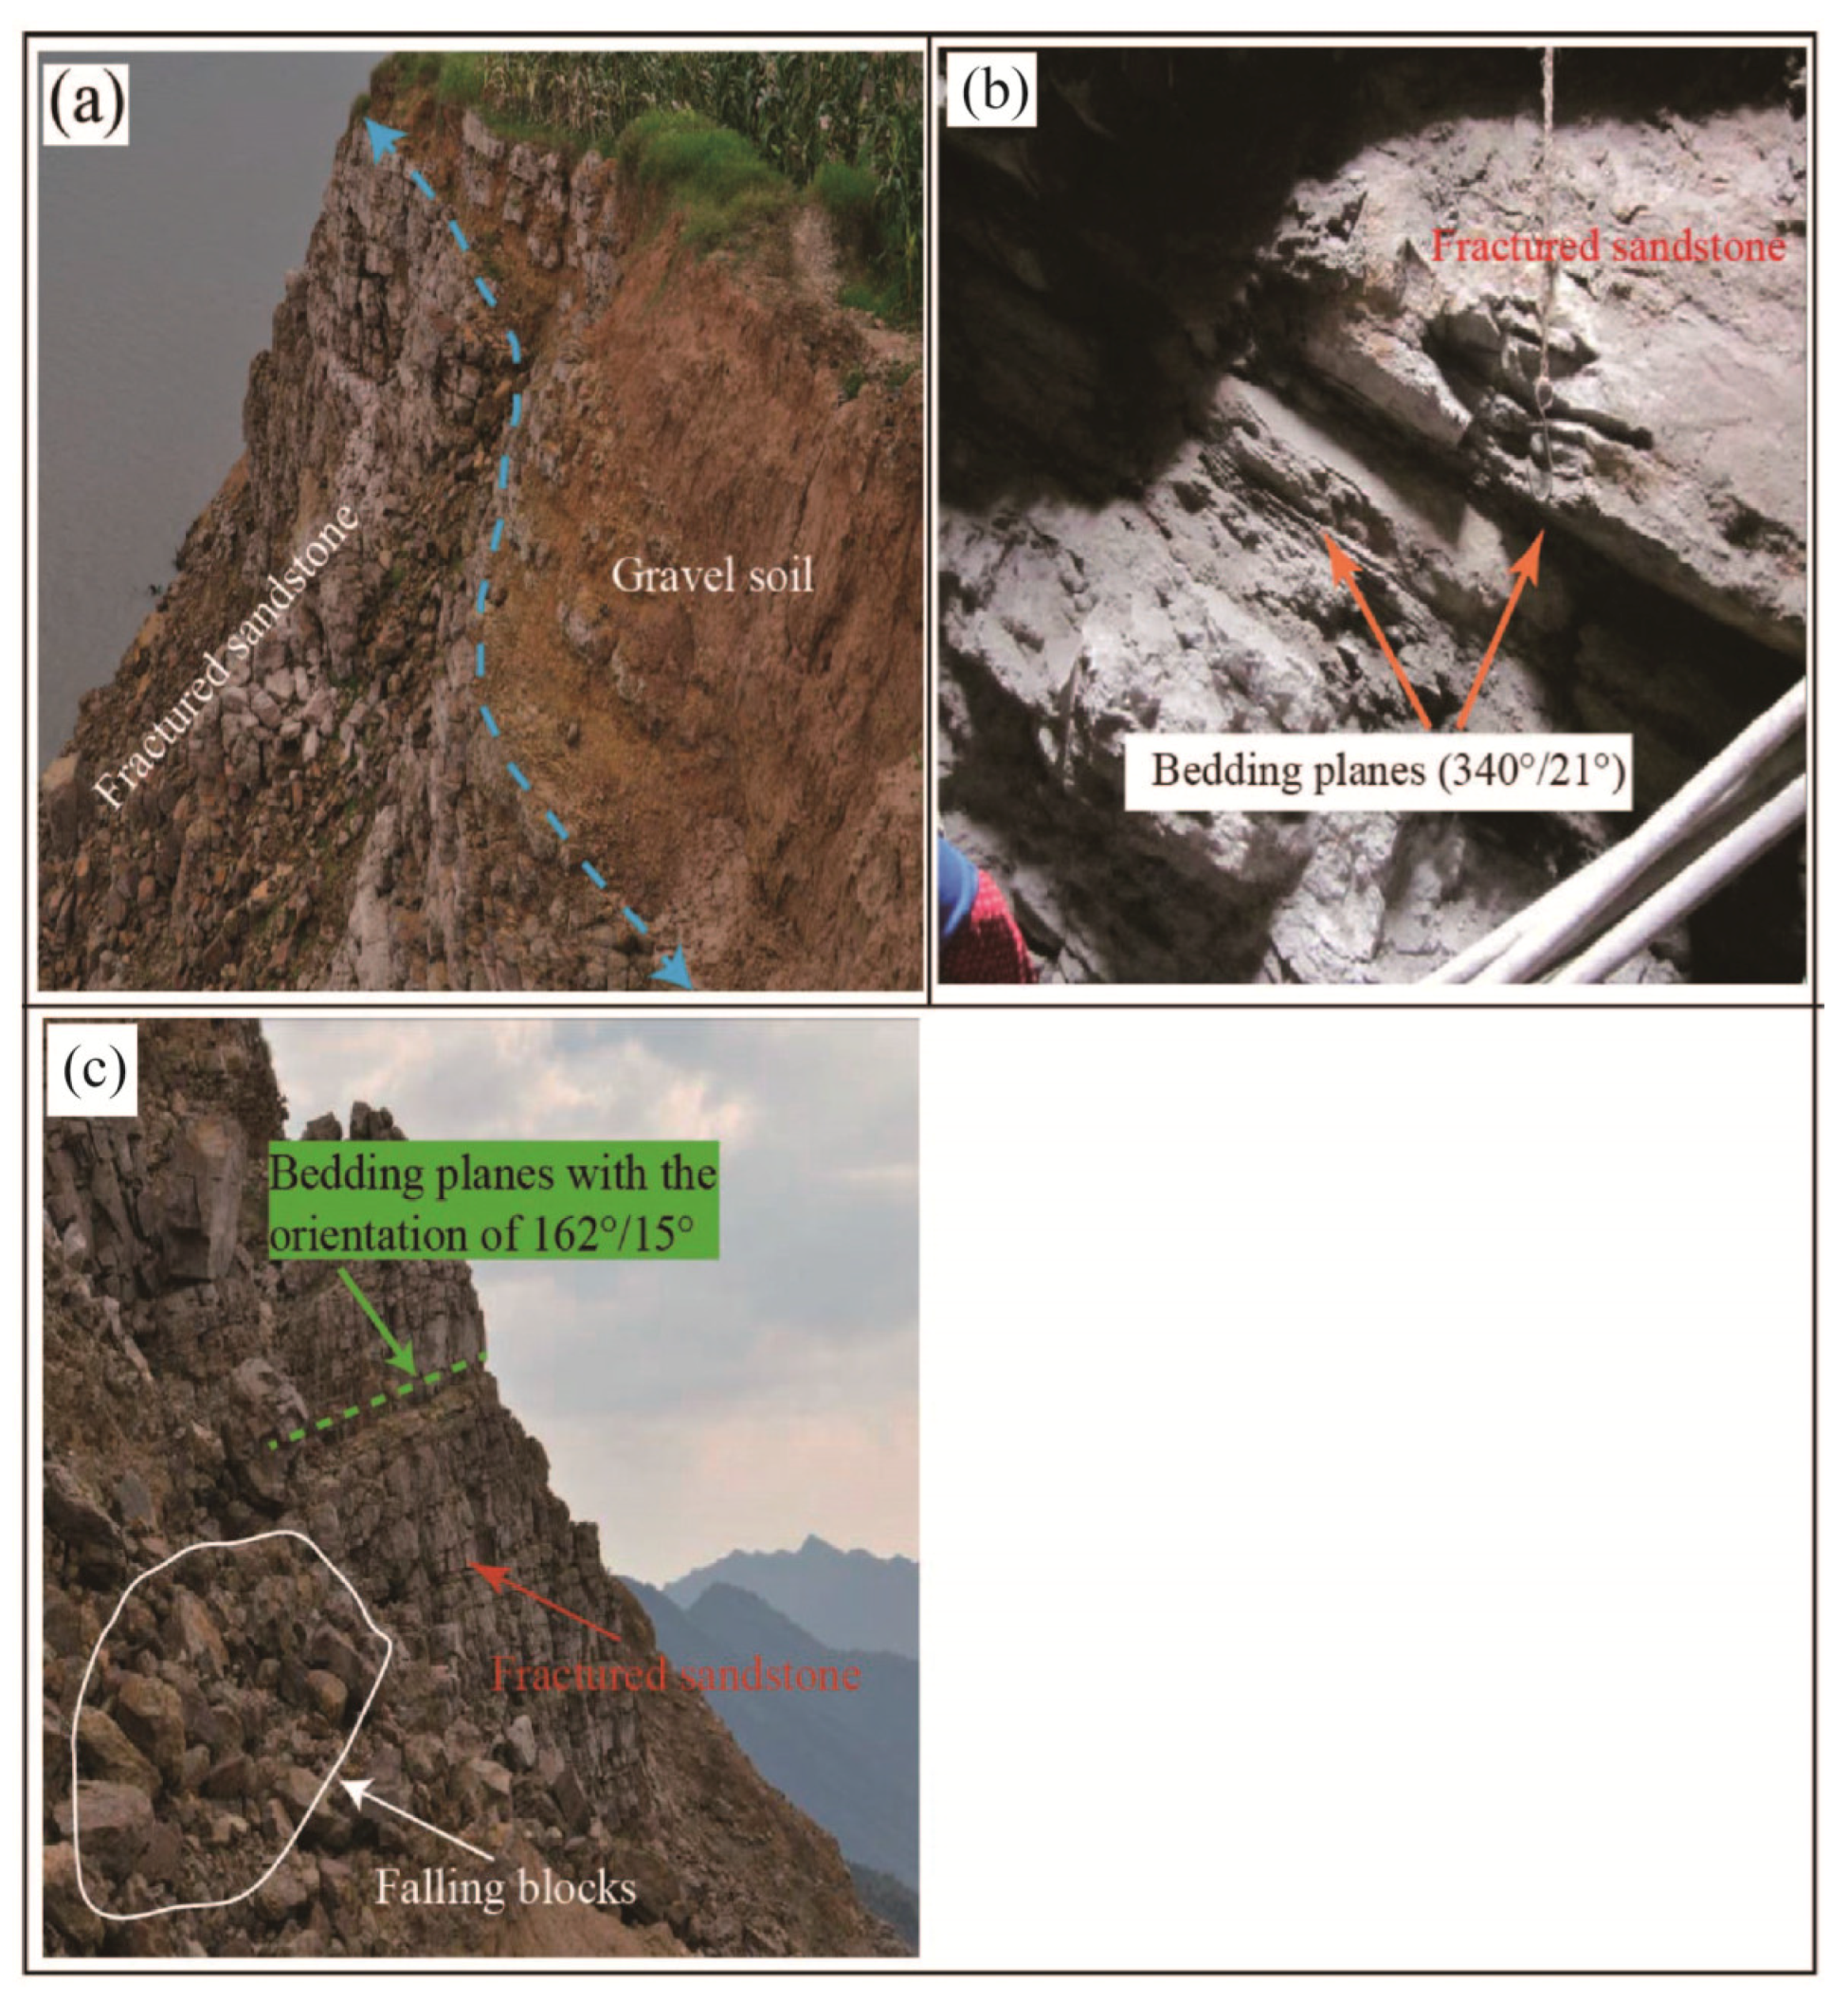
The sliding material of the landslide mainly consists of surficial quaternary deposits and fractured sandstone. As shown in Figure 2, the Outang landslide has an inverted bell-like shape in plain view, with a front elevation of 90–102 m and a crown elevation of 705 m. It has an estimated volume of 90 Mm3, covering an area of 178 × 106 m2. Τhe total length and average thickness of this instability is 1800 m and 50.8 m, respectively. The thickness of surficial deposits is between 0.2 m and 35 m, which increases toward the toe. Some unirrigated fields distributed on the slope surface are the main income of the local residents. The surficial deposits consist of gravel soil (Figure 3a) in a loose state. The gravel is composed of sandstone and siltstone (blocks), with a size of 1–40 cm, which represents as much as 60% by the weight of the total gravel soil. The fractured sandstone has a thickness between 10 m and 95 m (occasionally exceeding 110 m at the toe). The structure of the fractured sandstone behaves in stratified or stratoid beds and shows “spoon-like” shape on the cross-section, which is featured with the alternation of dip directions of 335–350° (Figure 3b) and 155–170° (Figure 3c). The former (335–350°) coincides with the slope aspect, while the latter (155–170°) is opposed to the slope aspect.
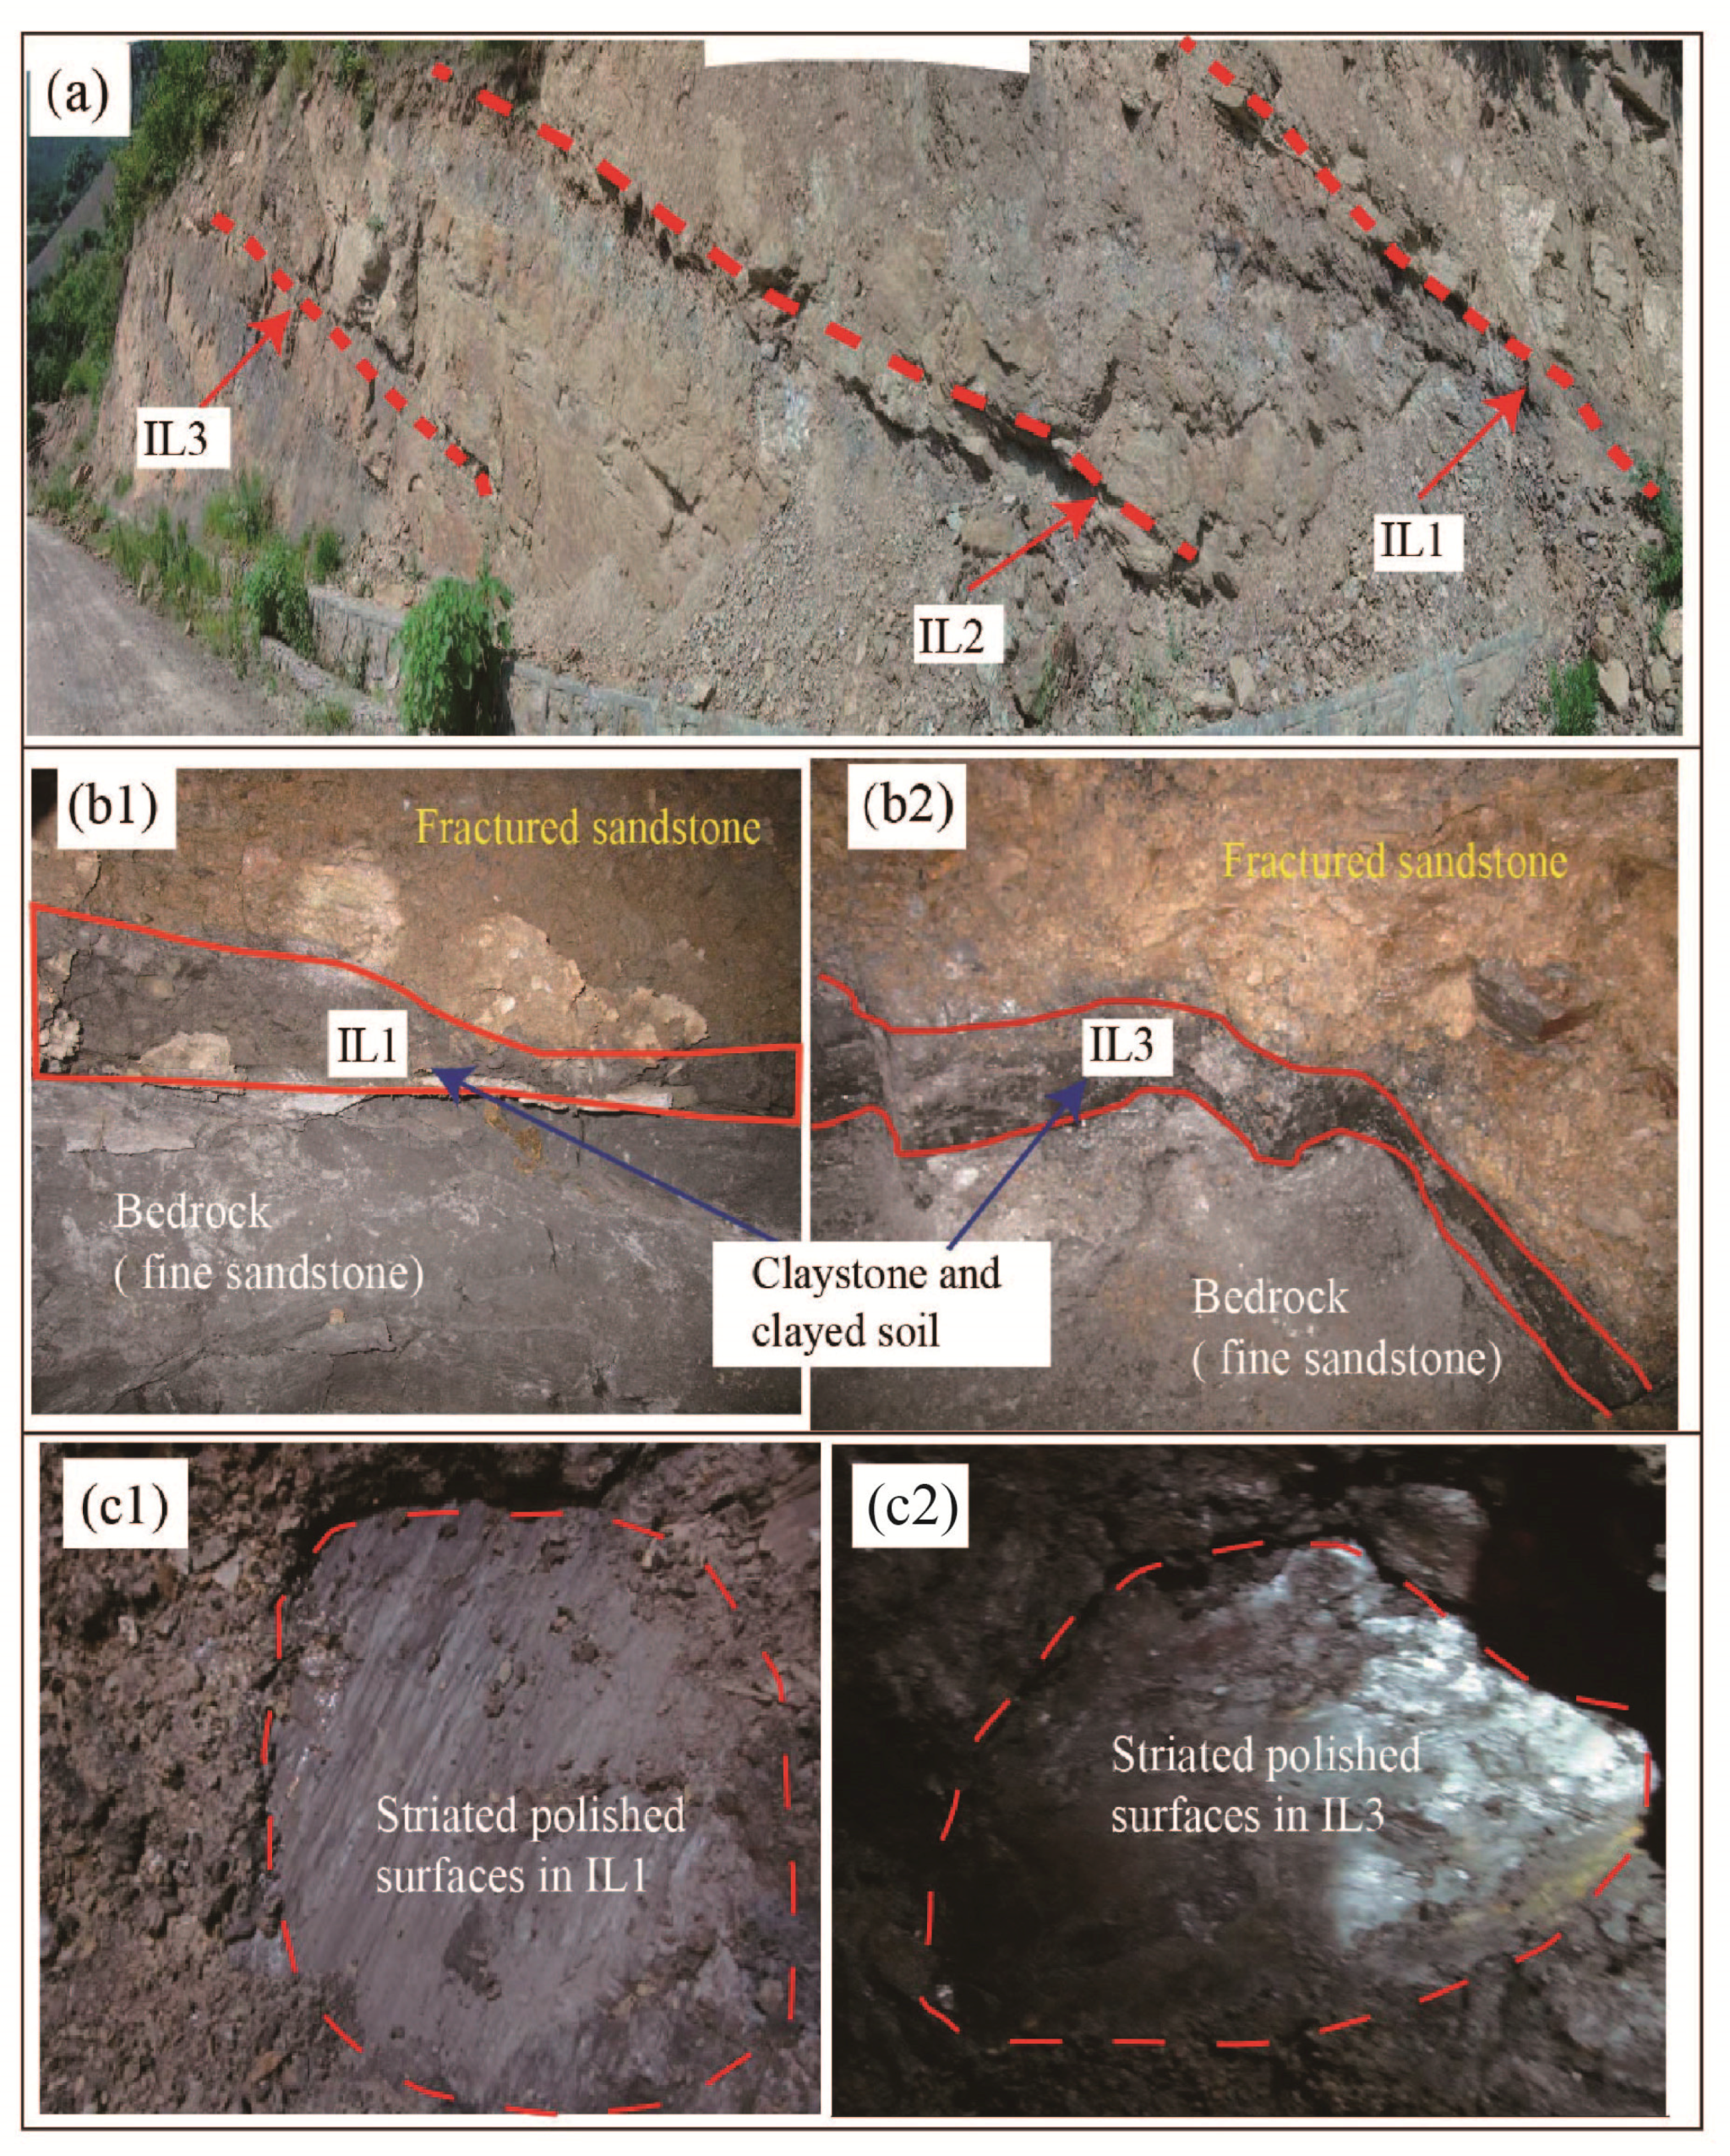
The slip surfaces of this landslide are three existing incompetent layers (ILs; Figure 4) found during field investigations. Each IL has an accordant attitude of 335–350°/18–24° and a similar thickness of 5–20 cm. The components of the ILs are dark gray claystone and clayed soil, interbedded with coal and shale occasionally (Figure 4b1,b2). Both IL1 and IL3 are the interfaces between the sliding mass and bedrock, because the striated polished surface, which is assumed to be evidence of a slip surface, could also be identified in IL1 and IL3 (Figure 4c1,c2). The apparent age of the landslide was ascertained by performing a series of electron spin resonance (ESR) tests. The results from ESR suggested that the low part occurred about 120,000–130,000 years ago, the middle part followed about 49,000–68,000 years ago, and finally the upper part occurred about 47,000–49,000 years ago, which may indicate that the Outang landslide is composed of three sub-landslides formed in different periods.
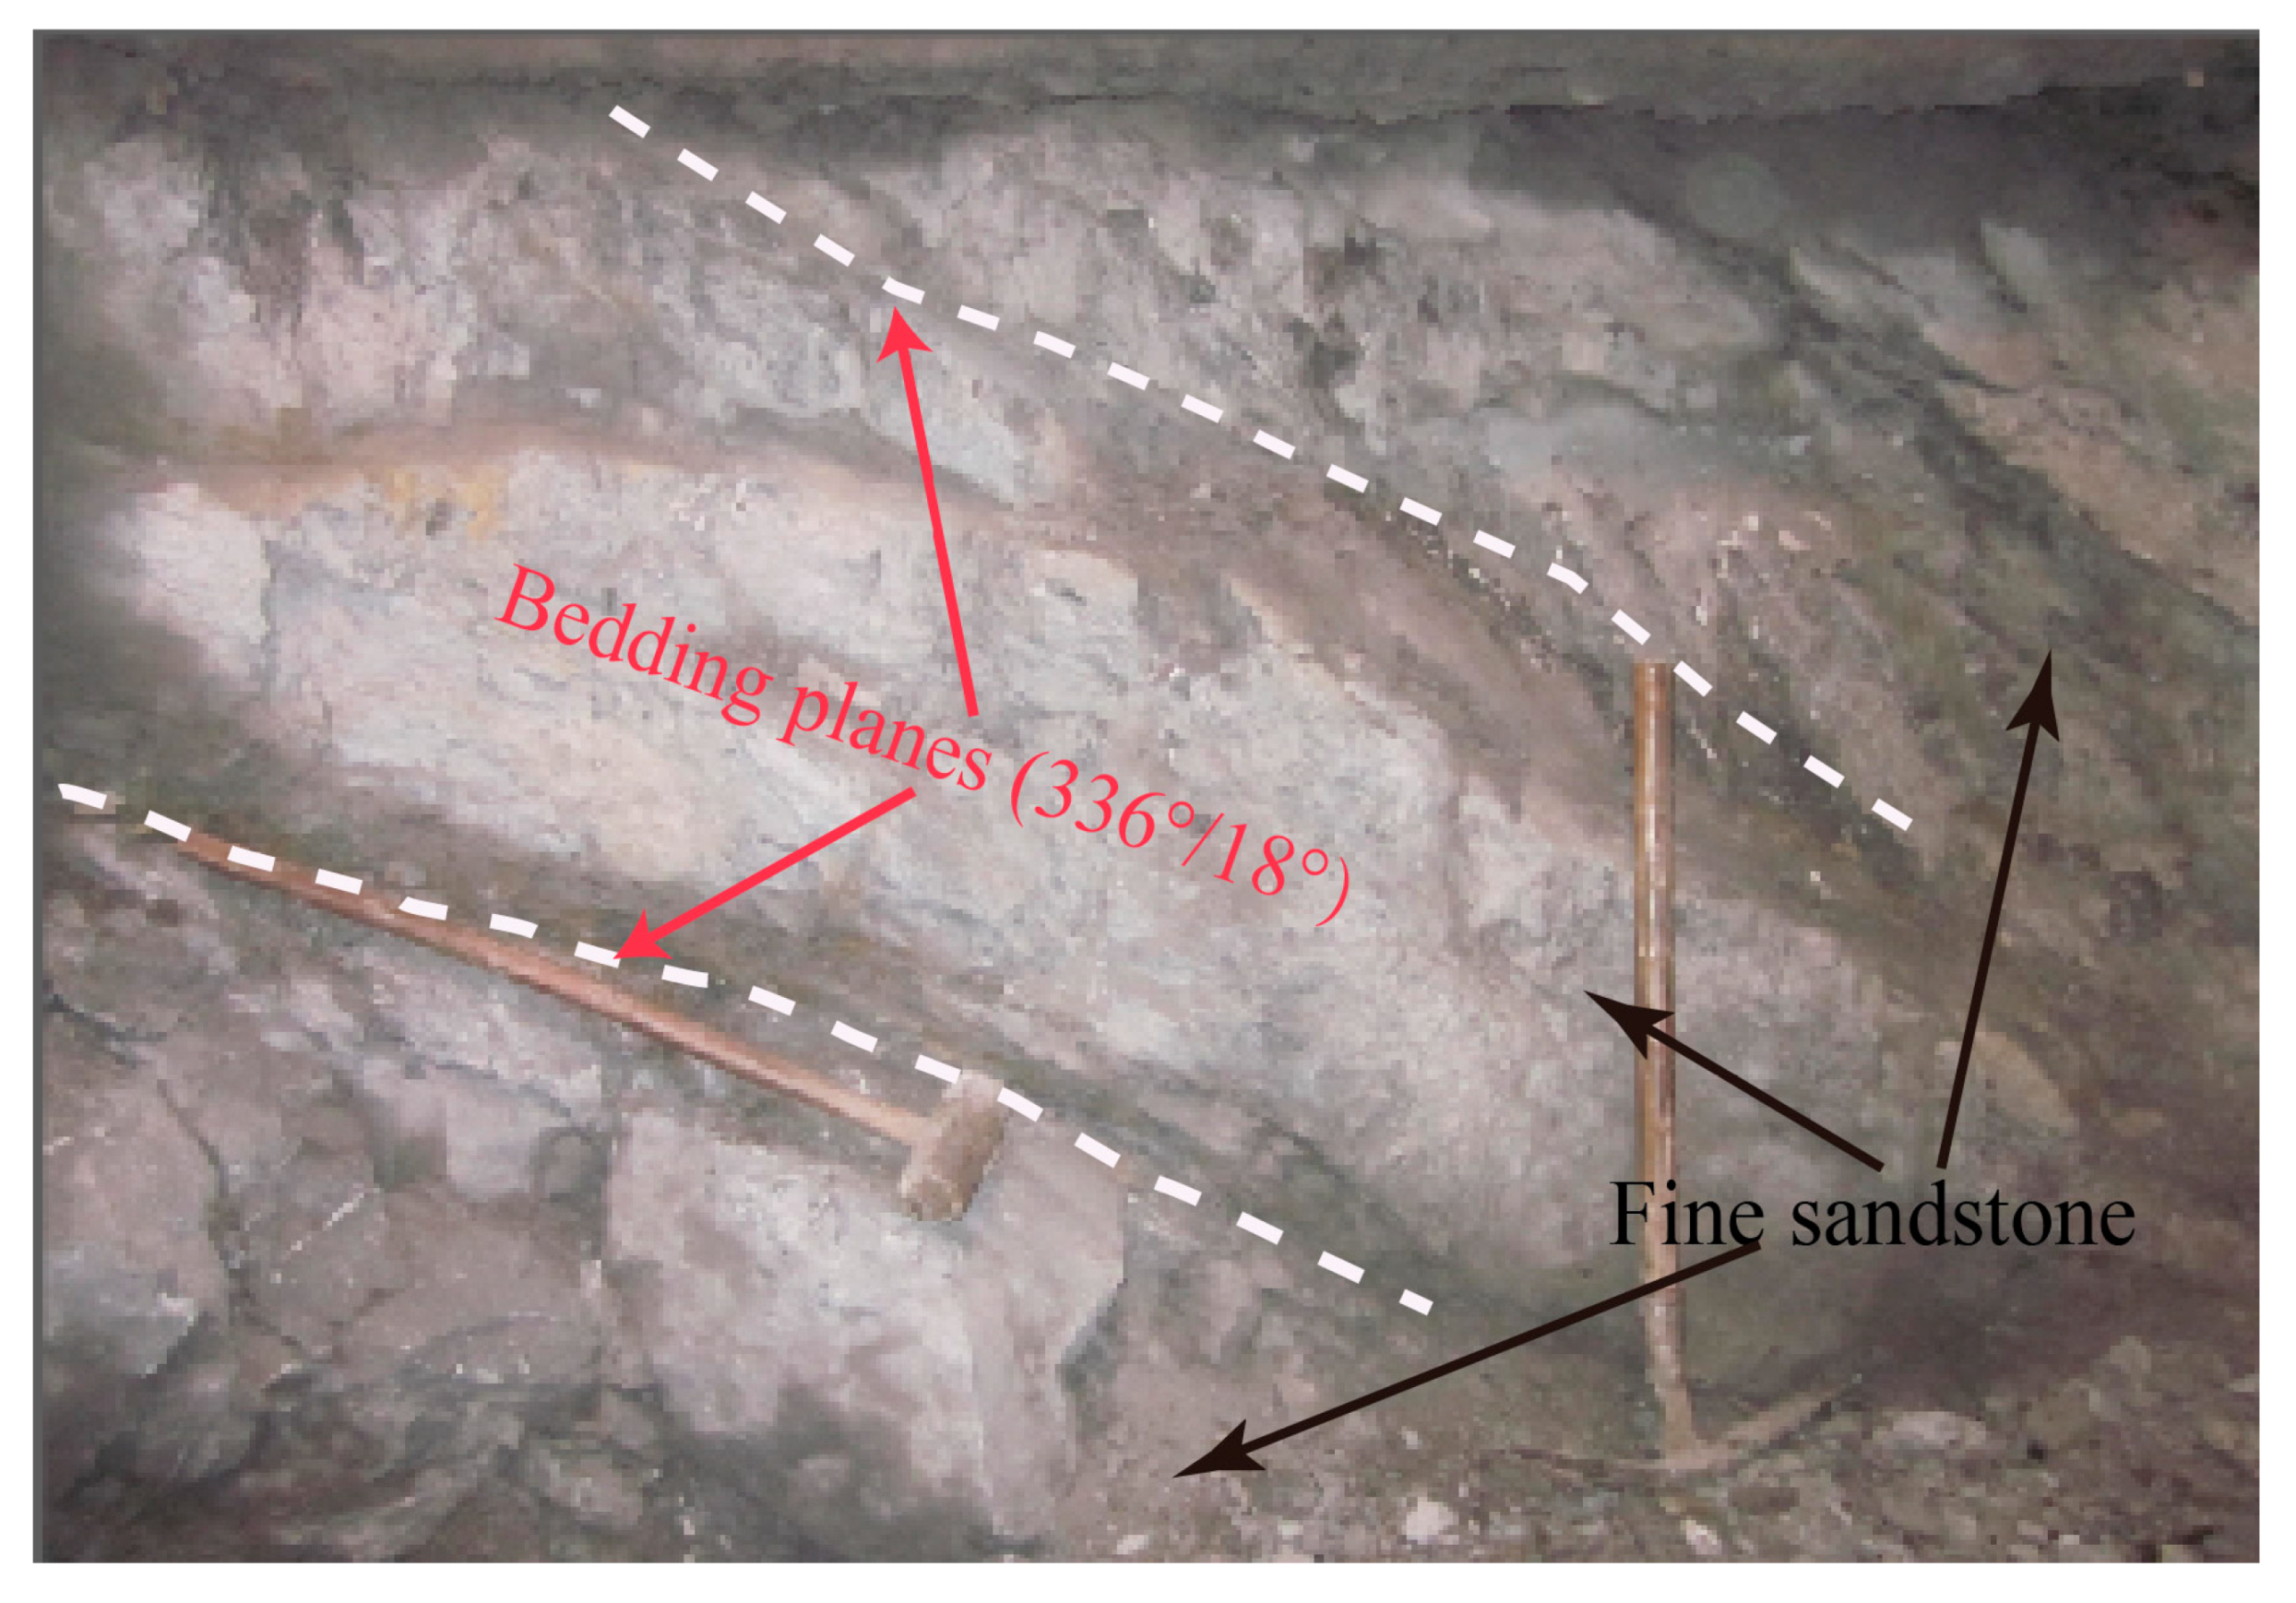
The bedrock is constituted by fine sandstone strata of the Lower Jurassic system (J1z). The dip angle of bedrock is approximately 18–24°, and the dip direction of bedding planes in the bedrock is about 335–350°, which coincides with that of the slope surface (Figure 5).
4.1.2. Accumulation Features and Reactivated Signs of Active Parts
According to the materials and structures of the landslide, ERS experiments results, and previous studies [26,28,33], the ancient landslide consist of three independent blocks (marked blocks O1, O2, and O3). The displaced materials in each block are similar, and composed of gravel soil and fractured sandstone. The structure of fractured sandstone in each block presents a “spoon-like” shape in the longitudinal section (Figure 6).
As shown in Figure 2, block O1 has an inverted bell-like shape, and extends from an elevation of 90–102 m at the toe to 300–370 m at the crown. The planar area and the volume of O1 is approximately 0.922 million m2 and 64.8 million m3, respectively. Notably, the rear part of block O1 is covered partly by block O2. The surficial deposit for O1 has a thickness of 10–35 m, and the fractured sandstone layer presents a mean thickness of 62 m. Adit exploration revealed that the block O1 slid along IL1, which has a thickness of 3–15 cm. Most of the low–flat terrain concerning block O1 has been submerged by reservoir water since the impoundment. Under the persistent impacts of fluctuation of reservoir water levels, its surficial morphology has changed, with some active signs. At both sides of the toe, two local fast movement zones (abbreviated LFMZs, Figure 2) with a total volume of 4.1 × 10⁶ m3 have been identified. These two zones have been deforming, with some local collapse (Figure 6a). Additionally, the movement of O1 has also led to extensive damage, as well as loss of properties and the town’s houses (Figure 6b).
The middle part of the landslide is block O2 that has a toe elevation of 250–300 m and a rear elevation of 400–530 m, covering an area of 0.316 million m2 and a volume of 11.2 Mm3. As shown in Figure 6, it has a mean thickness of approximately 32 m, among which the surficial deposit is less than 6 m. Borehole records indicated that block O2 slid along IL1. The frontal boundary is formed by a small cliff with the exposure of fractured sandstone (Figure 6c). The west and east boundary is ridge and gully, respectively (Figure 1b). Notably, the rear part of block O2 is covered partly by block O3. After the reservoir impoundment, a long and uninterrupted fracture has been found (Figure 6d). The occurrence of local subsidence is frequent after the heavy rainfall season. As can be seen the Figure 6d, two local subsidence sites occurred during the heavy rain in early July 2013.
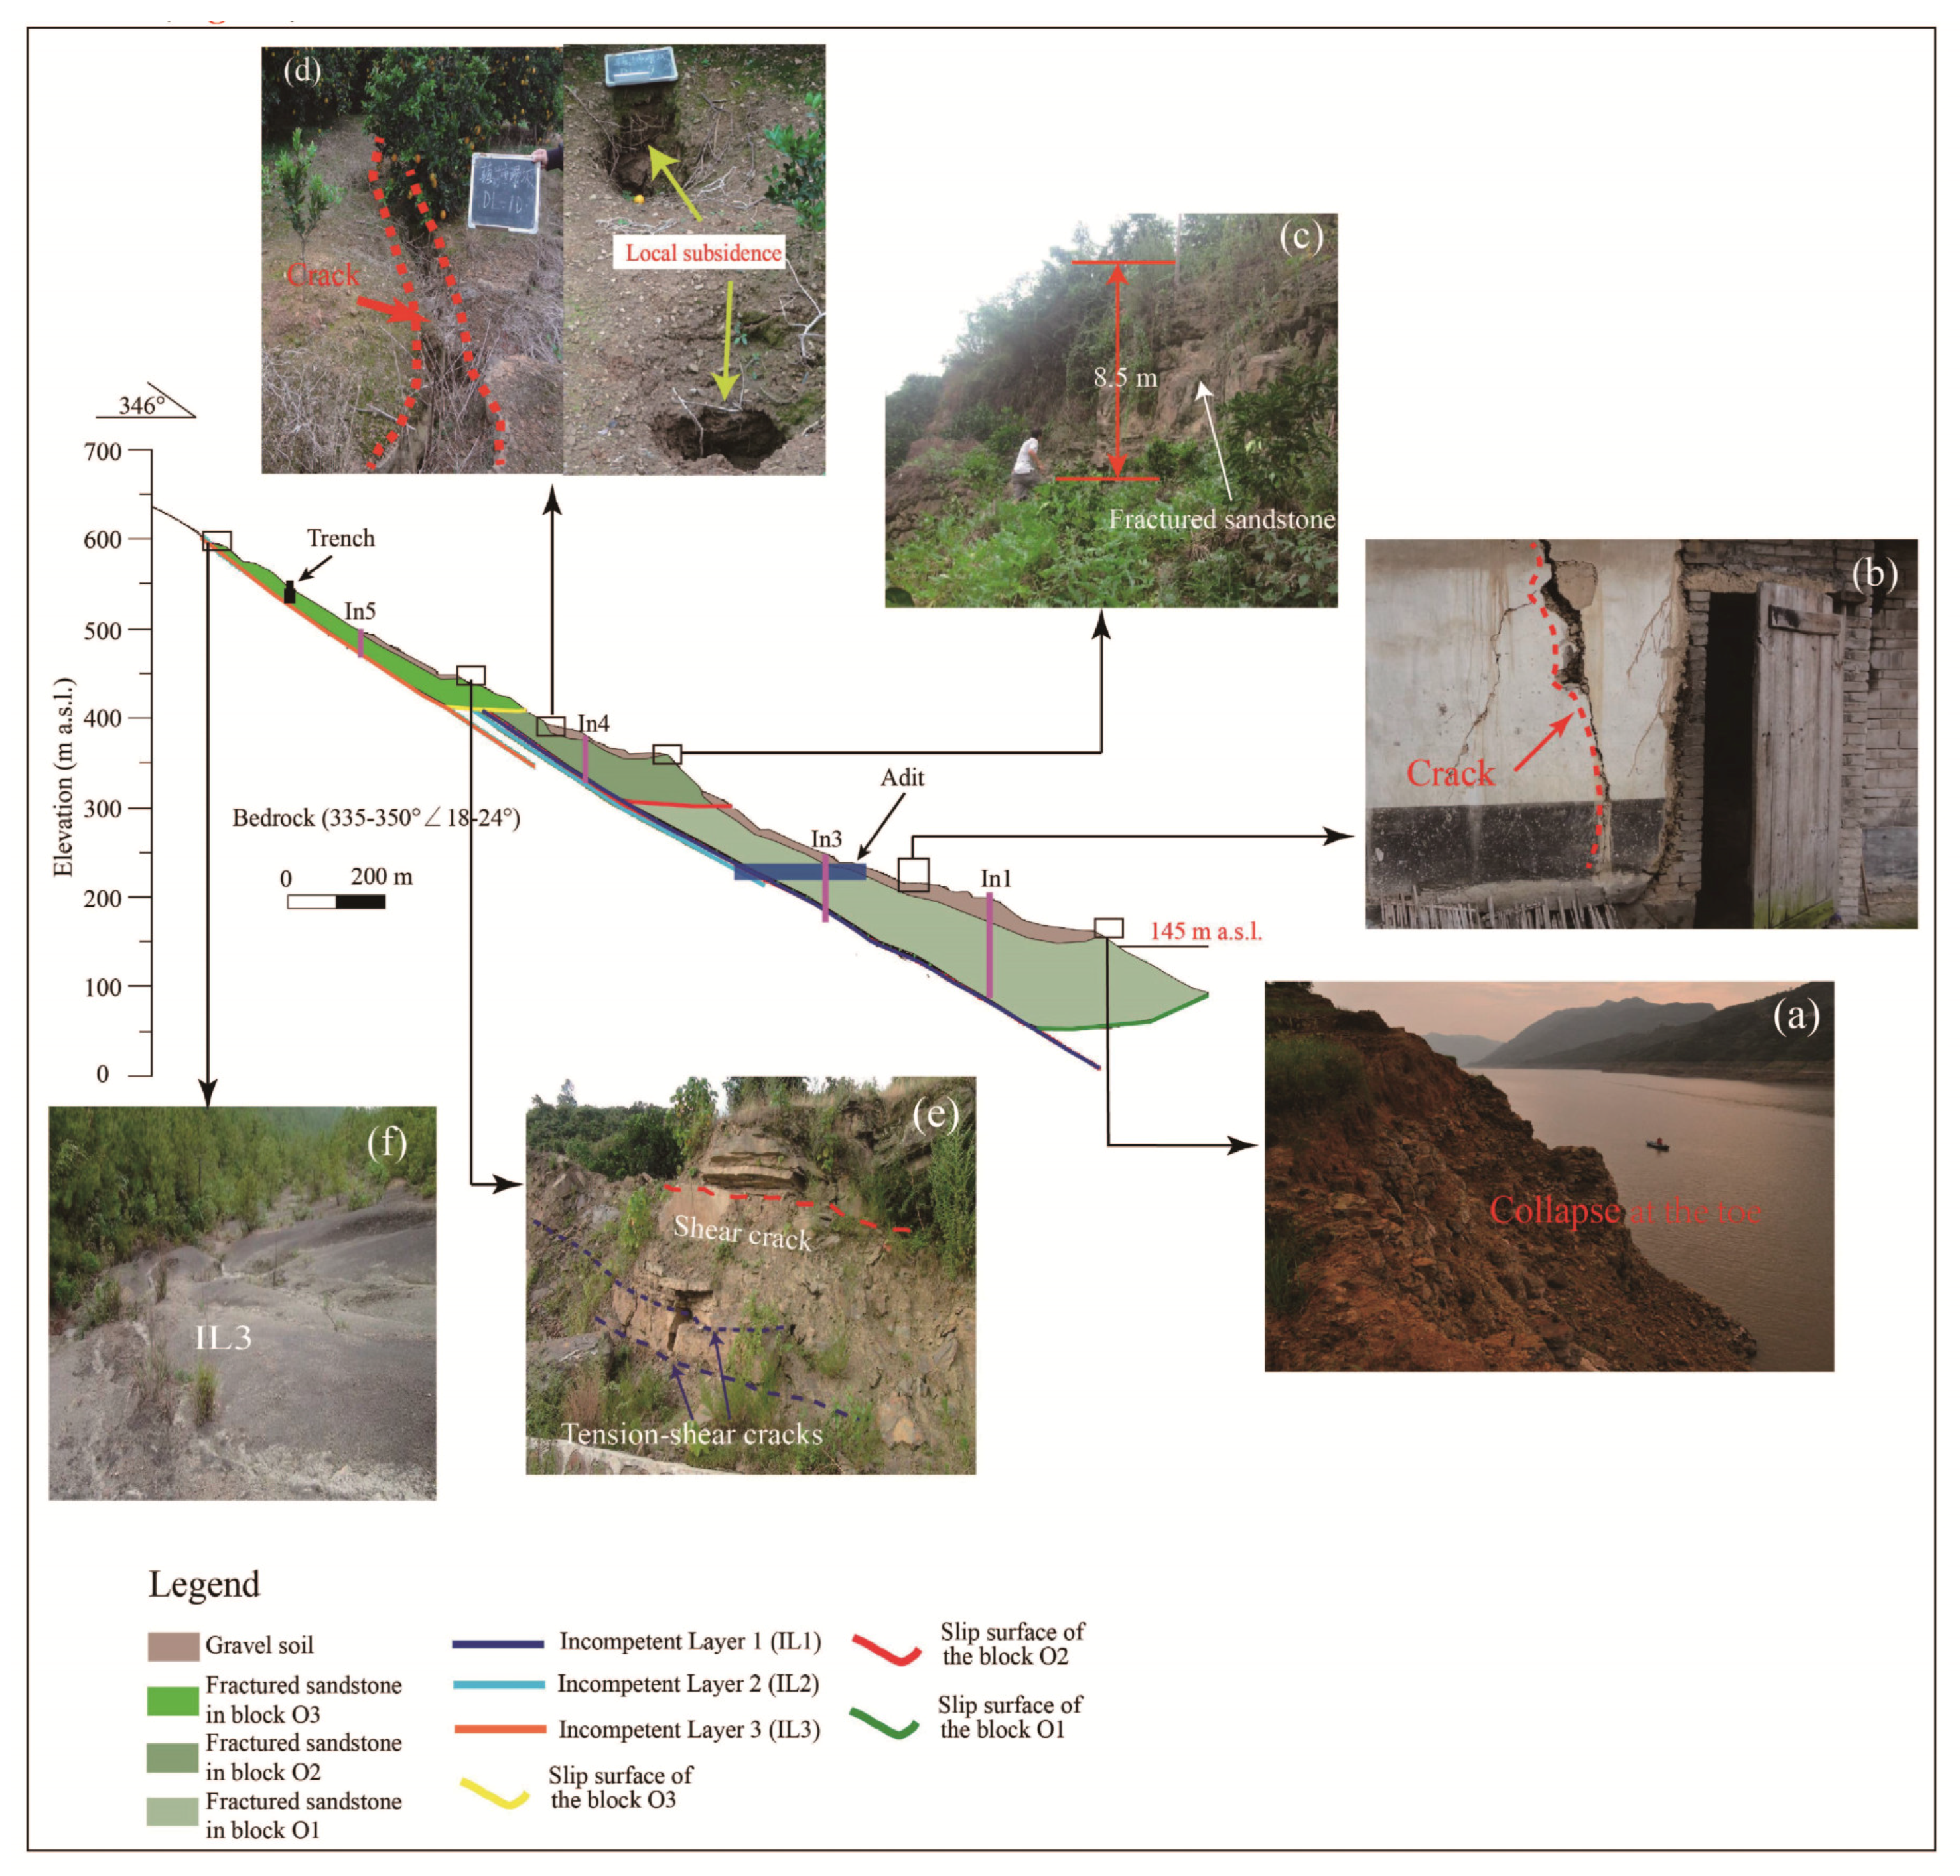
Block O3 is located at upper part, with a total area of 0.54 million m2 and volume of 14.5 million m3. The length and width of this zone is 640 m and 830 m, respectively. It has a toe elevation of 400–530 m and crown elevation of 705 m. The surficial deposit is extremely thin (less than 1.2 m). Trench exploration revealed that block O3 moved along IL3 with a significantly striated shear plane (Figure 4(c2)). Likewise, many reactivation signs were also exhibited at this block, which is bounded by a scrap with the daylighting of IL3 at the rear part (Figure 6f). A small cliff with fractured rock mass and many cracks were found at an elevation of about 408 m, which is the frontal boundary of this block (Figure 6e).
4.2. Deformation Characteristics of the Landslide
4.2.1. Deep Deformation Characteristics
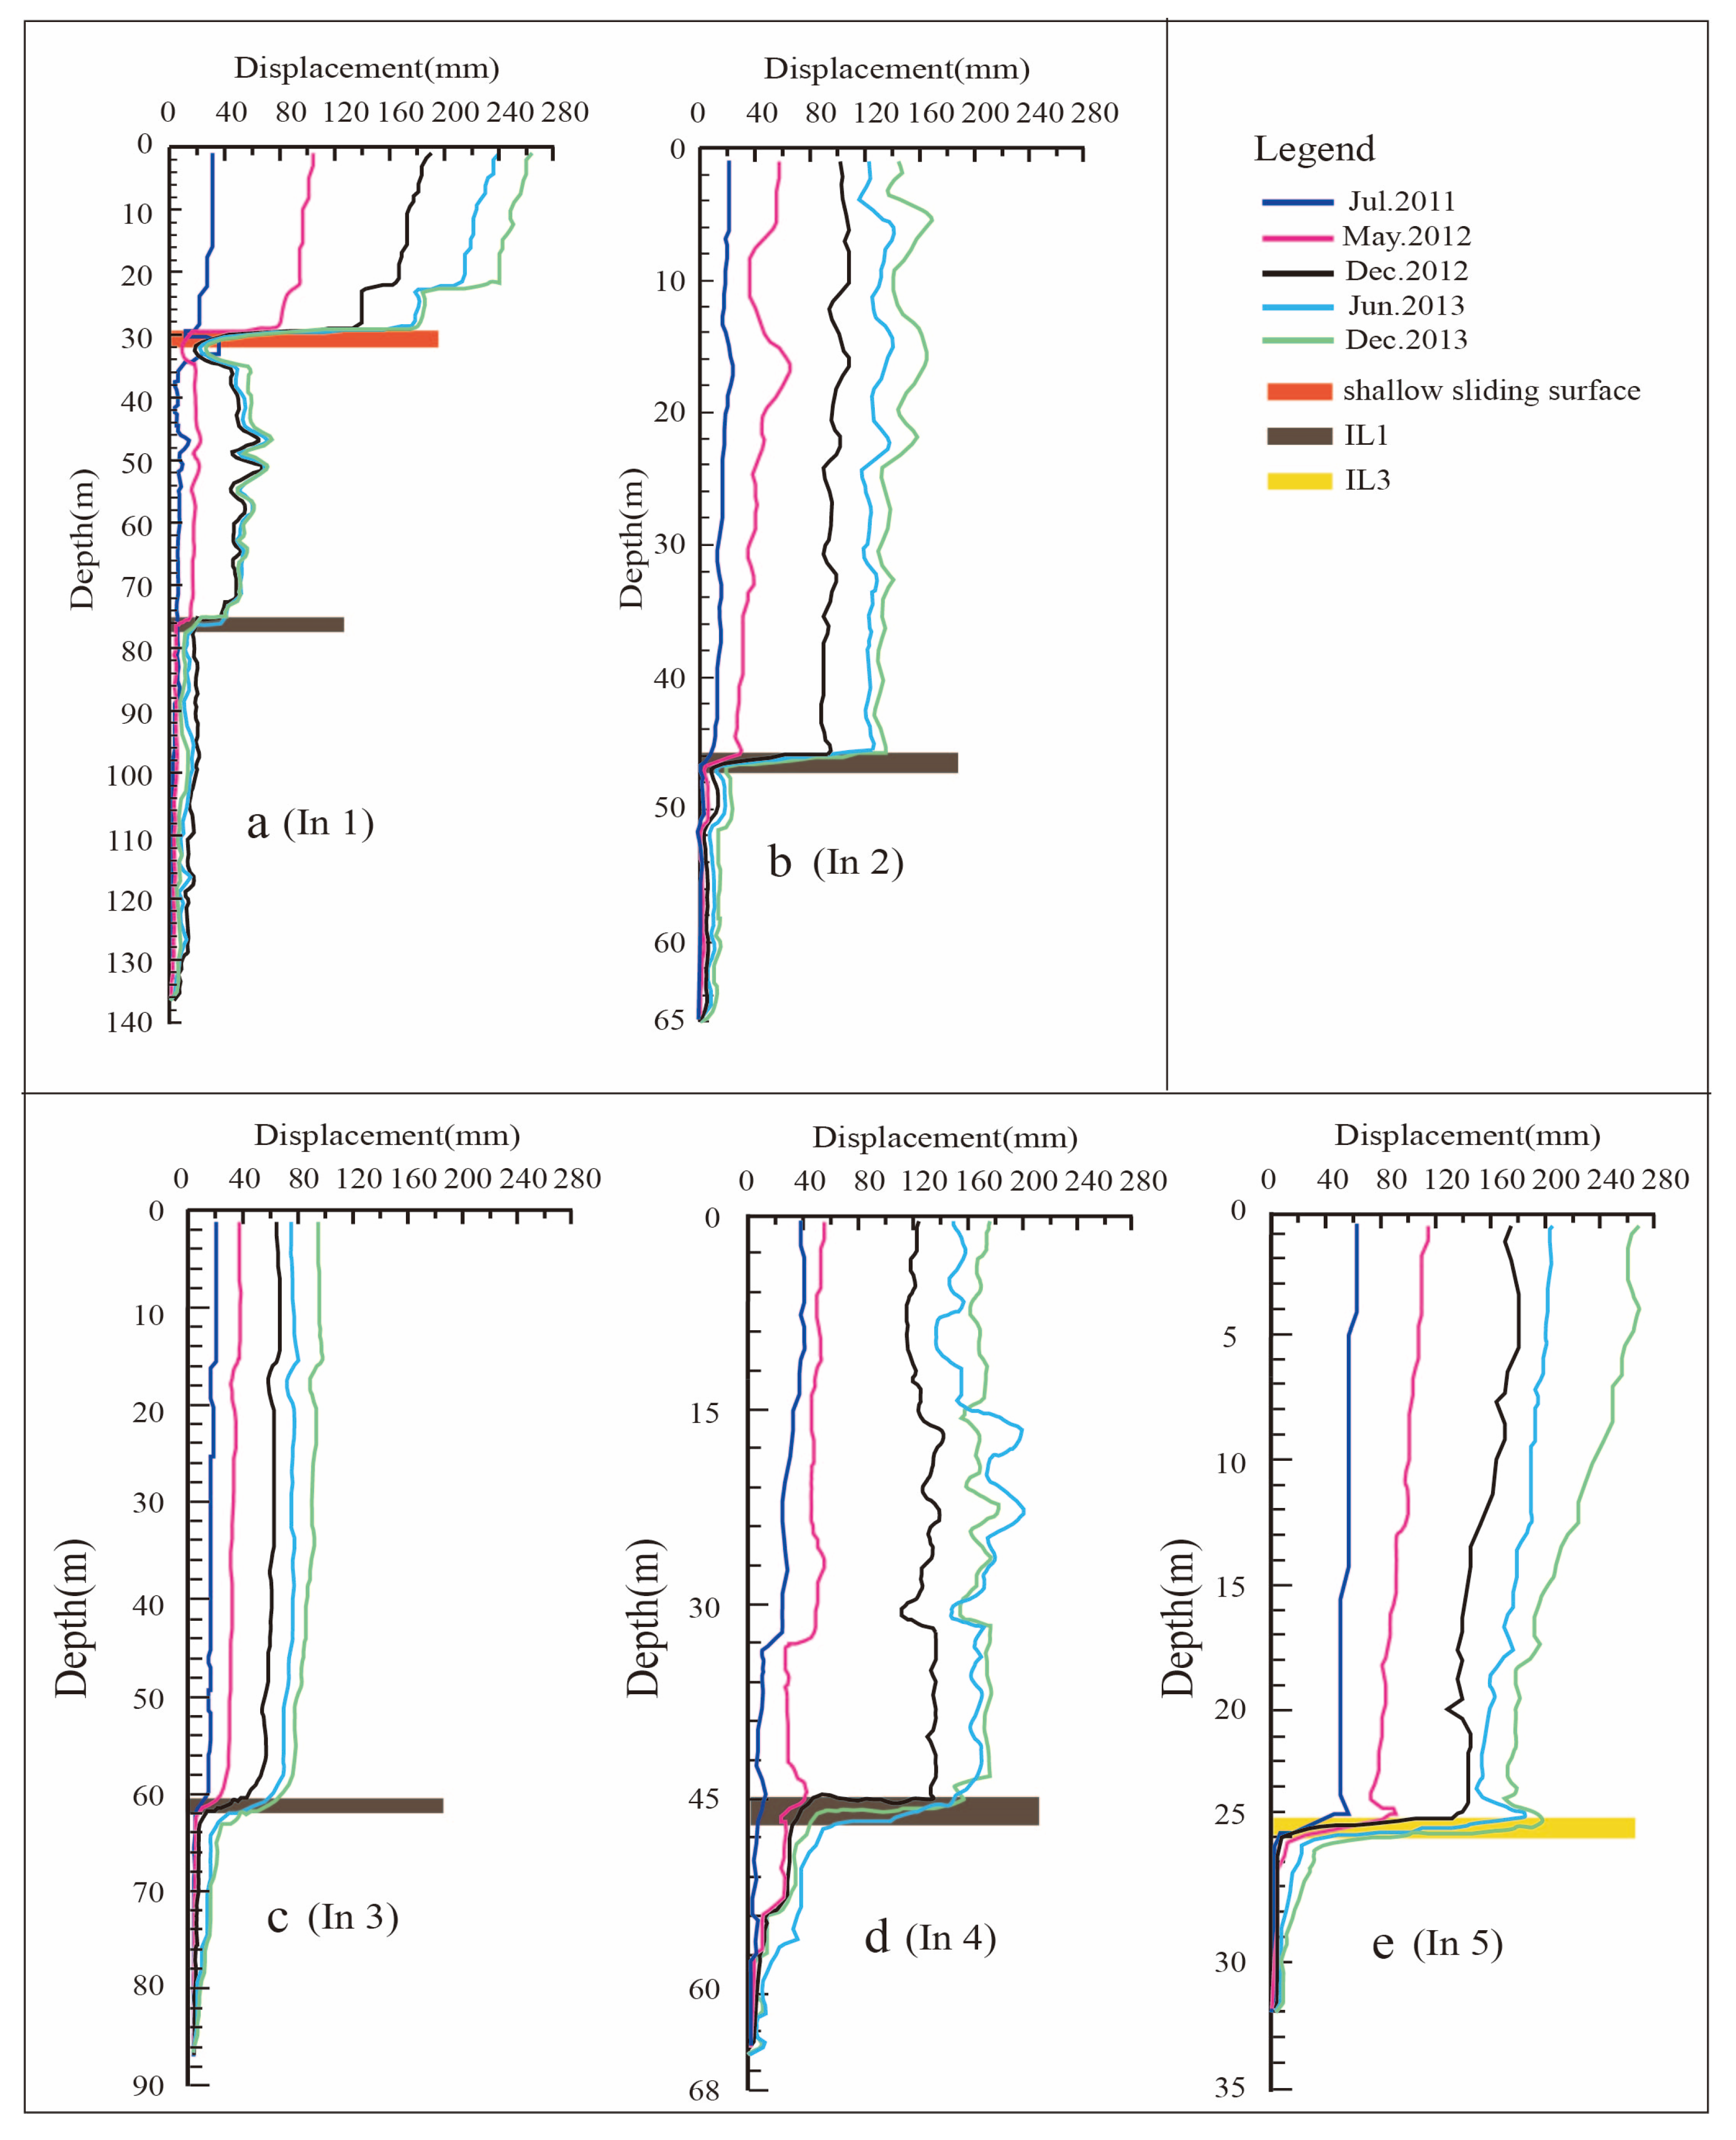
Figure 7 illustrates the deep displacement data from five inclinometer casing tubes (Ins). In1 and In2 were located at the western and eastern LFMZs, separately, while In3 was placed in block O1, In4 in block O2, and In5 in block O3. In In1 (Figure 7a), data indicate that there are two sliding surfaces in the western LFMZ. The location of the shallower sliding surface is consistent with the interface between surficial deposits and fractured sandstone. The deep sliding surface for the western LFMZ is IL1, which is also the sliding surface for the eastern LFMZ (Figure 7b). The displacement profiles for the other three inclinometers installed on different blocks show that the cumulative displacement increased toward the upslope (Figure 7c–e). As shown in Figure 7c–e, the depths of sliding surface for O1, O2, and O3 is 60.3 m, 45.6 m, and 25.8 m, respectively, among which IL1 is the sliding surface of O1 and O2, and IL3 is the sliding surface of O3.
4.2.2. Surface Deformation Characteristics
The GPS derived displacements vectors are shown in Figure 2. The GPS data strongly demonstrate that the western LFMZ moved faster than eastern LFMZ: the average velocity for the former (western LFMZ) was 9.74 mm/month (MJ01), and the latter (eastern LFMZ) was 5.12 mm/month (LJ13). Apart from these two LFMZs, the displacement velocities increased gradually with the rise of altitude. Until now, the recording data had indicated that the highest displacements were located at block O3, with the velocities varying between 7.62 mm/month (LJ09) and 12.25 mm/month (TN03), respectively. The first reason might be that the thickness of the unstable body decreases substantially toward the upper slope. The second reason might be that IL3 is exposed at the rear part of the block O3 (Figure 6f). These two reasons would make the rainfall infiltration easier in O3 than in the other areas of the landslide, accelerating the slope movement.
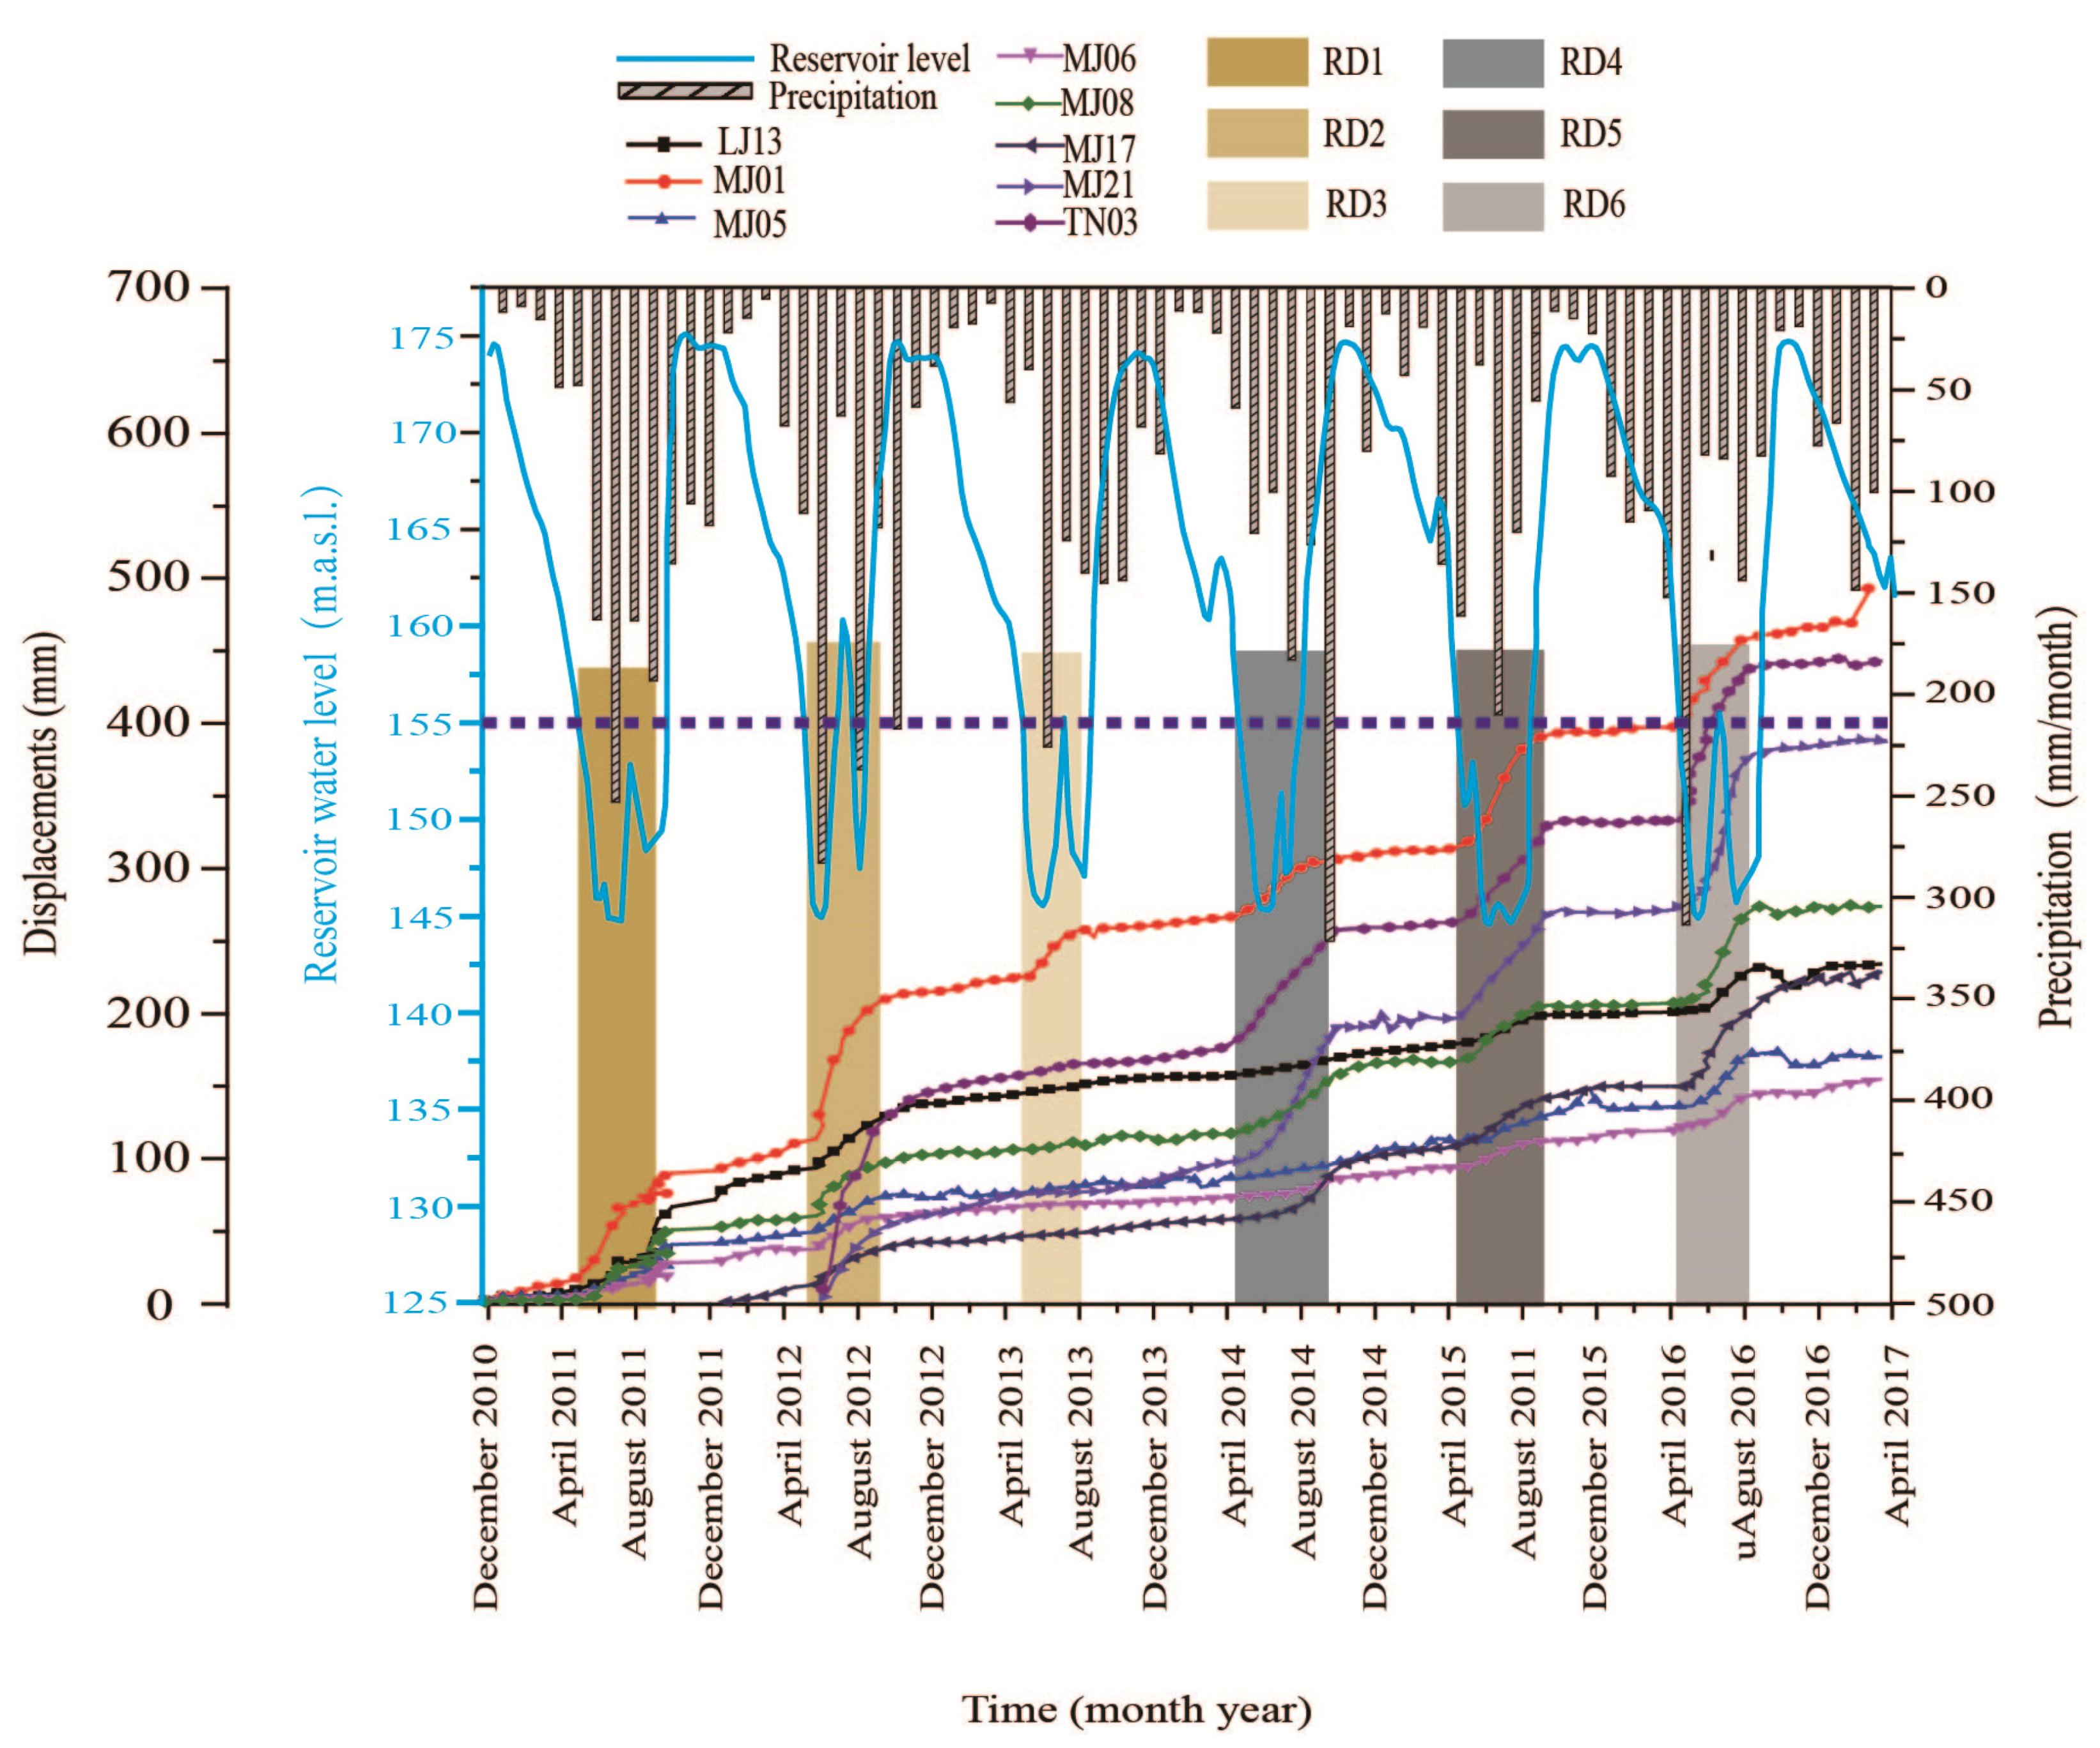
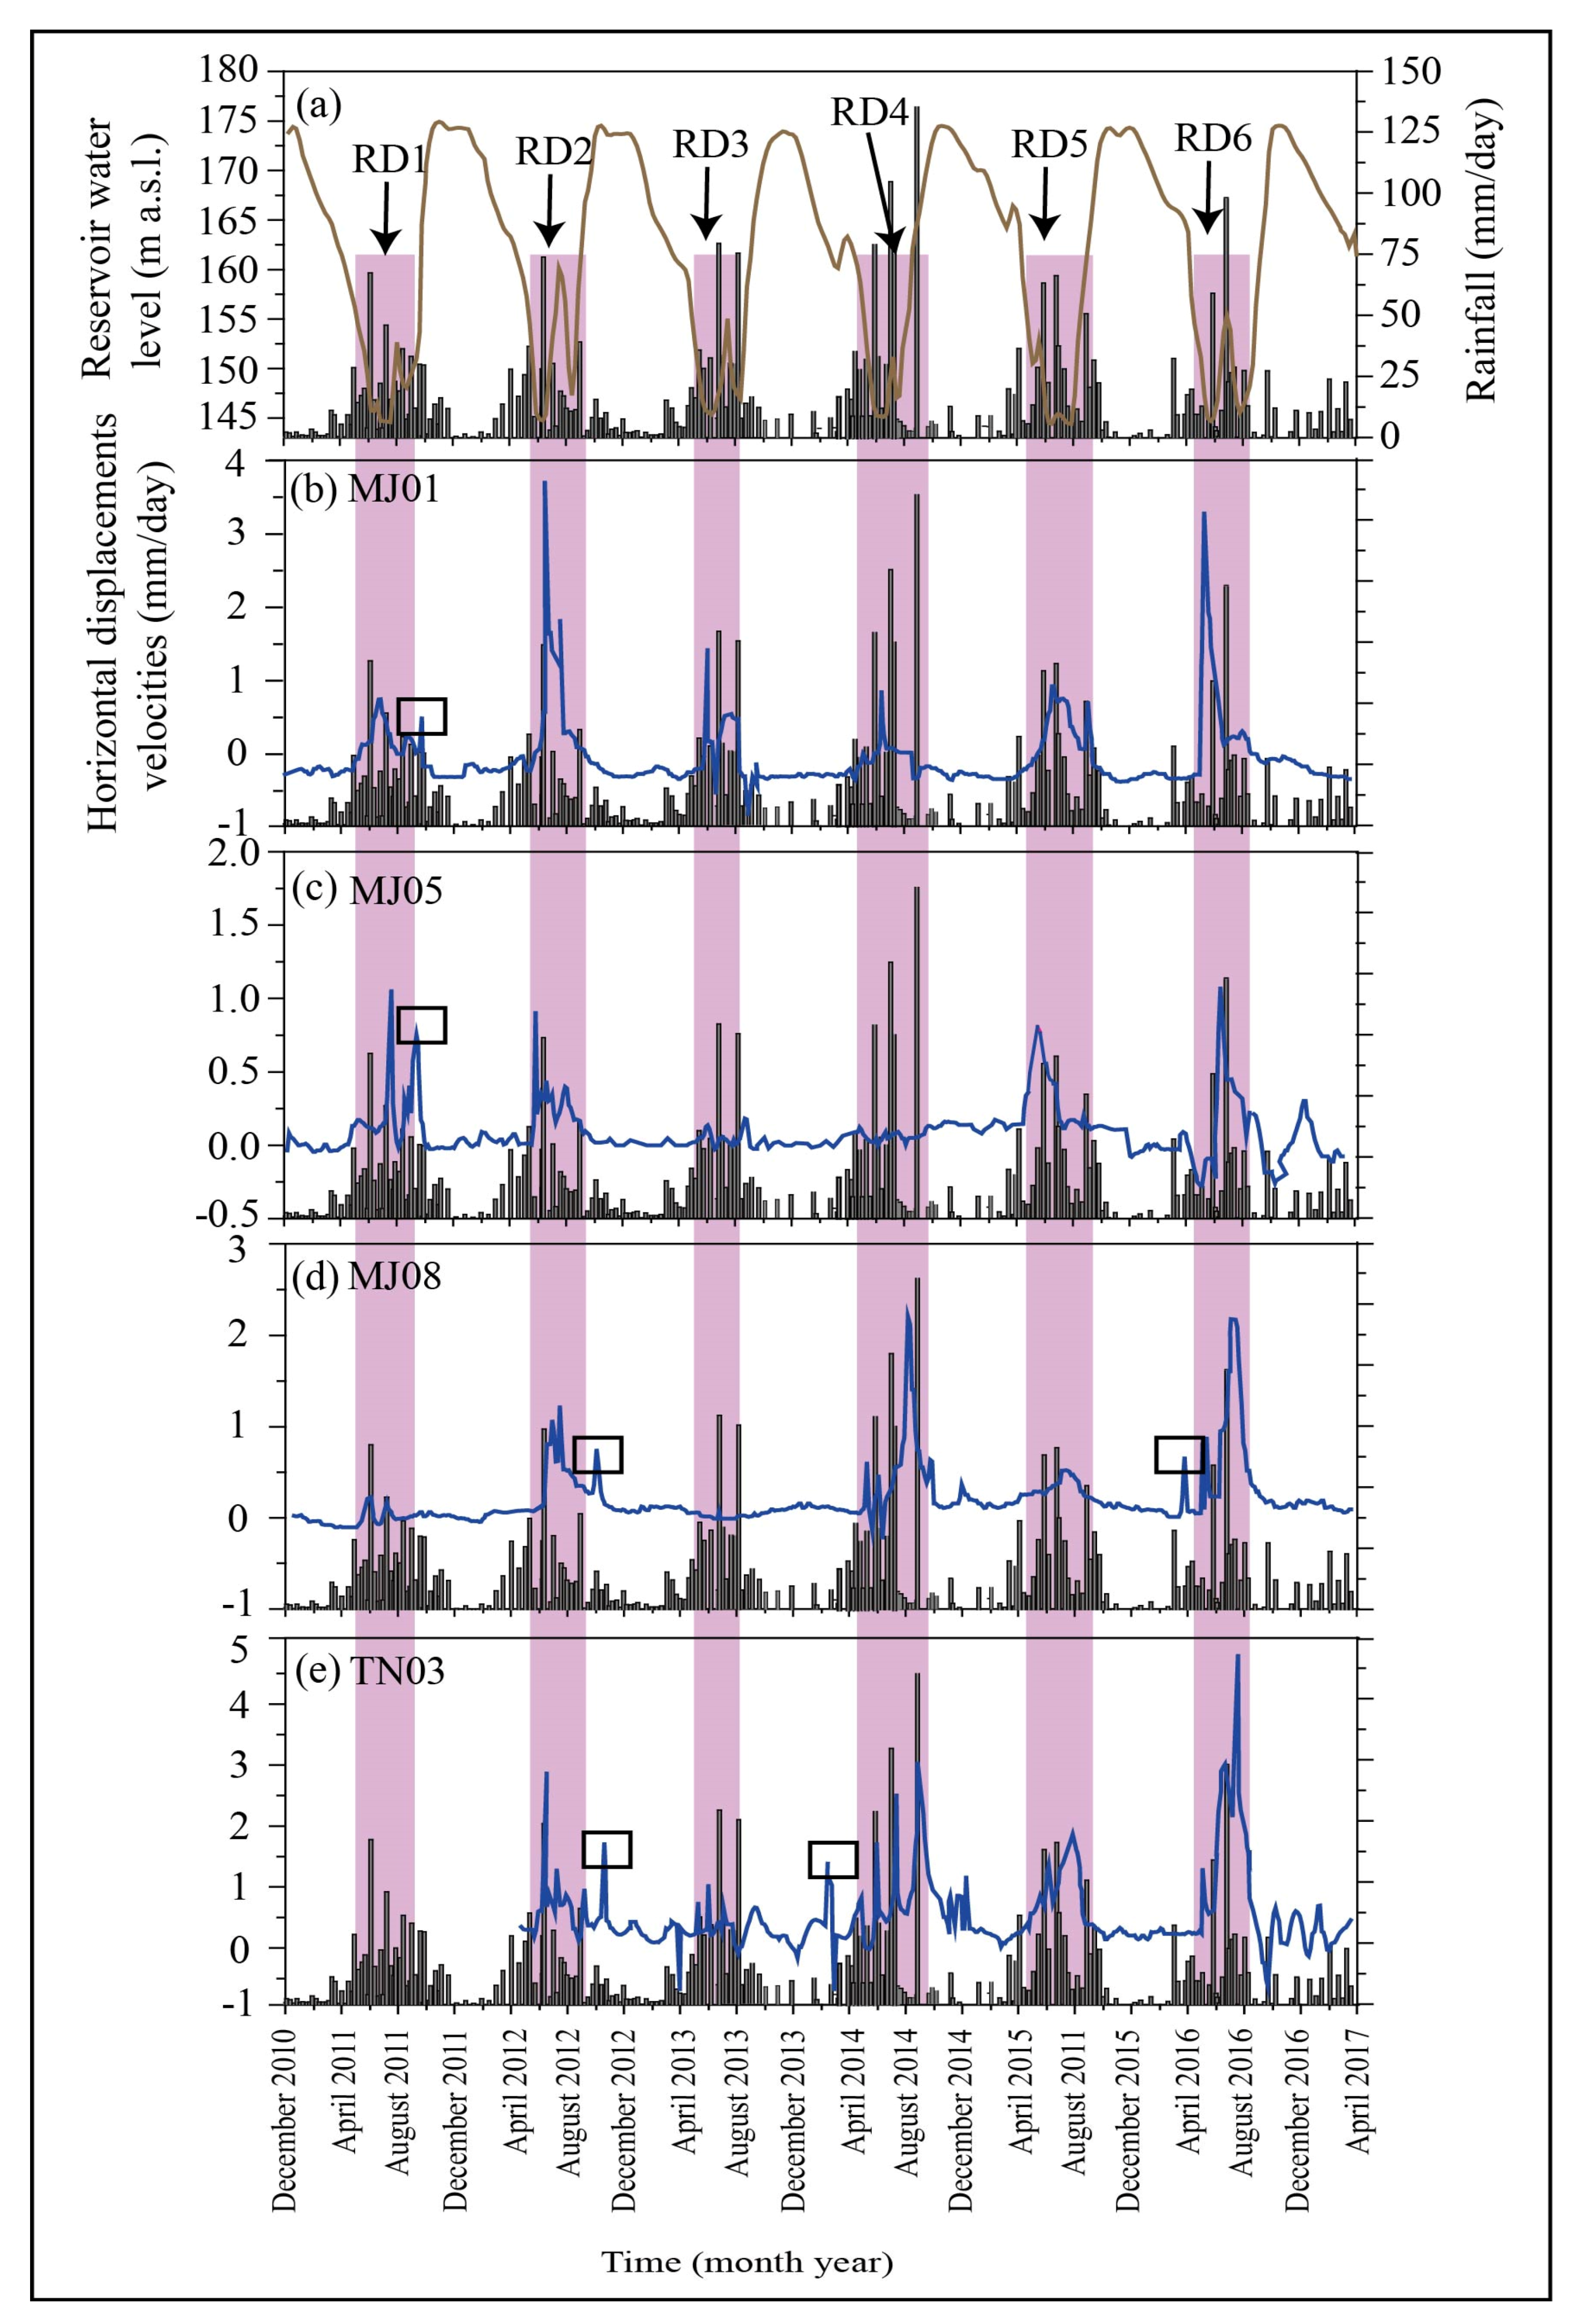
The slope surface data obtained from eight GPS stations are illustrated in Figure 8. According to the curve, the slope displacement shows a step-like pattern, which is characterized by a rapid displacement period followed by a slower displacement period in each hydrological year. The former (the rapid displacement period) initiated in June and ended in August, which directly coincided with the period of low reservoir water level and heavy rainfall. After that, the latter (slower displacement) appeared until the next beginning of wet season. As shown in Figure 8, six rapid displacement stages (RDs) can be recognized in the GPS displacement time series. Usually, the initiation of RD begins between May and June, when the reservoir is undergoing drawdown operations of approximately 155 m (purple dotted line in Figure 8). In detail, from RD1 to RD6, the reservoir water levels synchronized with the initiation of each RD are approximately 157.4, 154.2, 155.3, 155.1, 154.3, and 155.2 m·a.s.l. (above sea level), respectively. A more careful observation of Figure 9 shows that the accelerated displacement after the RD periods could also be found. For example, the displacement velocities for MJ05 increased to 0.77 mm on 5 October 2011, when an intensive daily rainfall nearly up to 38 mm was recorded (Figure 9c). Some other similar phenomena could also be caught at MJ01, MJ08, and TN03 (marked by black rectangle in Figure 9b–e), which suggests that the rainfall is also capable of driving the slope movement.
4.3. Modeling for Stability Analysis
4.3.1. Implementation of Numerical Model
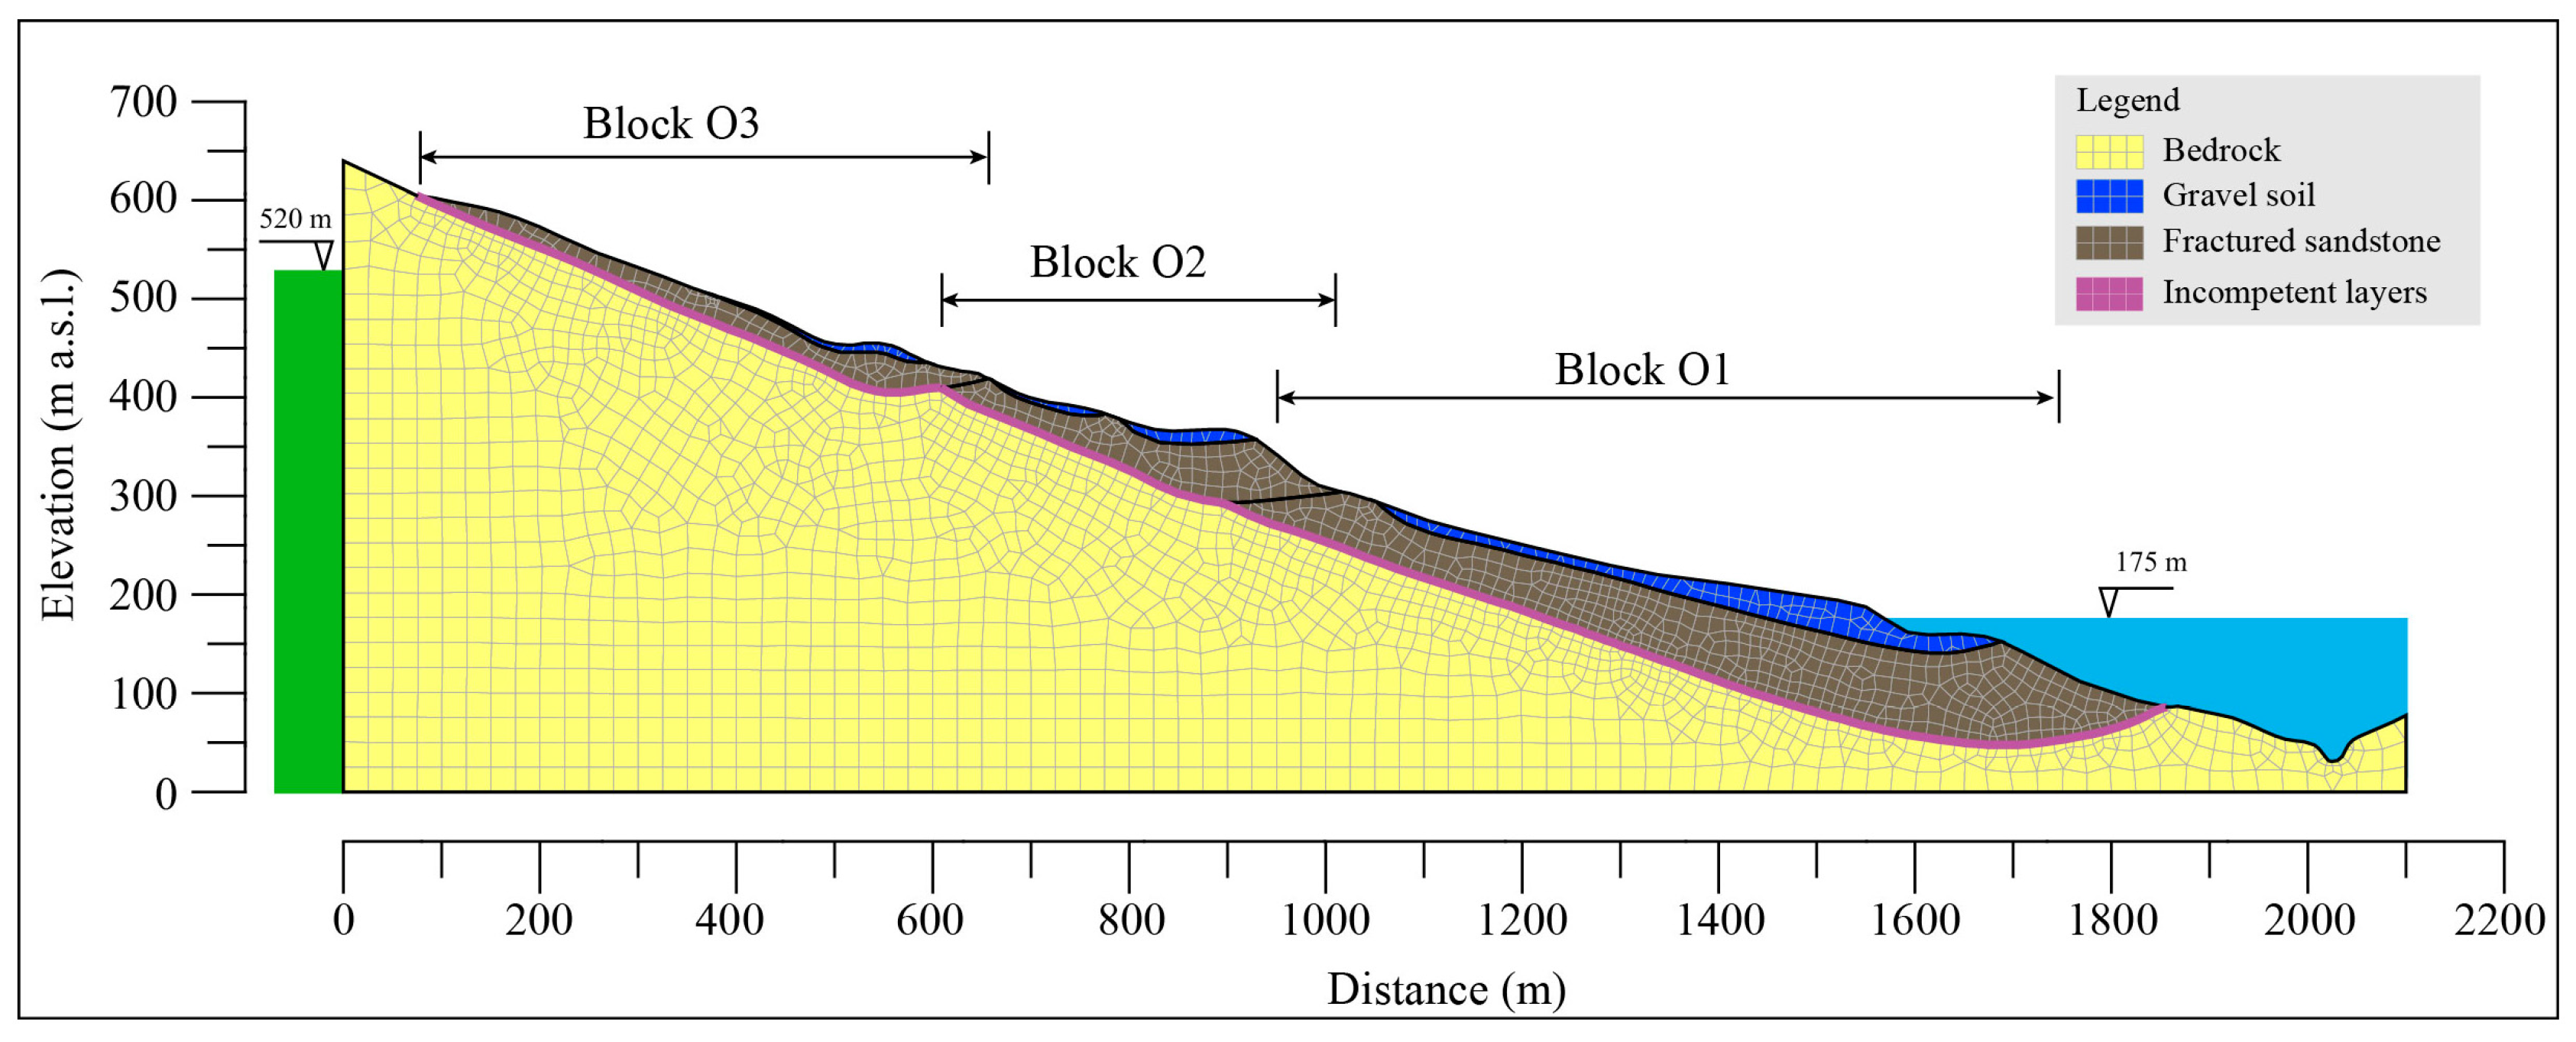
To thoroughly interpret the slope stability under the joint influence of reservoir operation and rainfall, the seepage and stability in the slope were analyzed and simulated by using the GEO-STUDIO software. Figure 10 shows the meshes of the geological model, considering the longitudinal section (cross-section in Figure 6). The geological model consisted of 2358 grid points and 2296 elements. This model was first established using AUTOCAD software and then imported into GEO-STUDIO. Subsequently, the model was calculated with three hydrological boundary conditions: (i) the groundwater conditions were simulated by imposing a constant total head at 520 m at the left side [34]; (ii) a constant total head of 175 m was applied on the slope surface, below the elevation of 175 m; and (iii) a constant flux of 2.90 mm/day (daily rainfall in 2011) was injected into the displaced materials above 175 m. After the initial calculation, a stability analysis was conducted by taking the rainfall and reservoir water into account.
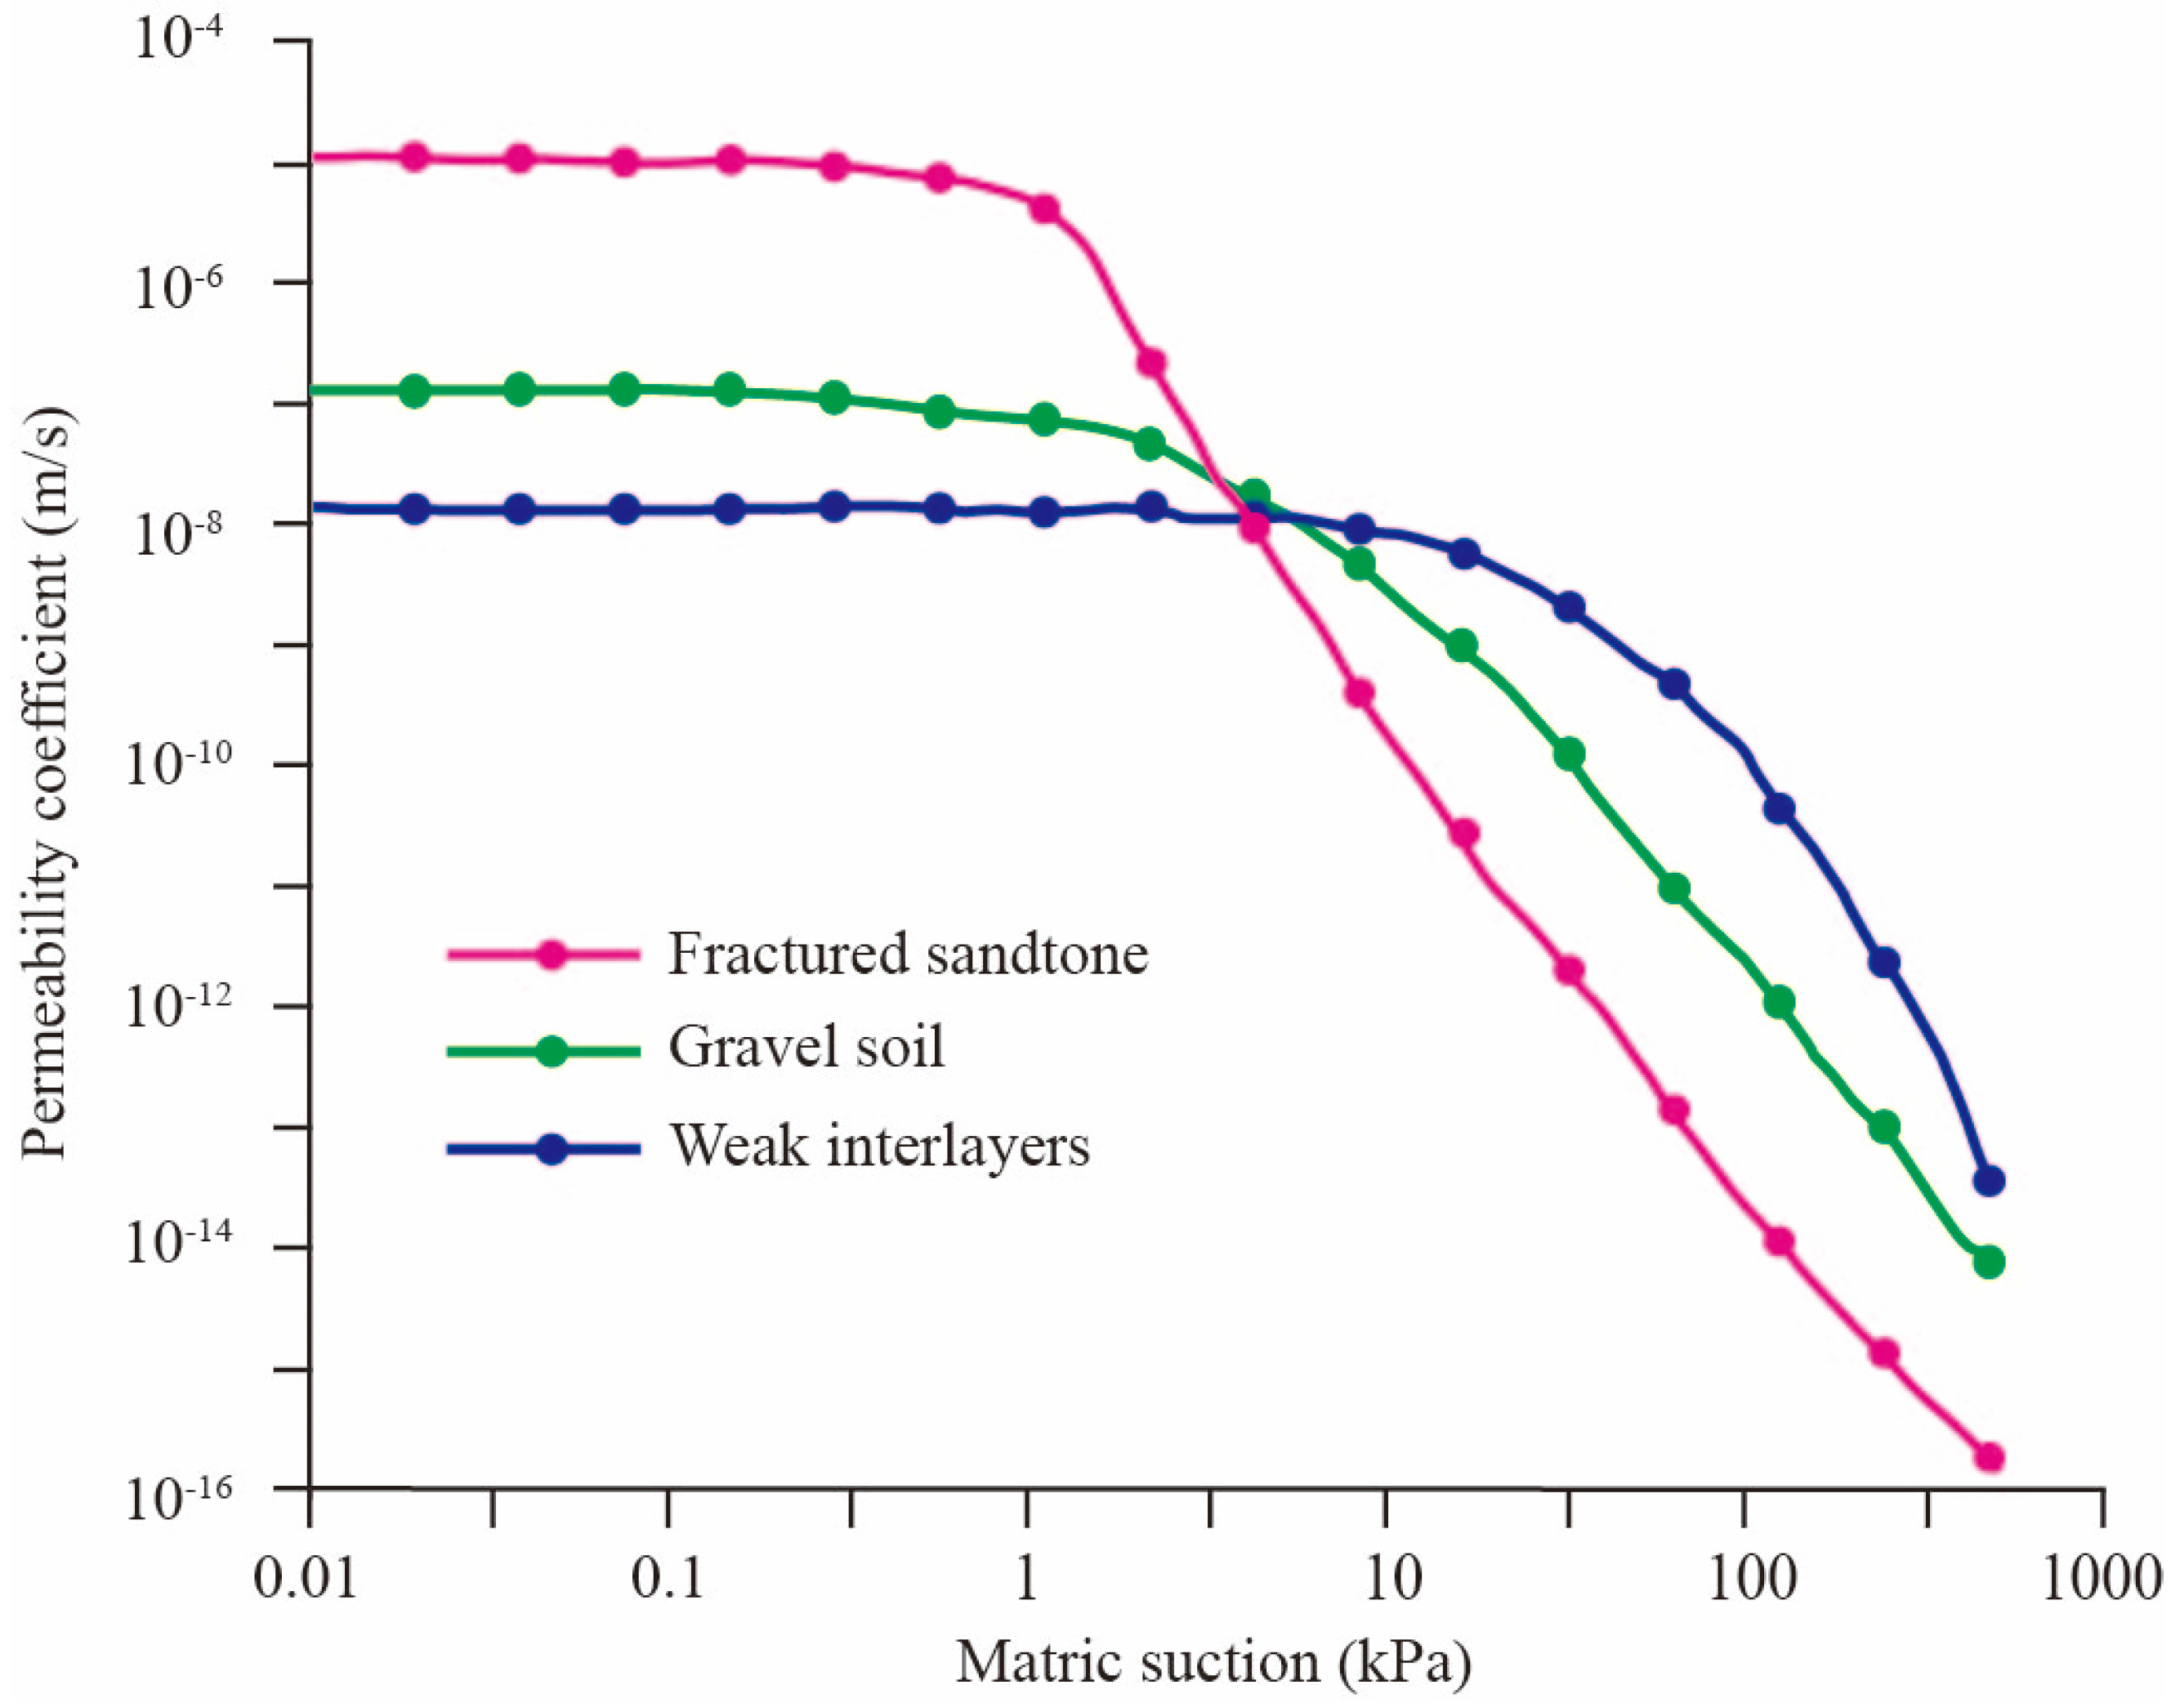
Four different types of materials were used in this numerical model, including ILs, gravel soil, fractured sandstone, and bedrock (Figure 10). The Mohr–Coulomb model was used for all the materials. The physical and mechanical parameters of the landslide are listed in Table 1; these parameters were obtained from some previous works developed by the Nanjiang Hydrogeological Engineering and Geological Engineering Team, Bureau of Geology and Mineral Resources, Chongqing, as well as previous literature [26,34]. The soil–water characteristic curve (SWCC) parameters—i.e., α, n, and m, as defined by [35]—are listed in Table 2. The permeability functions of the displaced materials are presented in Figure 11.
4.3.2. Model Results and Interpretation
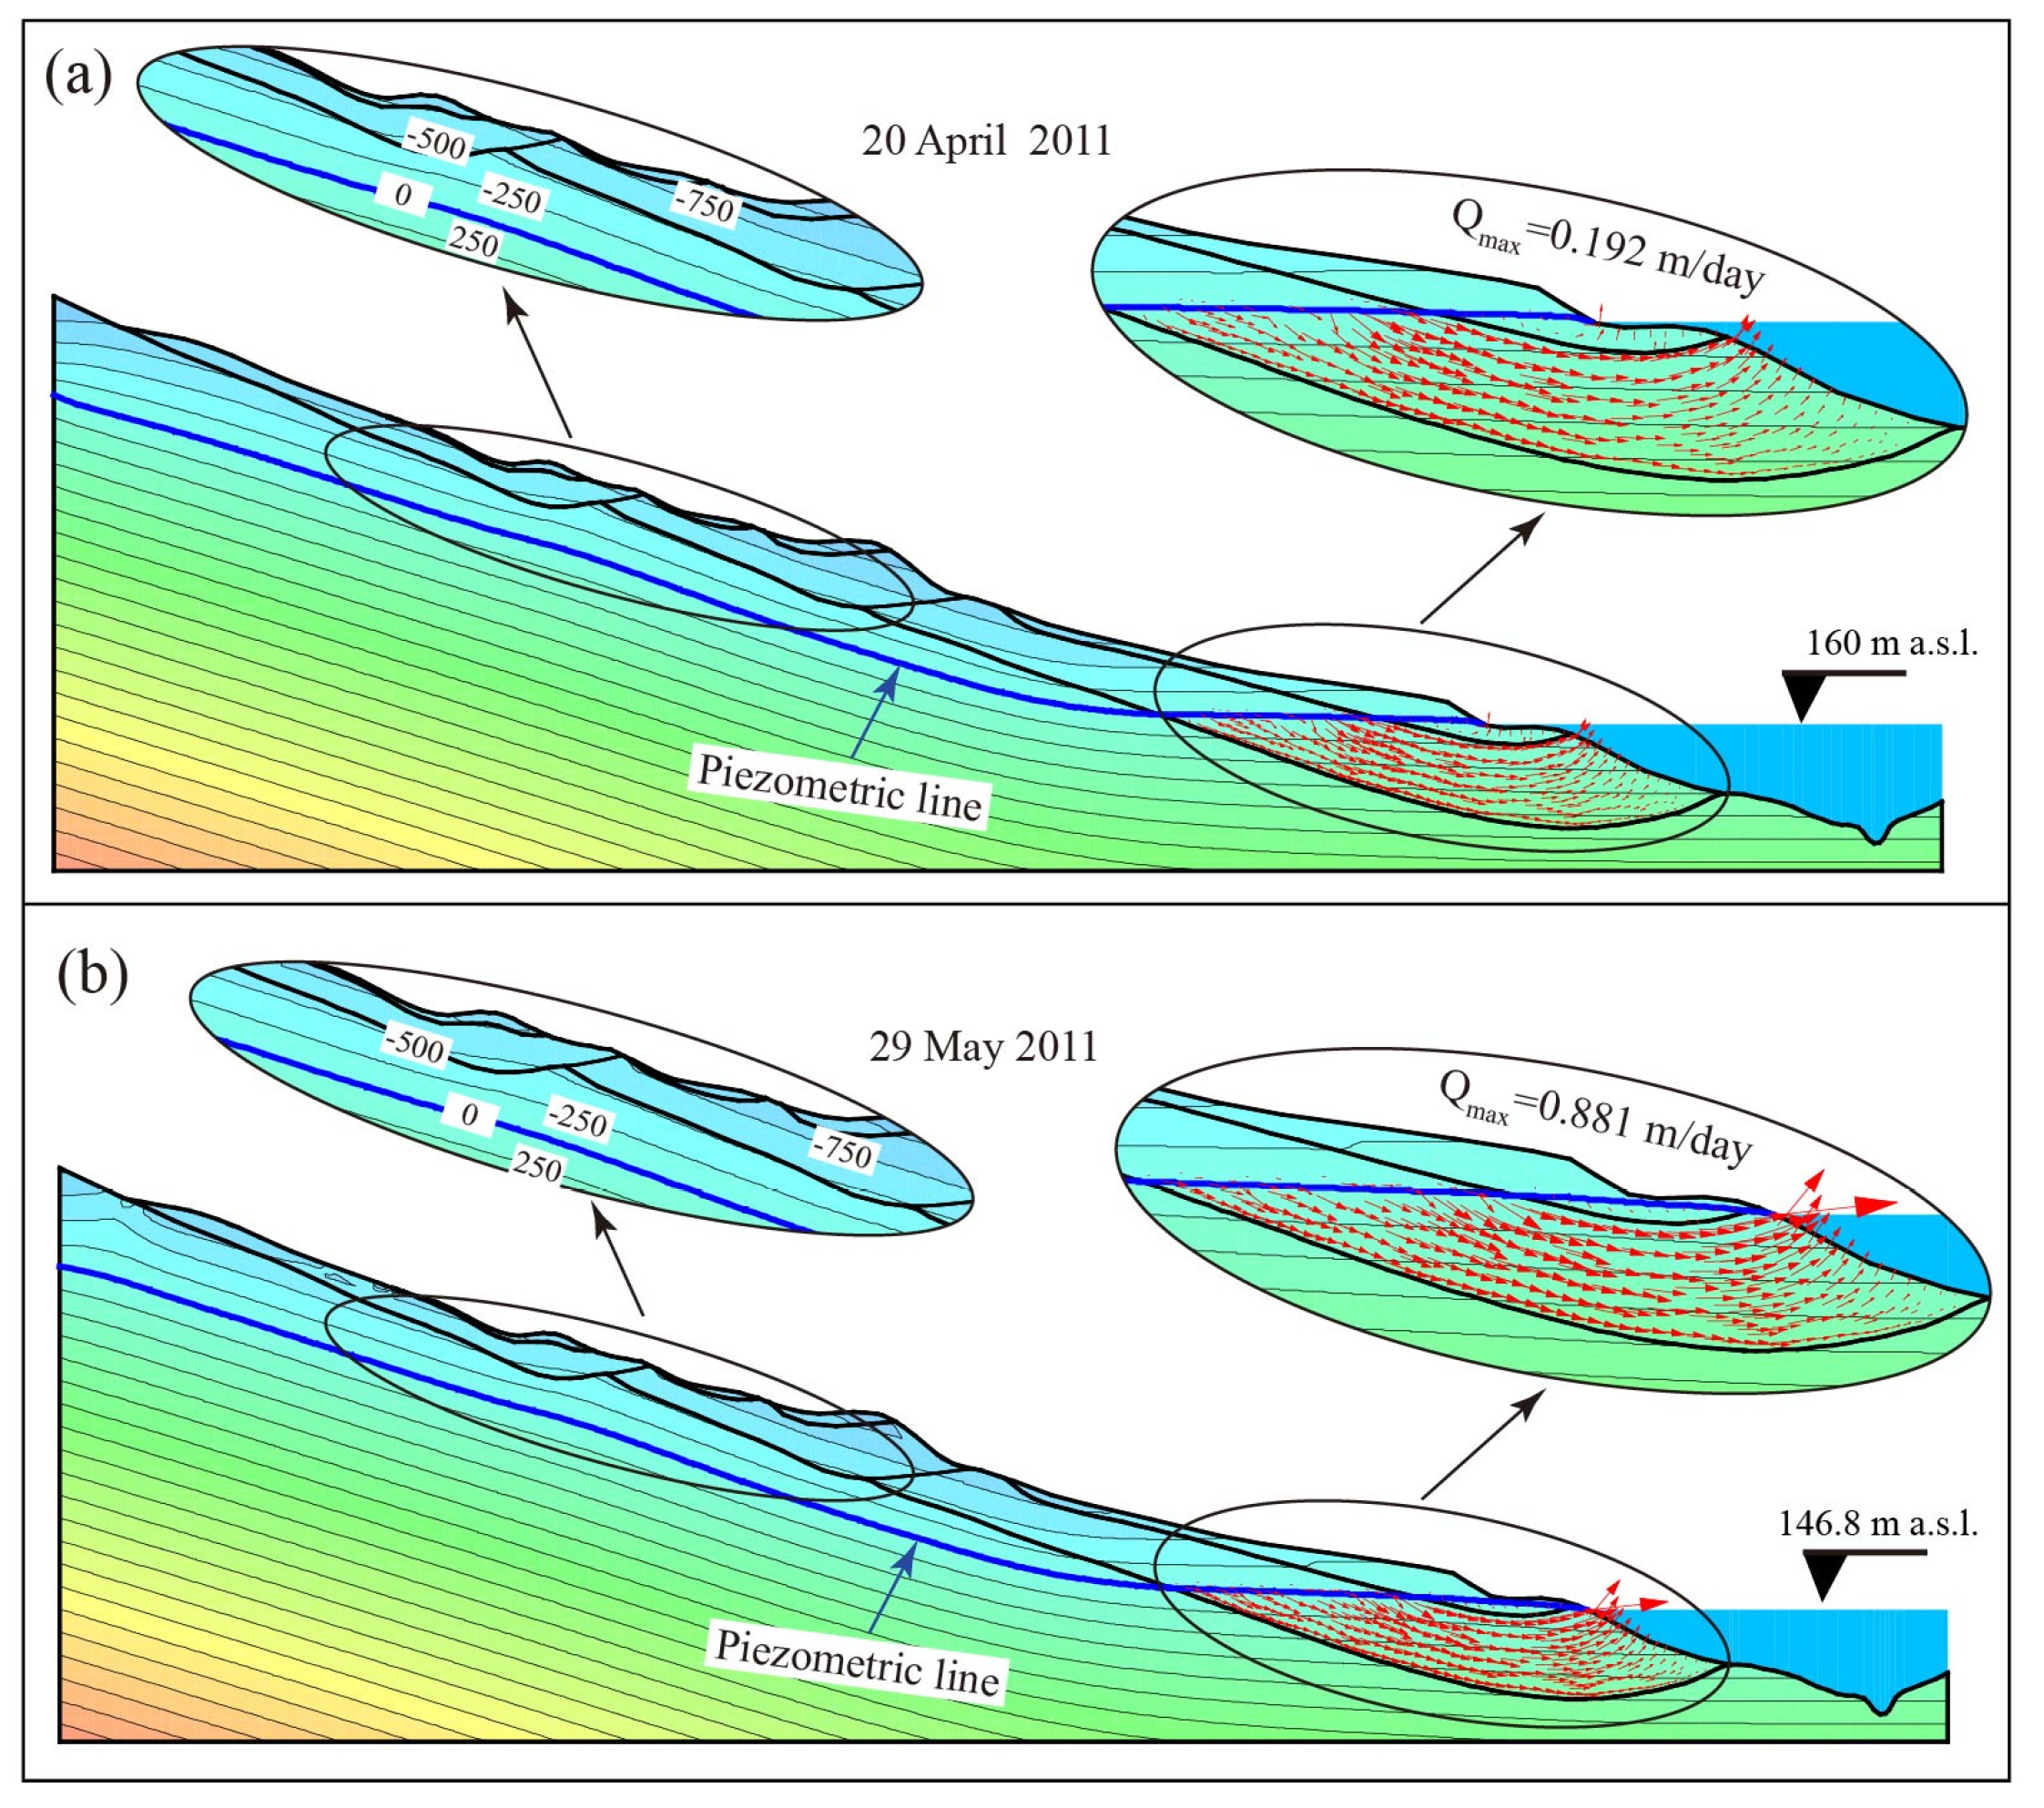
The seepage between January 2012 and December 2012 was analyzed in detail, and the simulated results are shown in Figure 12, Figure 13 and Figure 14. The drawdown operation can be divided into two stages. The first stage is from 1 January 2012 to 7 May 2012, when the reservoir water level dropped at a velocity of 0.157 m/day. The second stage started on 16 May 2012 and terminated on 13 June 2012, when the reservoir water level dropped at a velocity of 0.339 m/day. The drawdown operation caused the seepage toward outside the slope, and the maximum fluid velocity at the toe increased from 0.192 m/day at the first stage (Figure 12a) to 0.881 m/day at the second stage (Figure 12b). Remarkably, during the drawdown operation, the piezometric line at the front part apparently decreased, but was nearly unchanged at the upper part (Figure 12a,b). This may indicate that the slope behaviors at the front part have a close relationship with the reservoir water.
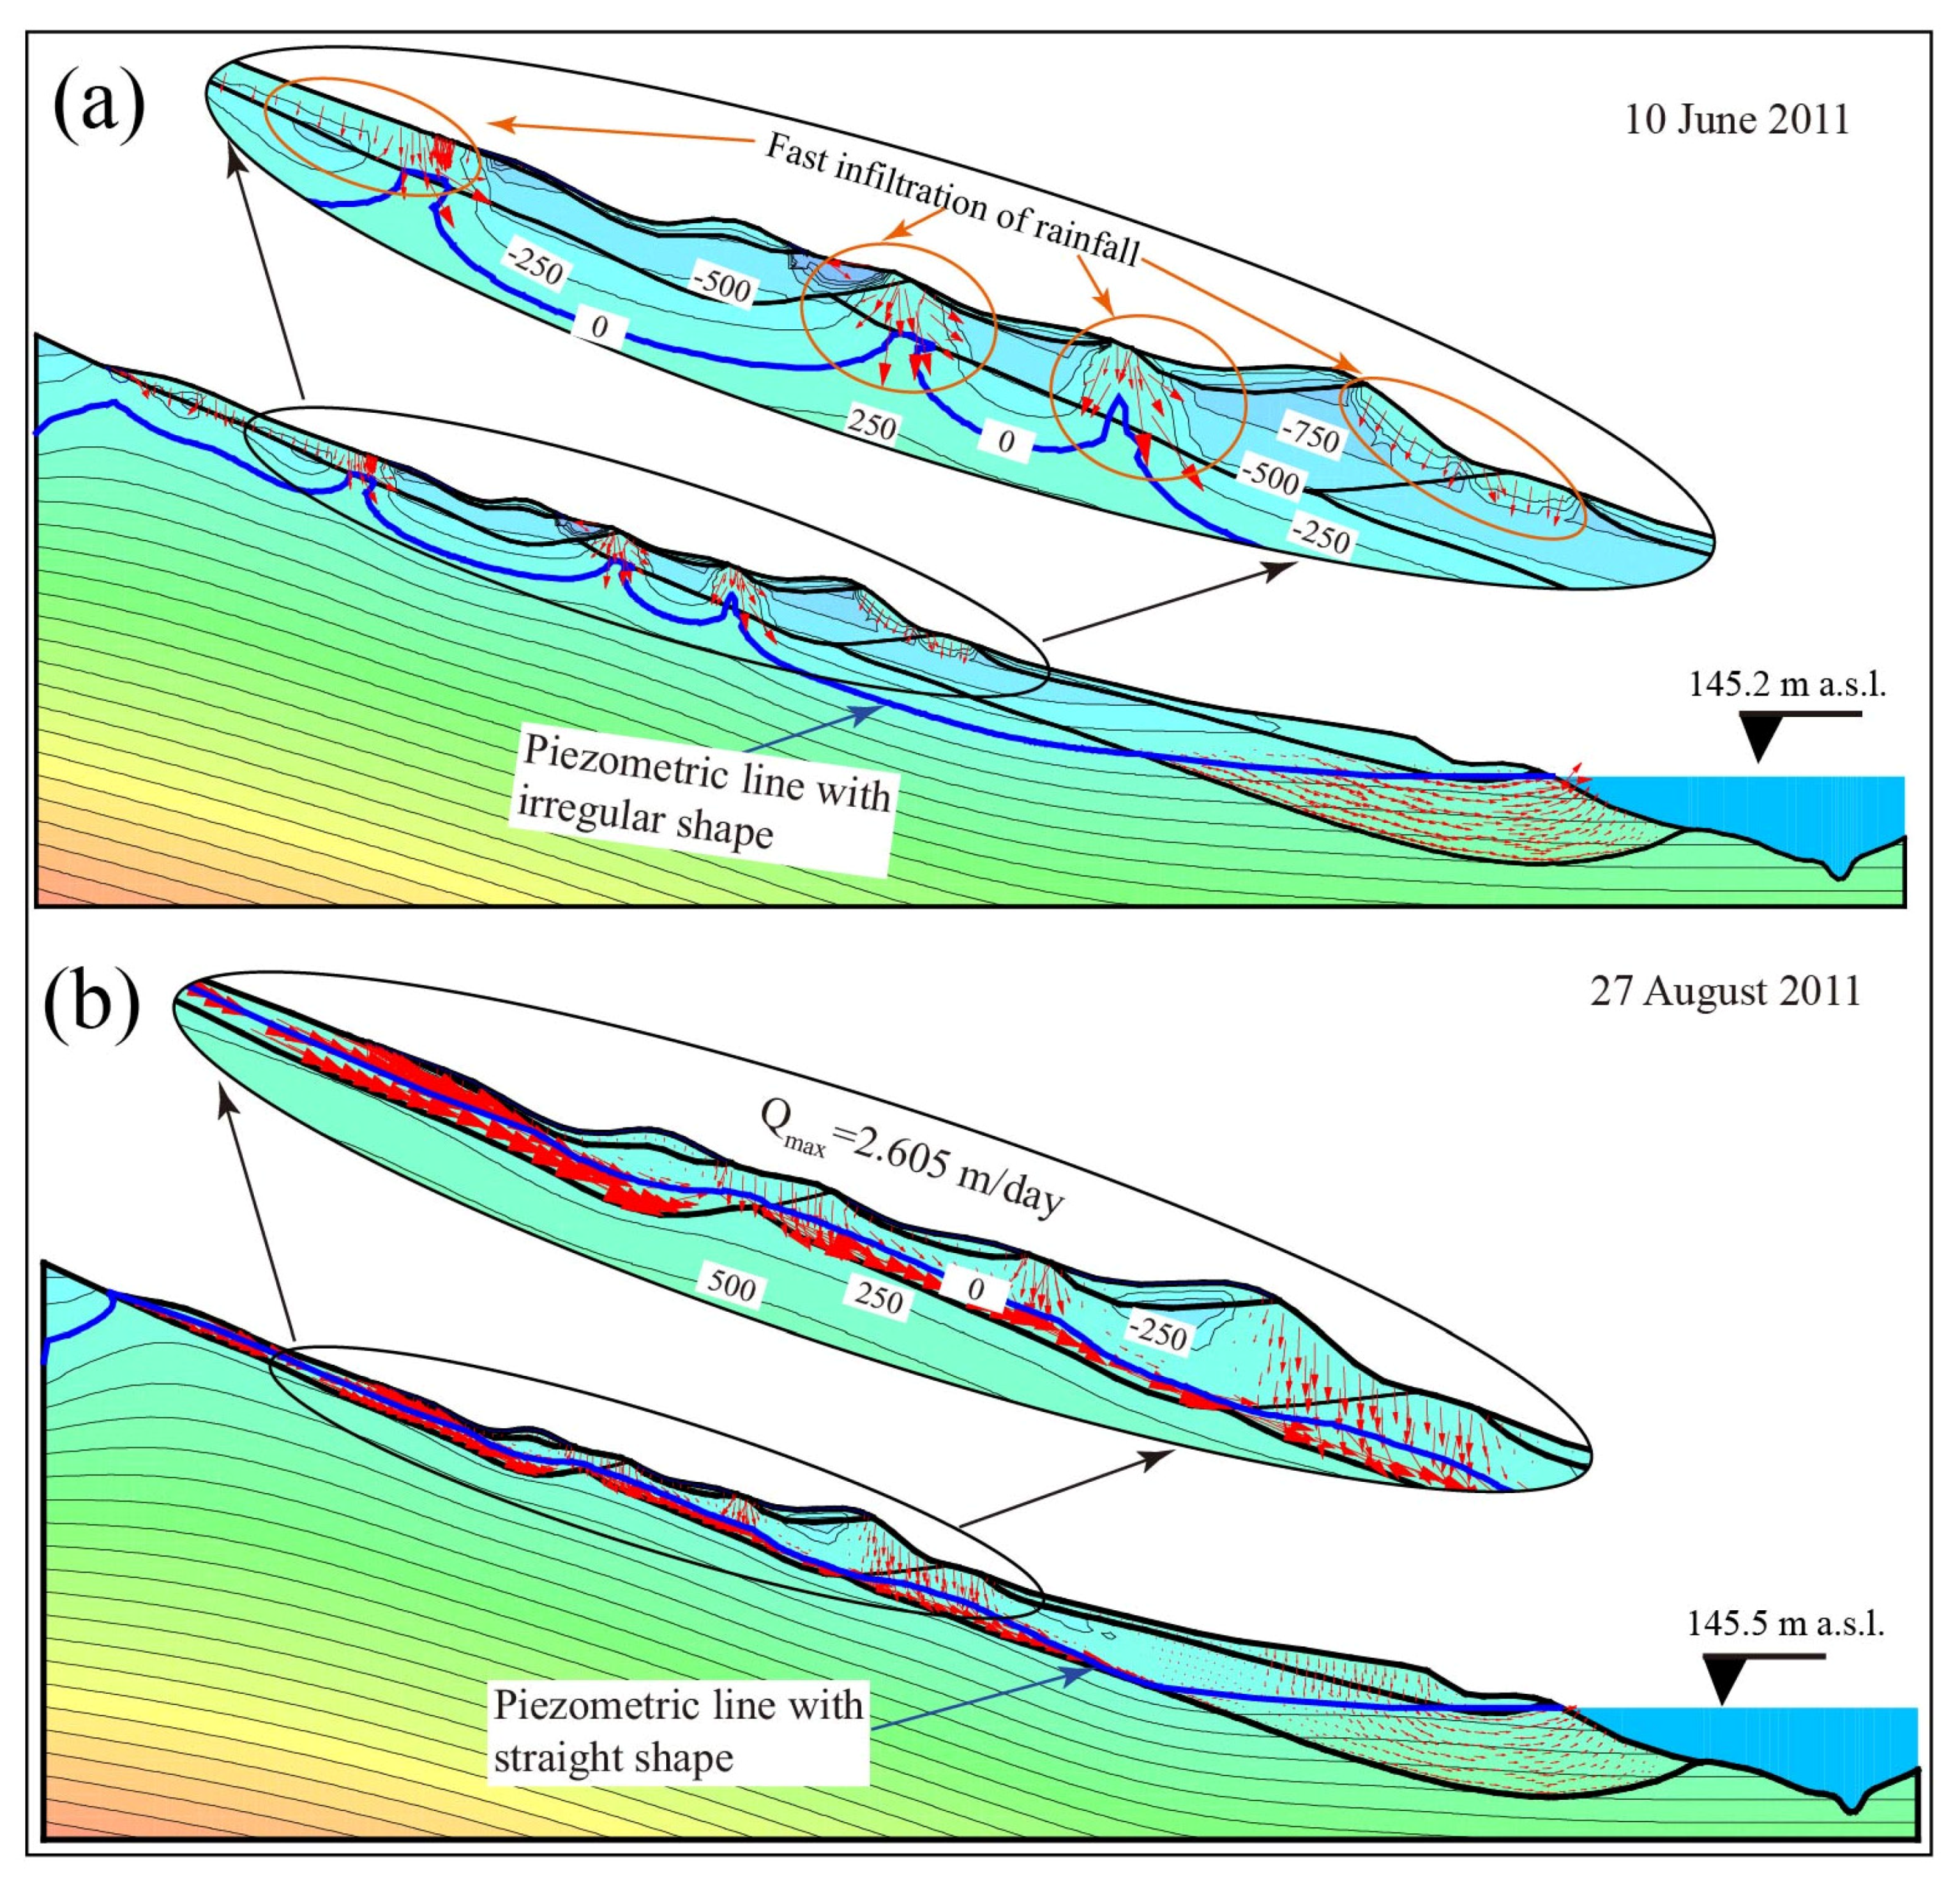
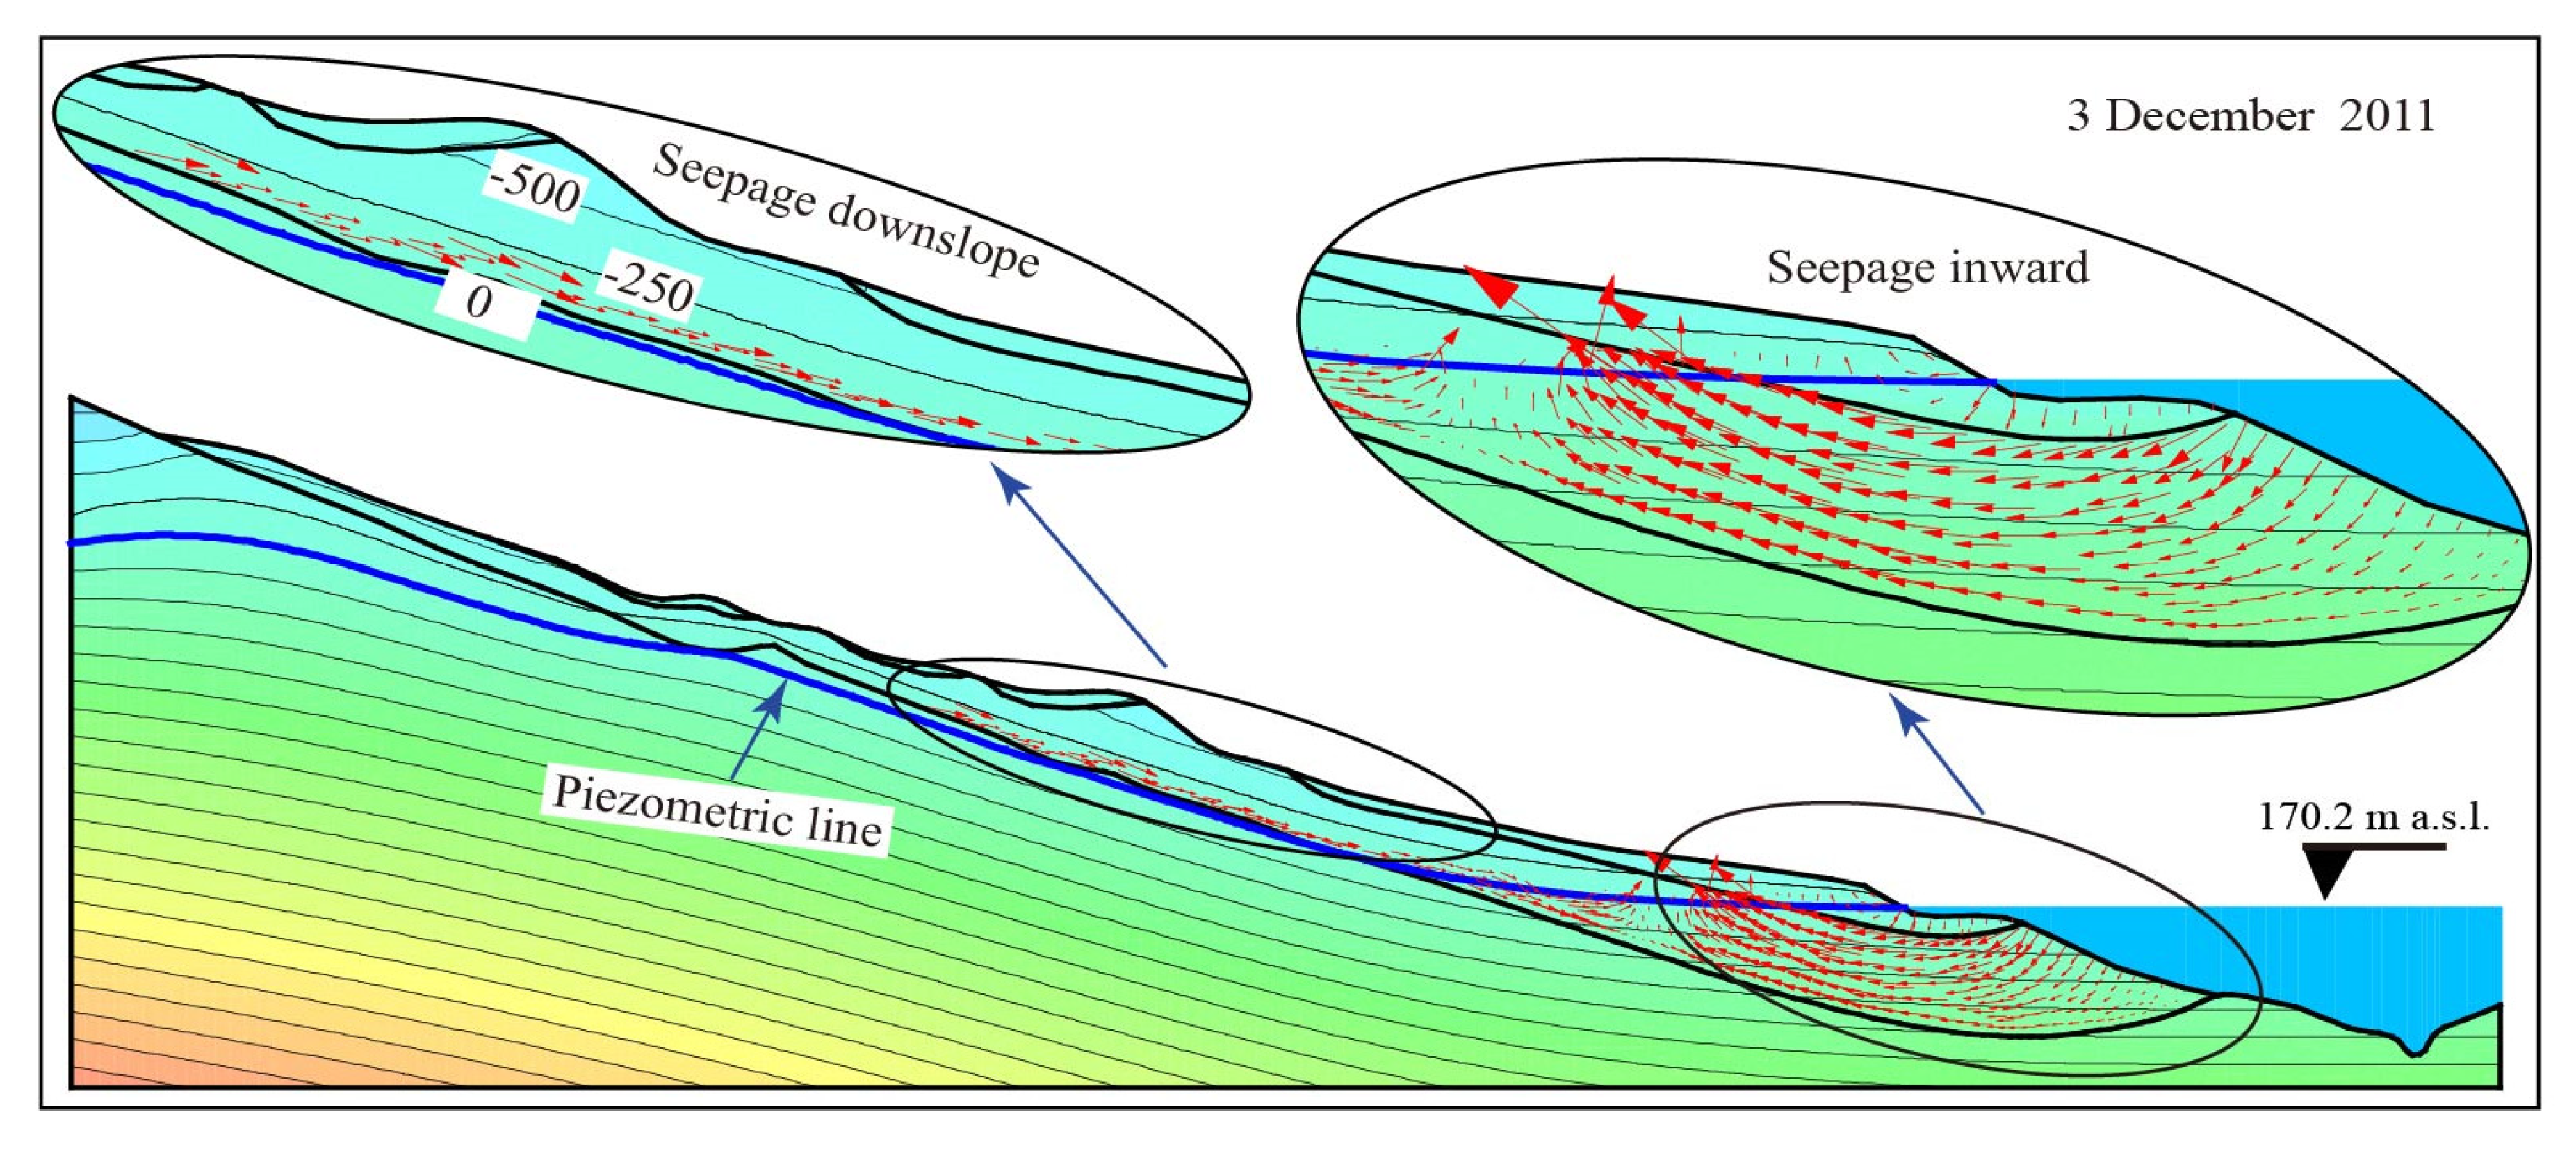
Afterward, the rainfall season came and the reservoir water level remained constant at nearly 145 m. At the early stages of rainfall, the shape of the piezometric line became irregular, characterized by a piezometric line at some local areas, with no gravel soil layer at the upper part of the slope, rising relatively quickly (Figure 13a). The possible explanation is that the thickness of the sliding body decreased toward the upper slope (approximately 26.8 m at block O3), and the permeability for fractured sandstone is large. Both of these factors impact the capacity of the fast infiltration of rainfall, and thus increases in the groundwater table. With the ongoing rainfall, the shape of piezometric line at the upper part returned to straight and increased as a whole, with a maximum downslope fluid velocity of 2.605 m/day (Figure 13b). Notably, the piezometric line at the toe is nearly constant during the rainfall season (Figure 13a,b). The variation of the piezometric line during the rainfall season may indicate that the slope behaviors at the upper part has a close relationship with the rainfall. Once the dry season arrived, the reservoir experienced the filling operation. Thus, in early September 2012, the reservoir water level began to increase, and reached 175 m later on, in November 2012. During this period, the piezometric line at the rear part decreased, but increased at the toe (Figure 14). The possible explanation for this is that, on the one hand, the rise of reservoir water could make the seepage go inward at the toe, and then increase the groundwater table at the toe. On the other hand, the groundwater at the front part could be recharged from the upper part, where the downslope seepage could be identified.
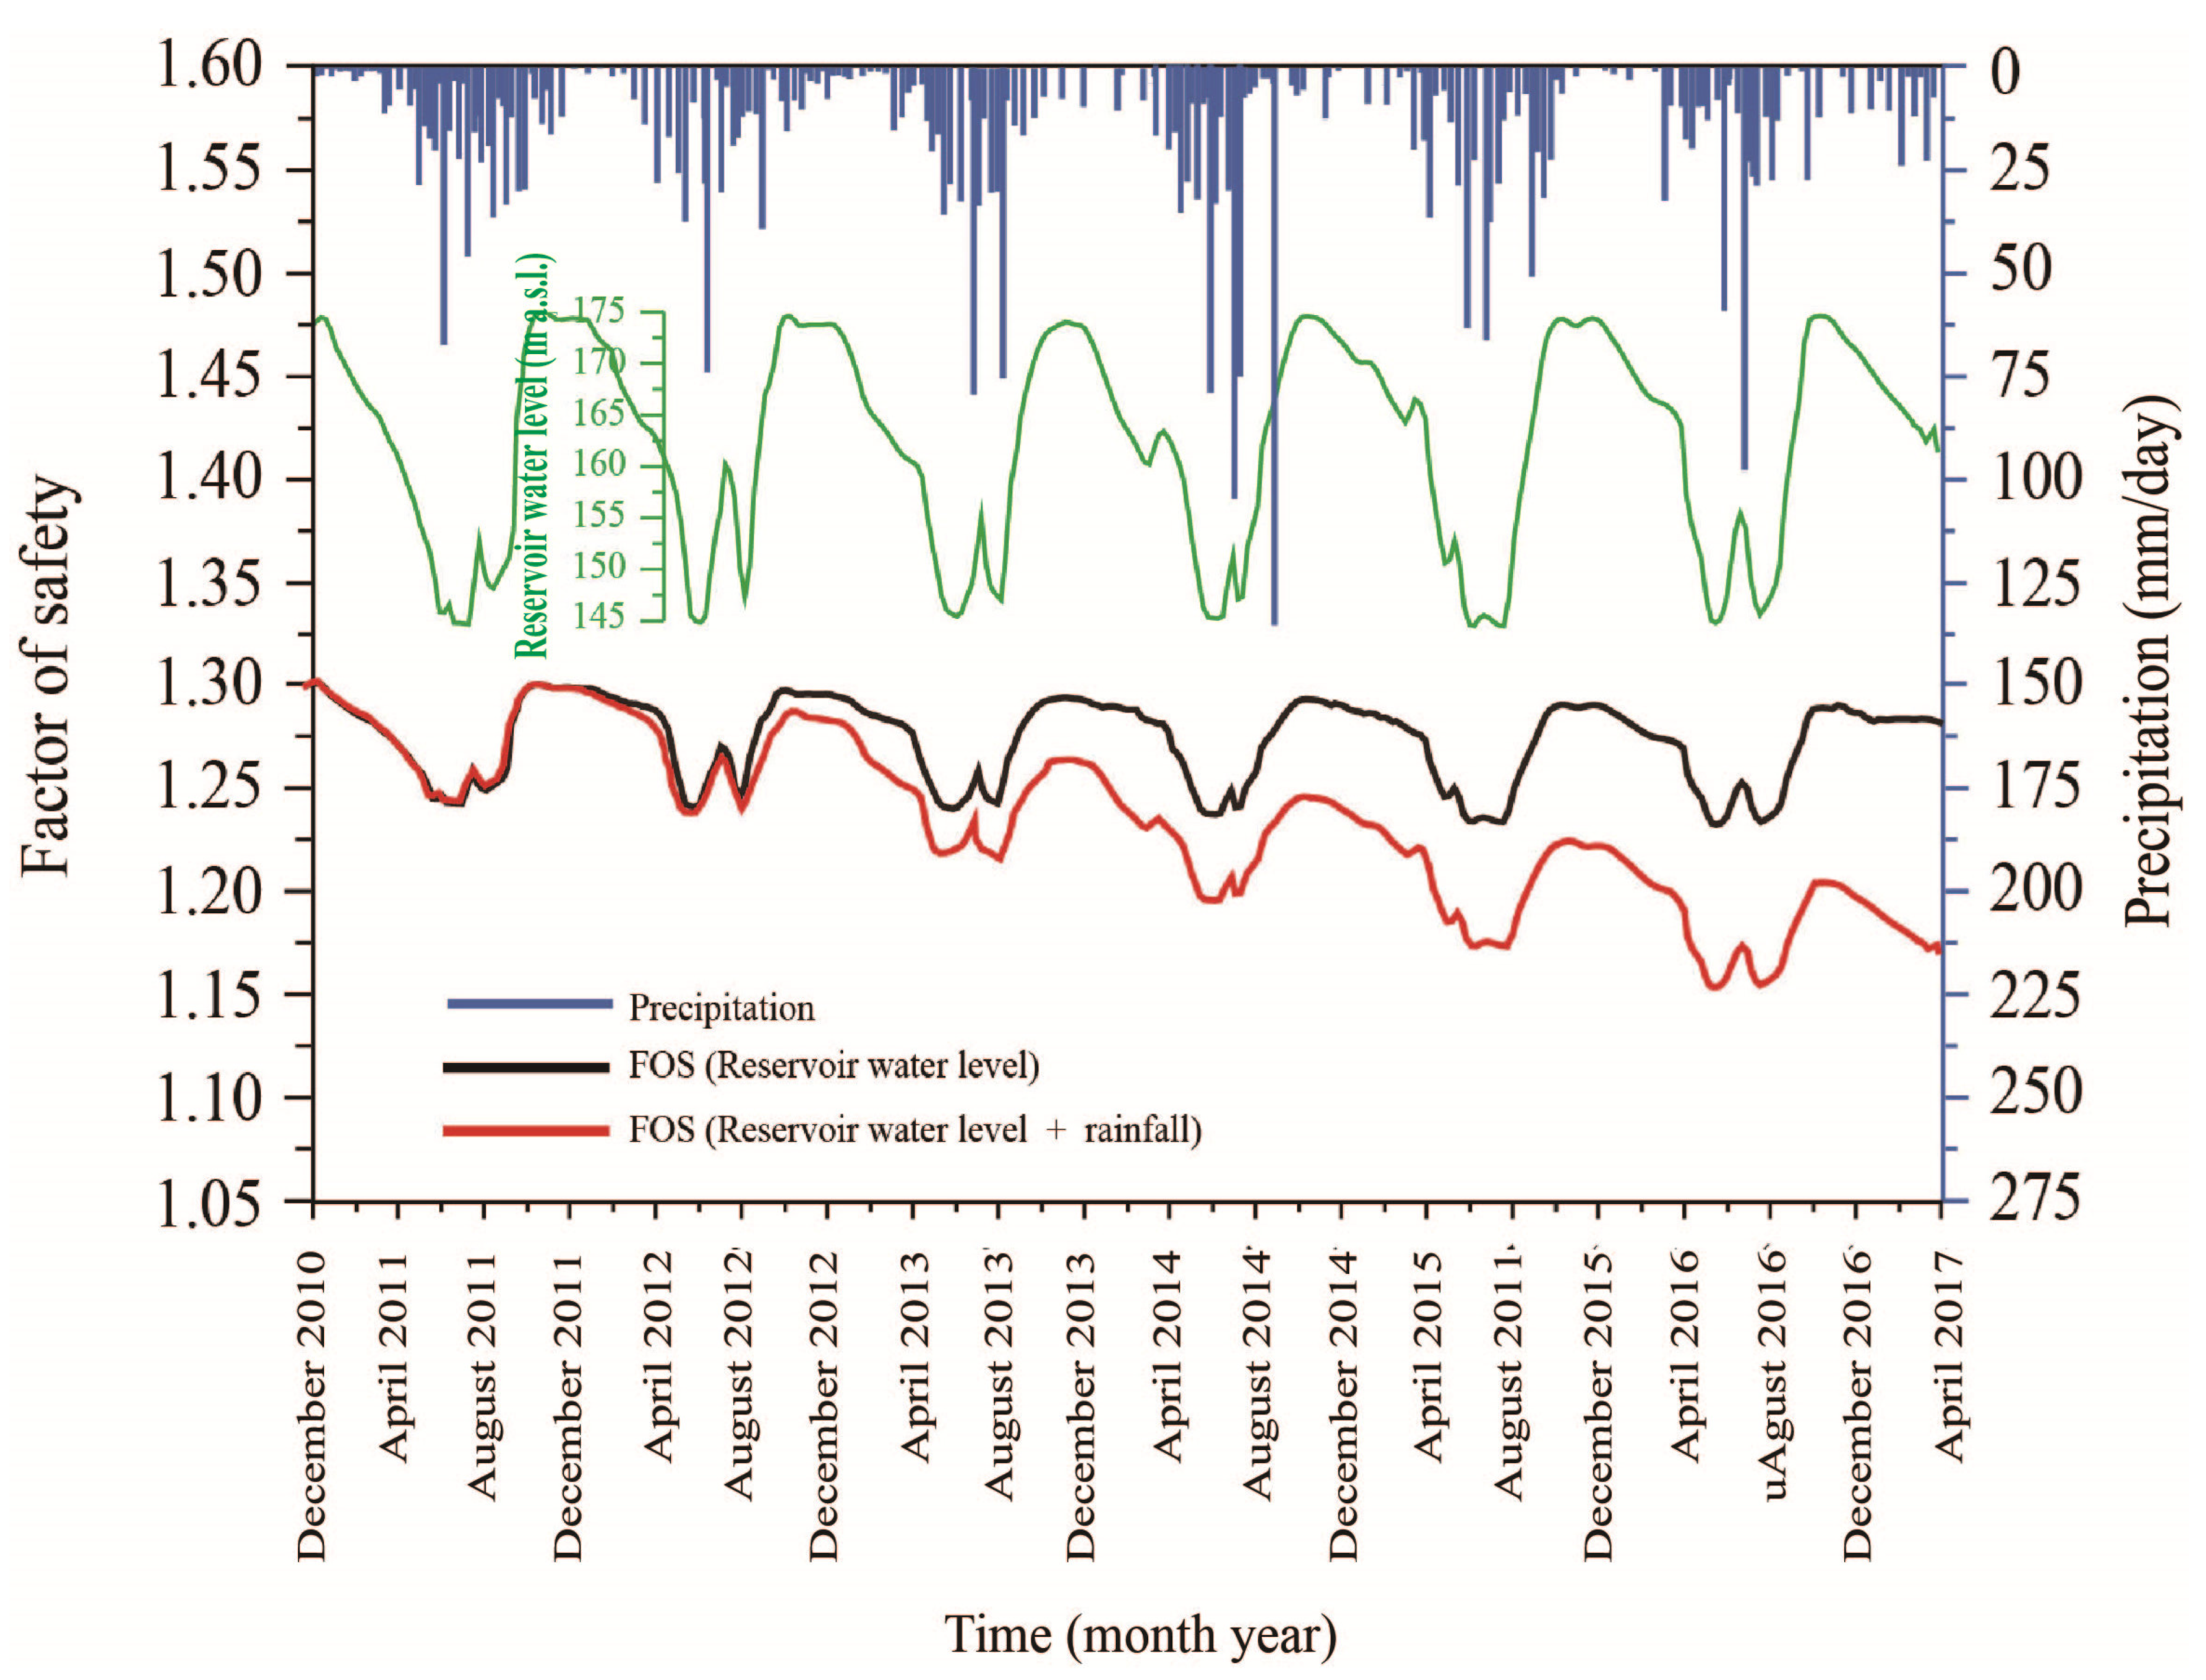
To evaluate the long-term stability evolution of the Outang landside under the coupled effect of hydrological factors (precipitation and reservoir water). Two kinds of environment conditions are calculated, and the results of the factor of safety (FOS) was shown in Figure 15. In scenario 1, when only the fluctuation of reservoir water level was considered, the numerical results show that the FOS is nearly in line with the fluctuation of reservoir water level. In this situation, the FOS changed along with the reservoir water level variation, increasing during filling operation and decreasing the FOS during the drawdown operation. The possible explanation is that the seepage outflow caused by the drawdown operation could accelerate the slope movement and then decrease the FOS [36]. Conversely, seepage inflow caused by the filling operation could push the displaced materials inward and prevent them from sliding downslope, and then increase the FOS [37]. Generally, the FOS has a tendency to decrease as time elapses.
In scenario 2, both the water level variation and rainfall are considered together. The FOS fluctuates between 1.15 and 1.30, but is usually smaller than that considered in scenario 1. When taking the precipitation into account, the FOS of the Outang landslide is decreased by about 12%. which illustrates that the reservoir water level and precipitation are believed to be the major factors influencing the slope stability. The numerical results show that the FOS tends to decrease gradually as time elapses. A possible explanation is that the progressive accumulation of damage inside the mobilized materials results from periodic fluctuation of the reservoir water level and seasonal rainfall [3,18]. To avoid the entire failure of the slope, measures like drainage system in the upper part, bank revetment, and piles anchored at the toe of the slope would be helpful in landslide control. Moreover, long-term monitoring is also needed.
5. Discussion
5.1. Formation Mechanism and Process
According to the information from field investigations and the geological map, and ESR results, a conceptual model for interpreting the formation mechanism and process of the Outang landslide, is proposed, and illustrated in Figure 16. Elaborated inferences are presented in the following paragraphs.
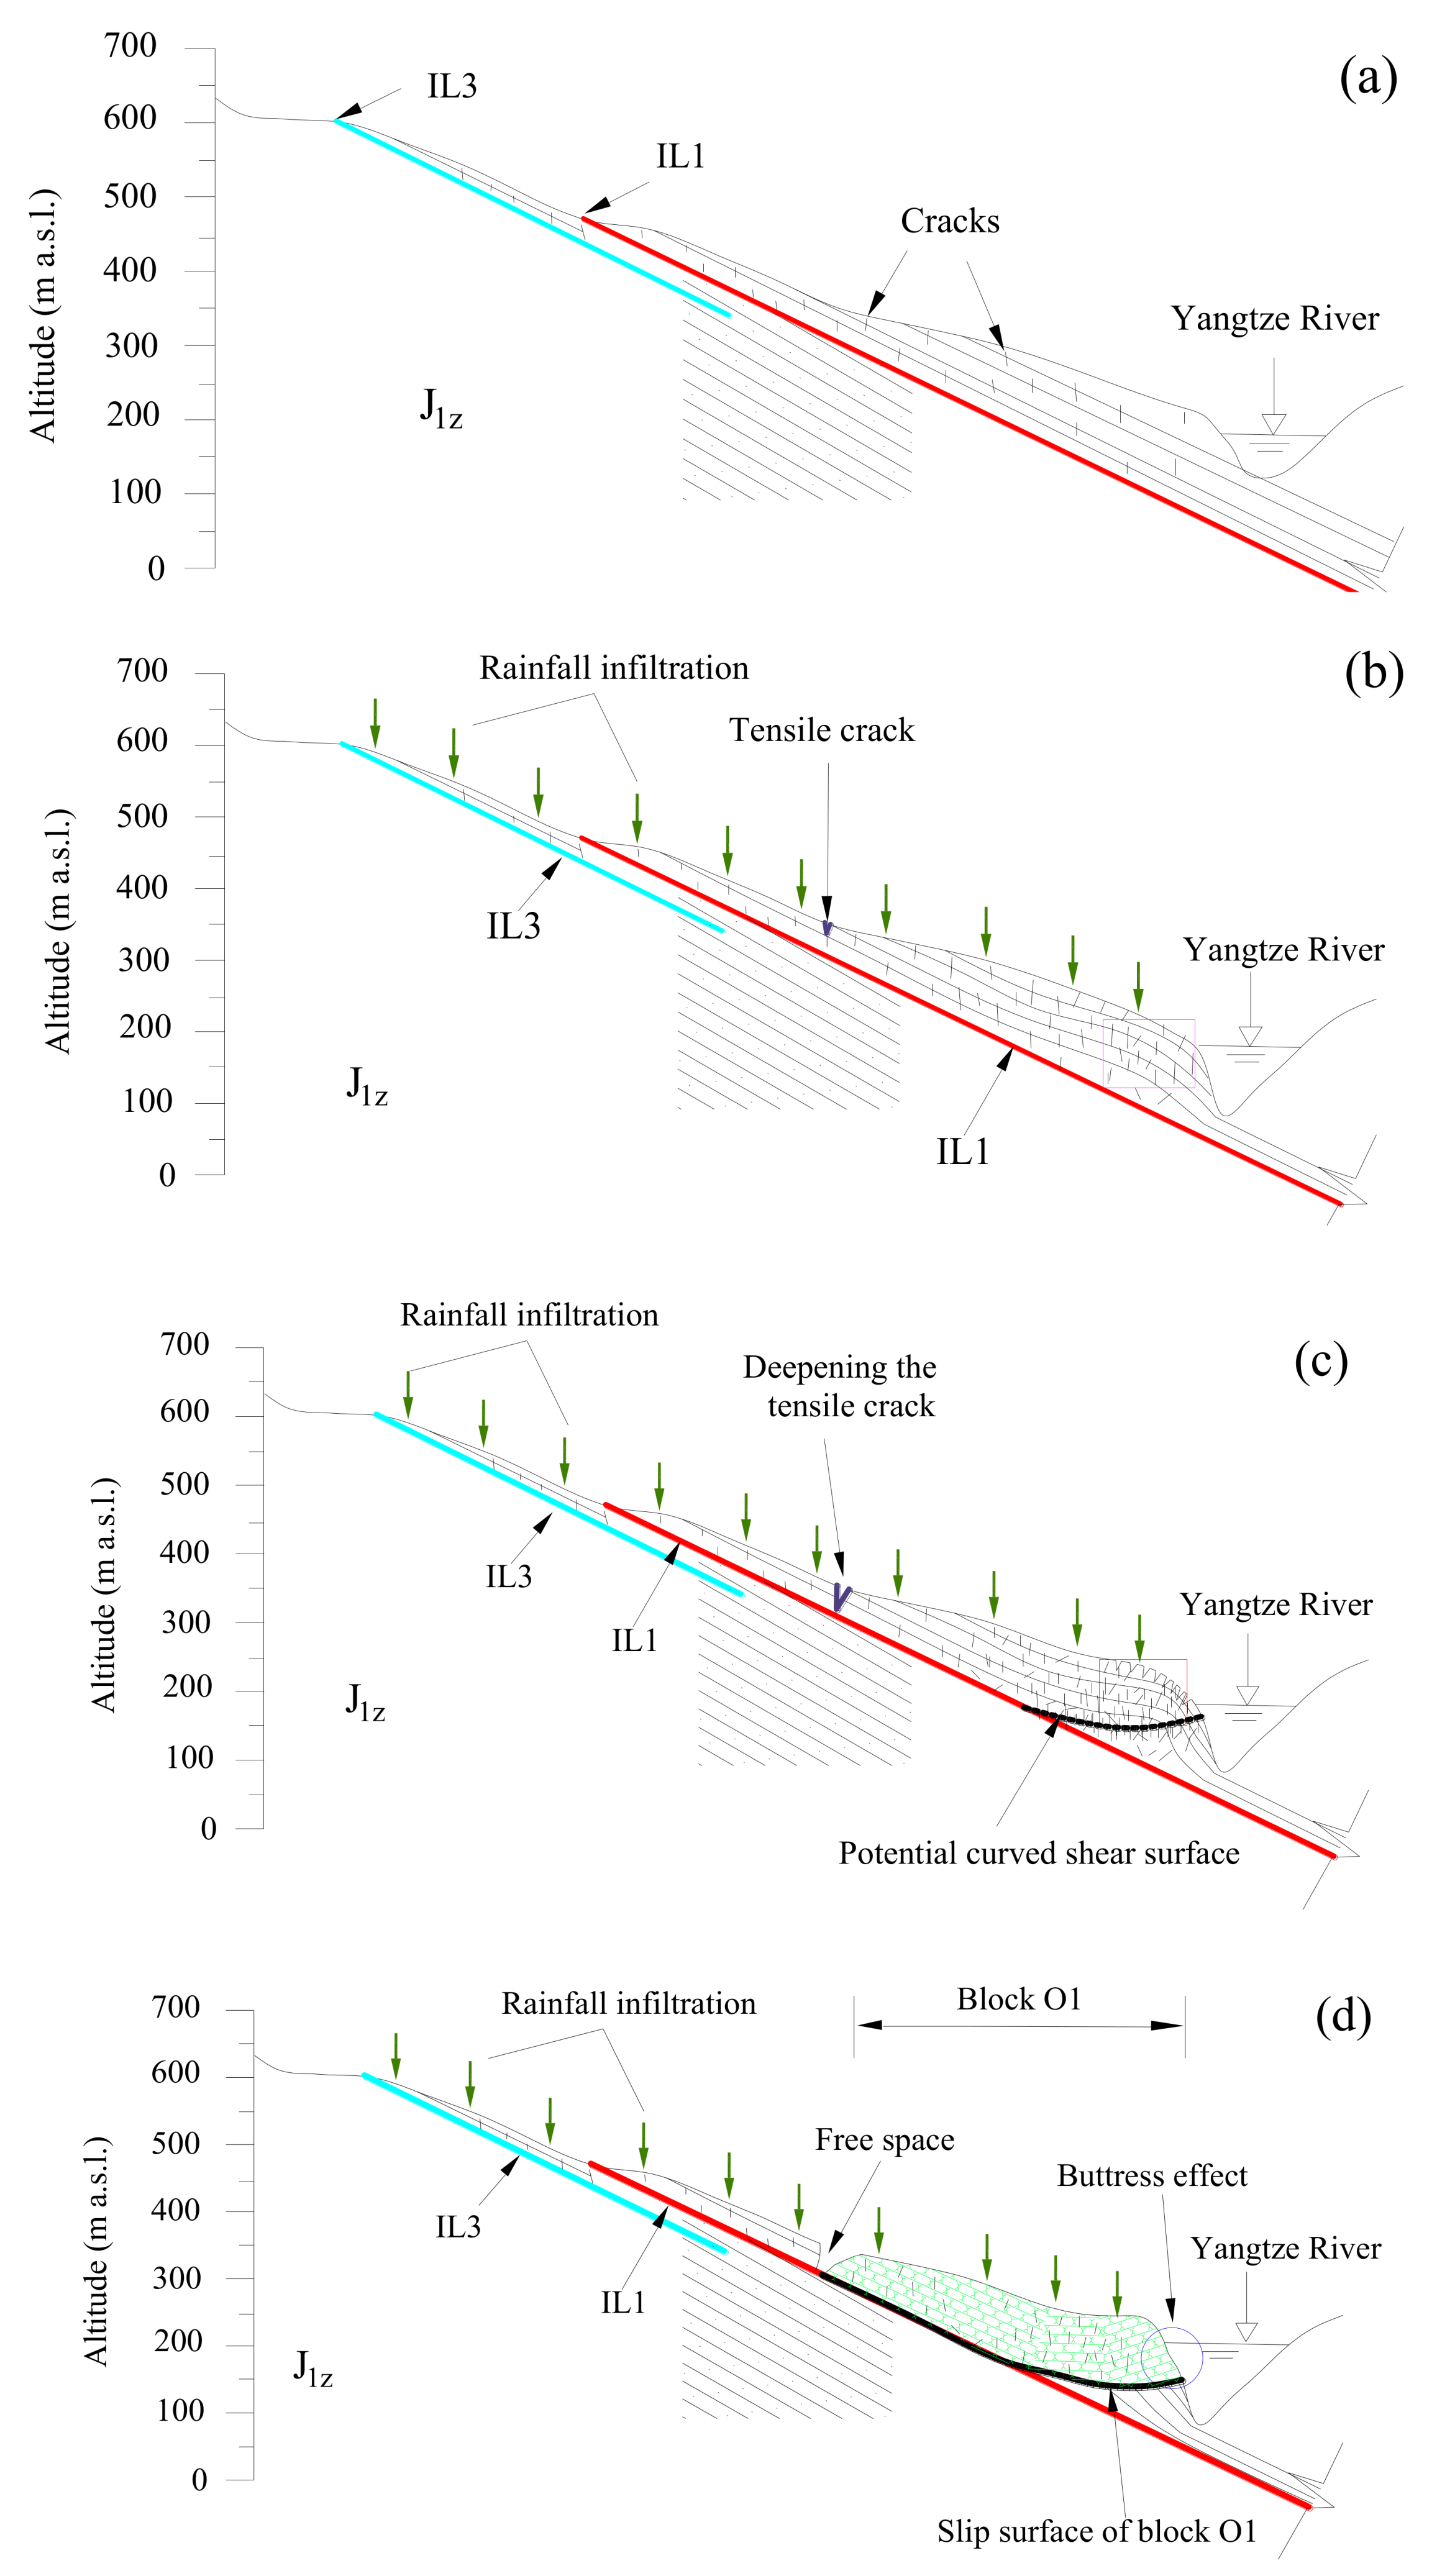
- The lithostratigraphy of the landslide area is mainly composed of the Lower Jurassic fine sandstone (J1Z, Figure 6), intercalated with thin incompetent layers (Figure 4a and Figure 6), and the rock layer dips outside with an attitude of 320–350°/20–28°. The alternatively distributed “soft” (incompetent layers) and “hard” (fine sandstone) rock layers that dip outside the slope easily produce cracks and slide [38]. Following the Himalayan orogeny in the Neogene, intermittent uplift, tilt, and intensive river incision processes gradually transformed the TGR area into the landscape with moderate- to low-altitude mountains and steep-dip river valleys, which offered the space for the slope deformation and companied by the occurrence of cracks (Figure 16a,b).
- The apparent age of block O1 (120,000–130,000 year ago in Figure 2) coincides with the fifth period of warm and humid climatic in the early Pleistocene, which is characterized by hot, wet seasons followed by warm, dry seasons [29]. During this period, rainwater could penetrate into the rock mass along the fissures and even reach the IL1. On one hand, the IL1 would be subjected to the effect of softening and argillization [39] caused by the infiltrated rainwater. On the other hand, the relatively higher water pressure induced by the water inflow could bring about a larger buoyant stress [40]. Both of these, caused by infiltrated rainwater (the action of softening and argillization, as well as larger uplift pressure), could be conducive to the overlying rock stratum creep-sliding along IL1, bringing about the occurrence of new cracks and extension of the pre-existing cracks toward the depths (Figure 16b). Considering that both blocks O1 and O2 have different apparent ages but creep-slid along IL1 together, an assumed existing tension crack (Figure 16b) at the slope surface is acceptable. Moreover, the dip direction of the fractured sandstone layer at the toe area is opposed to that of the slope surface (Figure 3c), where slight bending of the rock stratum towards outside the slope at the toe is expected (bounded by a rectangle in Figure 16b). The possible explanation for this might be that IL1 is not exposed at the front part, and the dip slope suffered from a sliding-buckling movement pattern.
- Due to the long-term effects imposed by precipitation and gravitation, rock stratum would creep slide along IL1 incessantly, deepening the crack toward IL1 (Figure 16c). Meanwhile, the fracture and flexure of the rock mass toward outside the slope at the toe could become increasingly intensive due to the buckling deformation, accompanied by the occurrence of numerous fissures (bounded by rectangle in Figure 16c). The attitude of the bedding planes near the toe area (Figure 3c) of O1 could prove the processes of bending and fracturing of the rock stratum. These processes, in return, further promote that the rainfall seeped into the slope and formation of a potential irregular failure surface, coalescing with the IL1 gradually (Figure 16c). Approximately 120,000–130,000 years ago, the O1 slid along a curved shear surface at the toe and IL1 (Figure 16d). Thus, the sliding–bulking could be regarded as the formation mechanism of O1.
- After the sliding of O1, the space in front of the following part was available and IL1 was exposed at the rear part of O1 (Figure 16d). According to the apparent ages of blocks O2 and O3, they were formed during the third period of warm and humid climate of the early Pleistocene, which is also characterized by hot and wet seasons followed by warm, dry seasons [29]. The water would continuously degrade the physical–mechanical properties of IL1 [17]. About 49,000–68,000 years ago, another landslide, namely block O2, occurred, which might have been caused by rainfall or other factors. Field investigation indicated that block O2 moved along the IL1; thus, the planar slide is believed to be the formation mechanism of block O2.
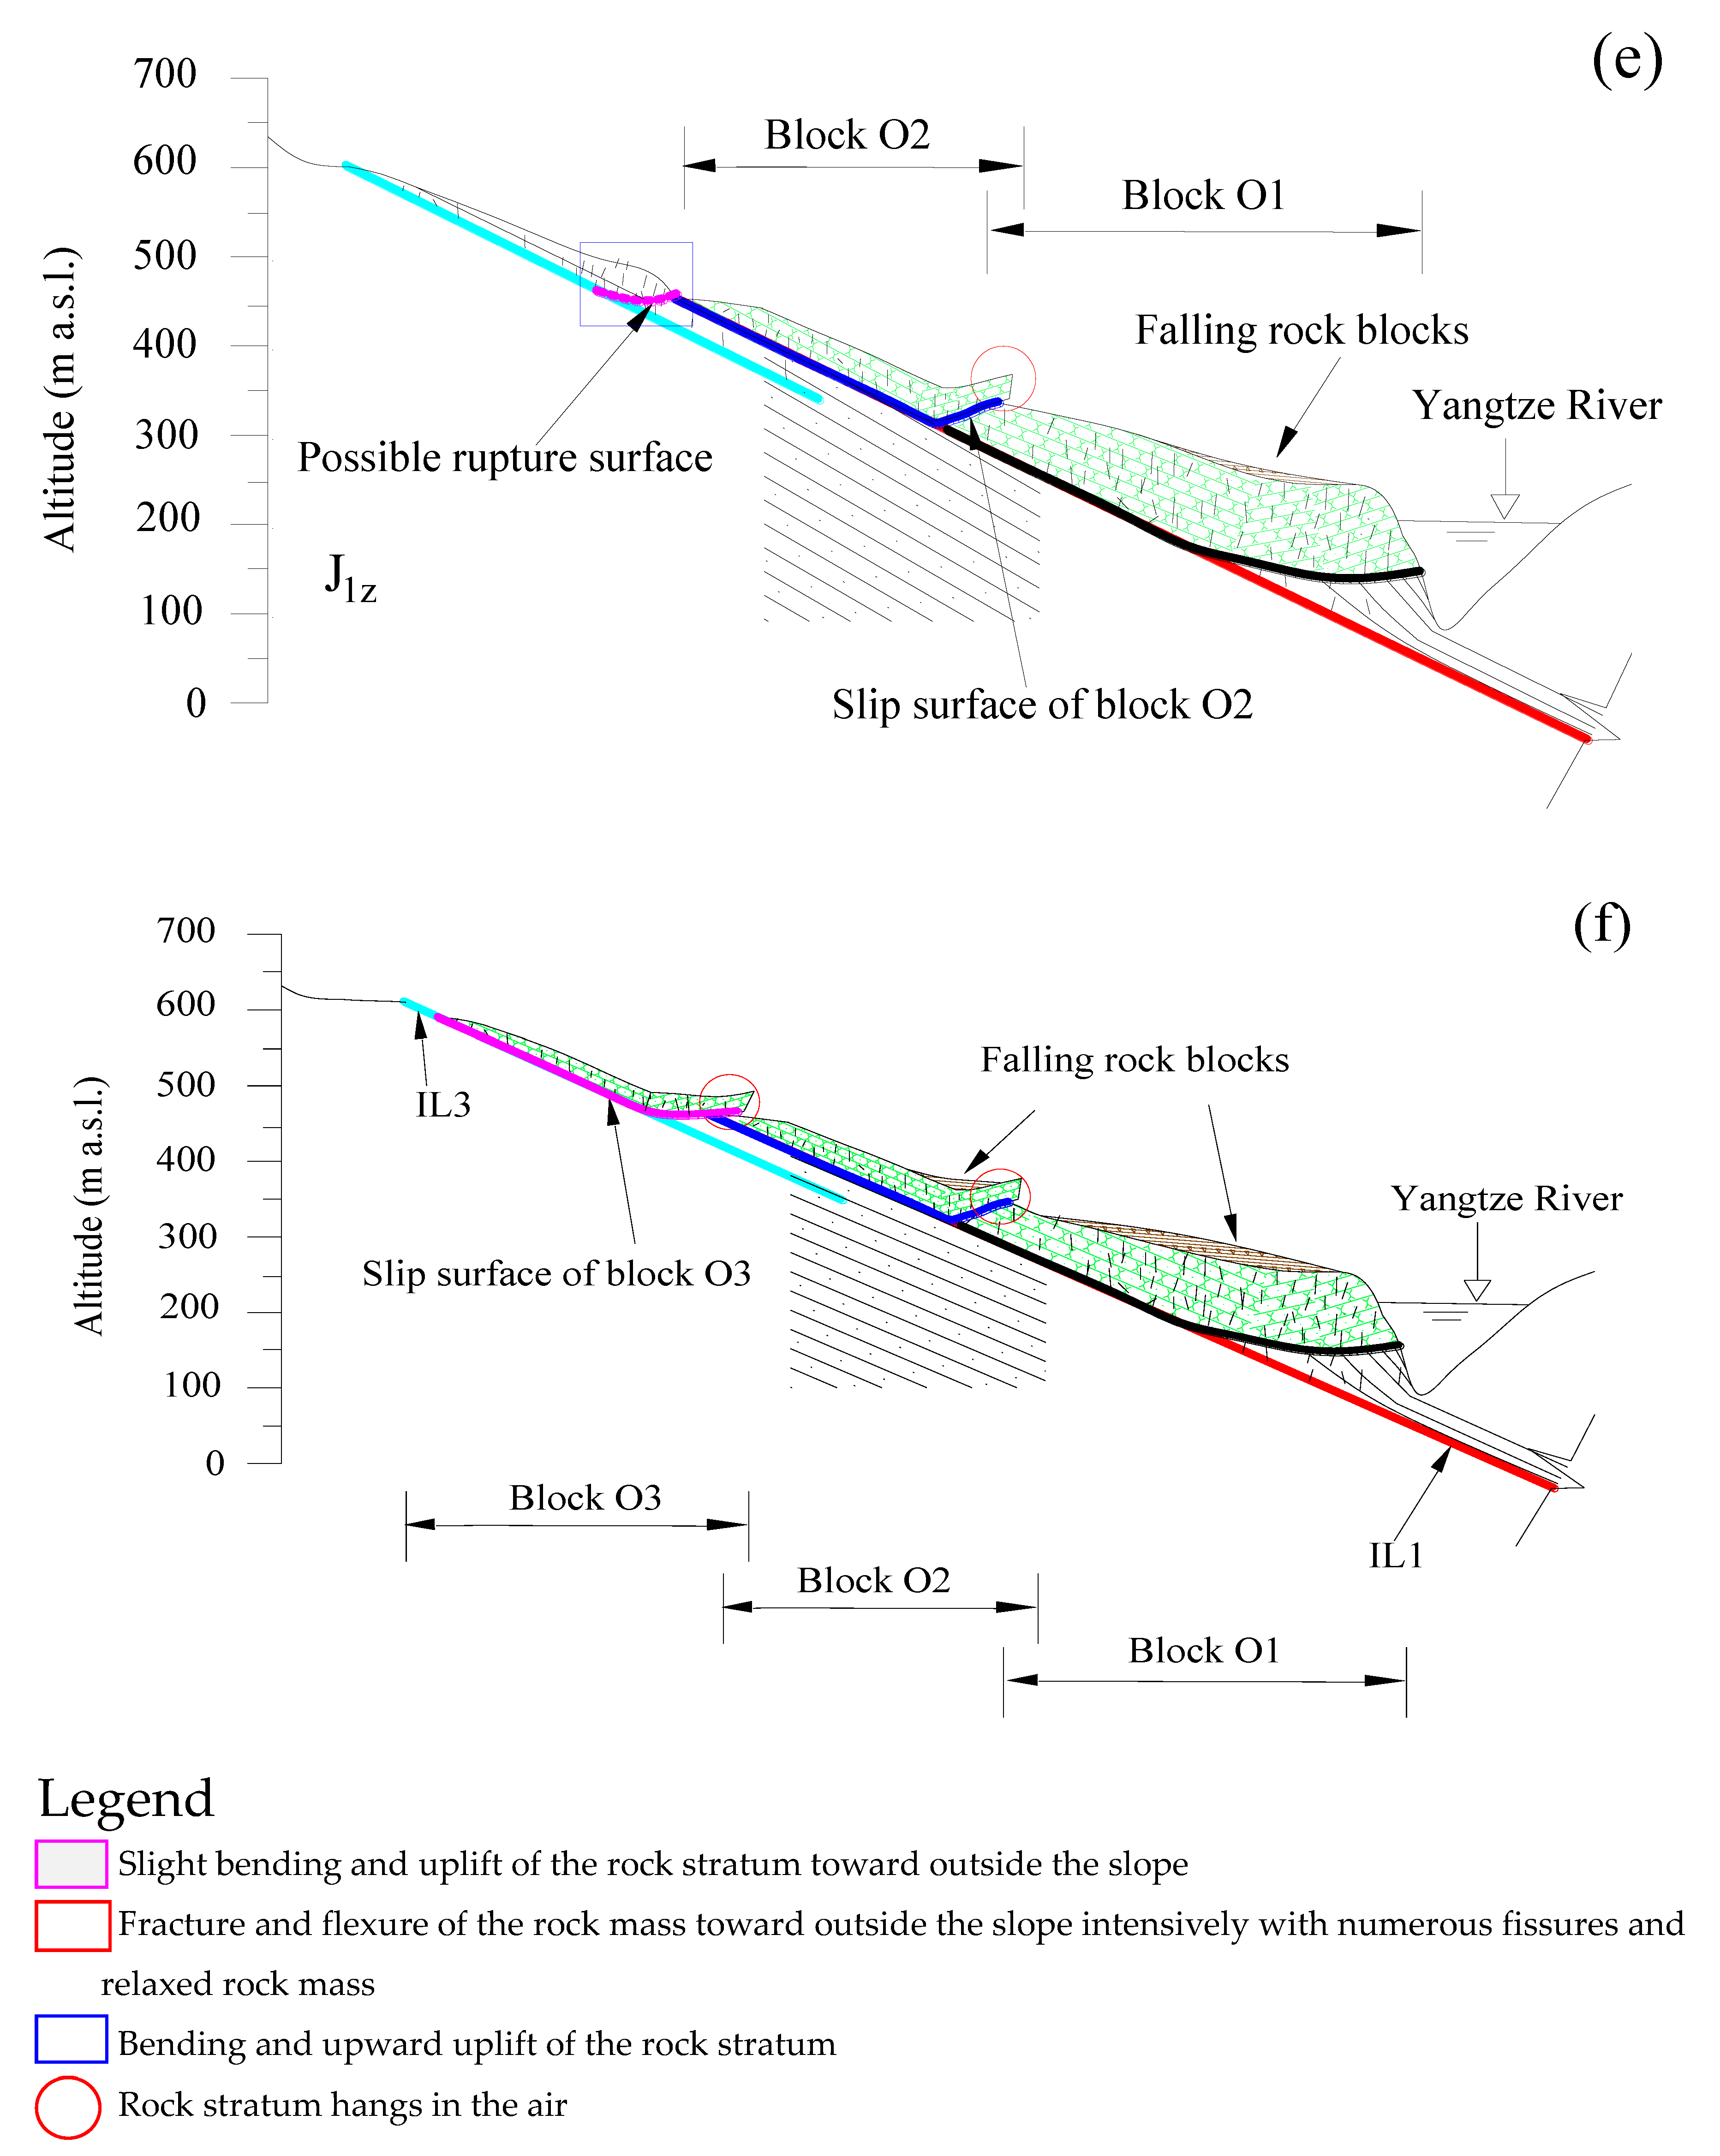
- Due to the blockage of the rear area of O1, block O2 climbed along the crest surface of O1 and covered it under the action of gravity. During this process, the partially displaced materials (rock mass) at the front part of O2 were overhung, fell, and accumulated along the slope surface of O1, forming a hanging cliff dipping into the slope (bounded by a circle in Figure 16e). Moreover, due to the hindrance of the rear part of block O1, the rock stratum at the lower part of O2 rotated, resulting in the opposite dip direction of bedding planes, referred to as the natural ones.
- The slide of block O2 would lead to the unloading at the bottom of the upper rock stratum. This promotes that the upper rock mass slid along IL3 and gave rise to buckling (bounded by a rectangle in Figure 16e), resulting in the landslide of block O3 occurring 47,000–49,000 years ago with a similar pattern to that of O1 (Figure 16f). Similarity, the crown part of block O2 was covered by O3.
- For both blocks O2 and O3, the pushed-out rock mass is suspended without support at their bottoms (marked by a circle in Figure 16e,f); local cracking and collapse frequently occurred in the area, caused by the impacts of long-term gravity and weather, which may explain why the frontal boundary of both blocks O2 and O3 are small-scale cliffs with many fissures (Figure 6c for O2, Figure 6e for O3). Meanwhile, the falling rock blocks from these cliffs would move downslope and accumulate on the slope surface (circled in red color in Figure 16e,f). For the Outang landside, the formation mechanism for both blocks O1 and O3 is sliding–bulking, and is planar slide for block O2.
5.2. Comparison with Other Published Articles
When the slope deforms and is regarded as a reactivated landslide, several crucial questions, including the key triggering factors and the corresponding triggering mechanism, likelihood displacement evolution, and the available emergency civil protection actions, would be put forward, which is are of special concern for the local residents and state authorities. The Outang landslide was identified as a reactivated ancient instability during the first trial impoundment in TGR in 2003. Since then, many researchers have focused substantial attention on this ancient landslide. The cumulative surface displacement of the Outang landslide was predicted based on variational mode decomposition theory and time series analysis. The results predicted by the means of the proposed model (Wavelet Analysis-Grey Wolf Optimizer-Back Propagation) are nearly in line with the in situ GPS data [27]. The quantitative risk assessment of the Outang landslide from the viewpoint of decision-making has also been conducted, and the results show that the risk level is highest during the overlap of fast drawdown operation and the rainfall season [41]. Both the peak and residual shear strength properties were used to conducted the analysis of the stability of the Outang landslide under different environmental scenarios, and the results suggest that the evaluation of the slope’s stability should take the residual shear strength (RSS) parameters into account [28].
However, related published scientific literature focusing on the study of the formation mechanism and long-term stability evolution of the Outang landslide is rare. In this study, a conceptual model for interpreting the formation mechanism and process of this landslide is proposed, namely slide–bulking for both O1 and O3, and planar slide for O2. More than six years of monitoring data indicate that the slope movements were step-like, which is consistent with other investigation results [27,41]. Both the decline of the reservoir water and the rainfall are considered as the triggering factors for the accelerated movement. There are many other landslides in the TGR region exhibiting similar behaviors (step-like movement), but the triggering factors are believed to be separate hydrological factors (reservoir water or rainfall) [42,43,44,45,46,47,48,49]. For example, Song et al. [42] hold the opinion that the decline of the reservoir water level is the key factor for the accelerated movement. However, Xia et al. [45] considered that rainfall is the dominant driving factor for the step-like movement of both the east and west shallow blocks of the Shiliushubao ancient landslide. The possible explanation for the former [42] is that the thickness of the Shuping landslide is larger, which is not conducive to the full penetration of rainwater, but favors seepage toward the outside of the slope caused by the drawdown operation [50]. The feasible reason for the latter [45] is that the landslide foot of these two shallow blocks is above the highest reservoir water level (175 m·a.s.l). For the Outang landslide, the numerical results show that the FOS of the landslide change along with the fluctuation of reservoir water level, which is characterized by increasing during filling operation and decreasing the FOS during the drawdown operation. Generally, the FOS has a tendency to decrease as time elapses, which may result from the progressive accumulation of damage inside the mobilized materials. Furthermore, when taking the precipitation into account, the FOS of Outang landslide decreased by 12%, which illustrates that both the reservoir water level and precipitation have the ability to deteriorate the slope stability.
6. Conclusions
The Outang landslide is composed of three blocks (O1, O2, and O3). The frontal parts of O2 and O3 are covered by the crests of O1 and O2, respectively. All of the blocks have a “spoon-like” shape in the cross-section, characterized by the dip direction of dip strata abruptly changing to the opposite direction at the bottom of every block. The formation mechanism for both O1 and O3 is slide–bulking, and is planar slide for O2.
The inclinometer data show that IL1 is the sliding surface of O1 and O2, IL3 is the sliding surface of O3; in addition, the west LFMZ might evolve into deep failure. The GPS time series indicates that the slope movement shows a step-like pattern, characterized by a rapid displacement period followed by a slower displacement period in each hydrological year, and the surface displacement velocities increased upslope.
The numerical results show that both rainfall and reservoir water are believed to be the major factors influencing the slope behaviors. The evolution of slope stability is closely related to the number of hydrological cycles and reduces gradually over time. Therefore, some timely measures, like the drainage system in the upper part, bank revetment, and piles anchored at the toe of the slope, as well as long-term monitoring would be helpful in landslide hazard prevention.
Author Contributions
S.L.: writing-original draft preparation; X.J.: writing and review; D.H.: supervision, conceptualization, and methodology; X.K.: data collection; Y.S. and D.G.: software and editing. All authors have read and agreed to the published version of the manuscript.
Funding
This work is supported by the National Natural Science Foundation of China (Nos. 41672300, 41972297, 41902290, and 41902270), the Chongqing Postdoctoral Science Foundation (cstc2019jcyj-bshX0032), the Open Research Fund Program of Hunan Province Key Laboratory of Safe Mining Techniques of Coal Mines (No. E21831), and the Supporting Program of Hundred Promising Innovative Talents in Hebei Provincial Education Office (No. SLRC2019027).
Acknowledgments
The first author, Shilin Luo, would like to thank the China Scholarship Council (CSC) for providing the funds for his research at the University of Alicante, Spain. We very much appreciate Roberto Tomás Jover for his contributions to the language editing.
Conflicts of Interest
The authors declare no conflict of interest.
References
- Iqbal, J.; Tu, X.; Xu, L. Landslide hazards in reservoir areas: Case study of Xiangjiaba reservoir, Southwest China. Nat. Hazards Rev. 2017, 18, 04017009. [Google Scholar] [CrossRef]
- Koch, F.; Schlenz, F.; Prasch, M.; Appel, F.; Ruf, T.; Mauser, W. Soil moisture retrieval based on GPS signal strength attenuation. Water 2016, 8, 276. [Google Scholar] [CrossRef]
- Paronuzzi, P.; Rigo, E.; Bolla, A. Influence of filling-drawdown cycles of the Vajont Reservoir on Mt. Toc slope stability. Geomorphology 2013, 191, 75–93. [Google Scholar] [CrossRef]
- Ni, J.P.; Shao, J.A. The drivers of land use change in the migration area, Three Gorges Project, China: Advances and prospects. J. Earth Sci. 2013, 24, 136–144. [Google Scholar] [CrossRef]
- Tang, H.M.; Wasowski, J.; Juang, C.H. Geohazards in the Three Gorges Reservoir Area, China—Lessons learned from decades of research. Eng. Geol. 2019, 261, 105267. [Google Scholar] [CrossRef]
- Luo, S.L.; Jin, X.G.; Huang, D. Long-term coupled effects of hydrological factors on kinematic responses of a reactivated landslide in the Three Gorges Reservoir. Eng. Geol. 2019, 261, 105271. [Google Scholar] [CrossRef]
- Tang, H.M.; Li, C.D.; Hu, X.L. Evolution characteristics of the Huangtupo Landslide based on in situ tunneling and monitoring. Landslides 2015, 12, 511–521. [Google Scholar] [CrossRef]
- Gu, D.M.; Huang, D. A complex rock topple-rock slide failure of an anaclinal rock slope in the Wu Gorge, Yangtze River, China. Eng. Geol. 2016, 208, 165–180. [Google Scholar] [CrossRef]
- Huang, B.L.; Yin, Y.P.; Du, C.L. Risk management study on impulse waves generated by Hongyanzi landslide in Three Gorges Reservoir of China on June 24, 2015. Landslides 2016, 13, 603–616. [Google Scholar] [CrossRef]
- Caloiero, T.; Pasqua, A.A.; Petrucci, O. Damaging hydrogeological events: A procedure for the assessment of severity levels and an application to Calabria (Southern Italy). Water 2014, 6, 3652–3670. [Google Scholar] [CrossRef]
- Chien, L.K.; Hsu, C.F.; Yin, L.C. Warning model for shallow landslides induced by extreme rainfall. Water 2015, 7, 4362–4384. [Google Scholar] [CrossRef] [Green Version]
- Zuo, R.G.; Carranza, E.J.M. A fractal measure of spatial association between landslides and conditioning factors. J. Earth Sci. 2017, 28, 588–594. [Google Scholar] [CrossRef]
- Pinyol, N.M.; Alonso, E.E.; Olivella, S. Rapid drawdown in slopes and embankments. Water Resour. Res. 2008, 44. [Google Scholar] [CrossRef]
- Pinyol, N.M.; Alonso, E.E.; Corominas, J. Canelles landslide: Modelling rapid drawdown and fast potential sliding. Landslides 2012, 9, 33–51. [Google Scholar] [CrossRef] [Green Version]
- Wang, Y.K.; Huang, J.S.; Tang, H.M. Global sensitivity analysis of the hydraulic parameters of the reservoir colluvial landslides in the Three Gorges Reservoir area, China. Landslides 2020, 17, 483–494. [Google Scholar] [CrossRef]
- Cao, C.; Wang, Q.; Chen, J.; Ruan, Y.; Zheng, L.; Song, S.; Niu, C. Landslide susceptibility mapping in vertical distribution law of precipitation area: Case of the xulong hydropower station reservoir, Southwestern China. Water 2016, 8, 270. [Google Scholar] [CrossRef] [Green Version]
- Deng, H.; Wu, L.Z.; Huang, R.Q. Formation of the Siwanli ancient landslide in the Dadu River, China. Landslides 2017, 14, 385–394. [Google Scholar] [CrossRef]
- Jiang, J.W.; Xiang, W.; Zhang, W. Deformation forecasting of huangtupo riverside landslide in the case of frequent microseisms. J. Earth Sci. 2016, 27, 160–166. [Google Scholar] [CrossRef]
- Wang, M.; Wan, W. A new empirical formula for evaluating uniaxial compressive strength using the Schmidt hammer test. Int. J. Rock Mech. Min. 2019, 123, 104094. [Google Scholar] [CrossRef]
- Varnes, D.J. Landslide hazard zonation: A review of principles and practice, Commission on landslides of the IAEG, UNESCO. Nat. Haz. 1984, 3, 61. [Google Scholar]
- Bathrellos, G.D.; Gaki-Papanastassiou, K.; Skilodimou, H.D.; Skianis, G.A.; Chousianitis, K.G. Assessment of rural community and agricultural development using geomorphological–geological factors and GIS in the Trikala prefecture (Central Greece). Stoch. Environ. Res. Risk Assess. 2013, 27, 573–588. [Google Scholar] [CrossRef]
- Bathrellos, G.D.; Karymbalis, E.; Skilodimou, H.D.; Gaki-Papanastassiou, K.; Baltas, E.A. Urban flood hazard assessment in the basin of Athens Metropolitan city, Greece. Environ. Earth Sci. 2016, 75, 319. [Google Scholar] [CrossRef]
- Papadopoulou-Vrynioti, K.; Bathrellos, G.D.; Skilodimou, H.D.; Kaviris, G.; Makropoulos, K. Karst collapse susceptibility mapping considering peak ground acceleration in a rapidly growing urban area. Eng. Geol. 2013, 158, 77–88. [Google Scholar] [CrossRef]
- Chen, T.; Zhu, L.; Niu, R.Q. Mapping landslide susceptibility at the Three Gorges Reservoir, China, using gradient boosting decision tree, random forest and information value models. J. Mt. Sci. 2020, 17, 670–685. [Google Scholar] [CrossRef]
- Bathrellos, G.D.; Skilodimou, H.D.; Chousianitis, K.; Youssef, A.M.; Pradhan, B. Suitability estimation for urban development using multi-hazard assessment map. Sci Total Environ. 2017, 575, 119–134. [Google Scholar] [CrossRef]
- Ma, J.W.; Su, A.J.; Zhang, J.R. Reliability analysis for a large and complex landslide in the three gorges reservoir area (China) based on incomplete information. Geo. Nat. Haz. Risk. 2019, 10, 181–196. [Google Scholar] [CrossRef] [Green Version]
- Guo, Z.; Chen, L.; Gui, L. Landslide displacement prediction based on variational mode decomposition and WA-GWO-BP model. Landslides 2020, 17, 567–583. [Google Scholar] [CrossRef]
- Yang, X.H.; Vanapalli, S. Slope Stability Analyses of Outang Landslide Based on the Peak and Residual Shear Strength Behavior. Adv. Eng. Sci. 2019, 51, 55–68. [Google Scholar]
- Zhang, Y.S.; Wu, R.L.; Guo, C.B. Research progress and prospect on reactivation of ancient landslides. Chin. J. Adv. Earth Sci. 2018, 33, 728–740, (In Chinese with English Abstract). [Google Scholar]
- Fourniadis, I.G.; Liu, J.G.; Mason, P.J. Landslide hazard assessment in the Three Gorges area, China, using aster imagery: Wushan–Badong. Geomorphology 2017, 84, 126–144. [Google Scholar] [CrossRef] [Green Version]
- Liu, J.G.; Mason, P.J.; Clerici, N. Landslide hazard assessment in the Three Gorges area of the Yangtze river using ASTER imagery: Zigui–Badong. Geomorphology 2004, 61, 171–187. [Google Scholar] [CrossRef]
- Geo-Slope International, Ltd. Stability Modeling with SEEP/W 2010-An Engineering Methodology; Geo-Slope International, Ltd.: Calgary, AB, Canada, 2012. [Google Scholar]
- Yin, Y.P.; Huang, B.; Wang, W. Reservoir-induced landslides and risk control in Three Gorges Project on Yangtze River, China. J. Rock Mech. Geotech. Eng. 2016, 8, 577–595. (In English) [Google Scholar] [CrossRef] [Green Version]
- Dai, Z.W. Study on the Deformation and Failure Mechanism of Outang Landslide in the Τhree Gorges Reservoir Region, China. Ph.D. Thesis, Chang’an University, Xi’an, China, 13 June 2016. (In Chinese with English Abstract). [Google Scholar]
- Van Genuchten, M.T. A close form equation predicting the hydraulic conductivity of unsaturated soil. Soil Sci. Soc. Am. J. 1980, 44, 892–898. [Google Scholar] [CrossRef] [Green Version]
- Lane, P.A.; Griffiths, D.V. Assessment of Stability of Slopes under Drawdown Conditions. J. Geotech. Geoenviron. 2000, 126, 443–450. [Google Scholar] [CrossRef]
- Huang, D.; Gu, D.M.; Song, Y.X. Towards a complete understanding of the triggering mechanism of a large reactivated landslide in the Three Gorges Reservoir. Eng. Geol. 2018, 238, 36–51. [Google Scholar] [CrossRef]
- Zhao, B.; Wang, Y.; Wang, Y. Triggering mechanism and deformation characteristics of a reactivated ancient landslide, Sichuan province, China. Landslides 2018, 16, 383–393. [Google Scholar] [CrossRef]
- Zhao, Y.; Xu, M.; Zhao, H.M. Study on the critical water head in the trailing edge of translational landslide. In Proceedings of the 11th International and 2nd North American Symposium on Landslides, Banff, AB, Canada, 3–8 June 2012; pp. 693–698. [Google Scholar]
- Zhao, Y.; Xu, M.; Guo, J. Accumulation characteristics, mechanism, and identification of an ancient translational landslide in China. Landslides 2015, 12, 1119–1130. [Google Scholar] [CrossRef]
- Guo, Z.; Chen, L.; Yin, K.; Shrestha, D.P.; Zhang, L. Quantitative risk assessment of slow-moving landslides from the viewpoint of decision-making: A case study of the Three Gorges Reservoir. Eng. Geol. 2020, 273, 105667. [Google Scholar] [CrossRef]
- Song, K.; Wang, F.W.; Yi, Q.I.; Lu, S.Q. Landslide deformation behavior influenced by water level fluctuations of the three Gorges Reservoir (China). Eng. Geol. 2018, 247, 58–68. [Google Scholar] [CrossRef]
- Tomás, R.; Li, Z.; Liu, P.; Singleton, A.; Hoey, T.; Cheng, X. Spatiotemporal characteristics of the Huangtupo landslide in the Three Gorges region (China) constrained by radar interferometry. Geophys. J. Int. 2014, 197, 213–232. [Google Scholar] [CrossRef] [Green Version]
- Tomás, R.; Li, Z.; Lopez-Sanchez, J.M.; Liu, P.; Singleton, A. Using wavelet tools to analyse seasonal variations from InSAR time-series data: A case study of the Huangtupo landslide. Landslides 2016, 13, 437–450. [Google Scholar] [CrossRef] [Green Version]
- Xia, M.; Ren, G.M.; Ma, X.L. Deformation and mechanism of landslide influenced by the effects of reservoir water and rainfall, three Gorges, China. Nat. Hazards 2013, 68, 467–482. [Google Scholar] [CrossRef]
- Huang, D.; Gu, D.M. Influence of filling-drawdown cycles of the Three Gorges Reservoir on deformation and failure behaviors of anaclinal rock slopes in the Wu Gorge. Geomorphology 2017, 295, 489–506. [Google Scholar] [CrossRef]
- Iqbal, J.; Dai, F.M.; Hong, M. Failure Mechanism and Stability Analysis of an Active Landslide in the Xiangjiaba Reservoir Area, Southwest China. J. Earth Sci. 2018, 29, 646–661. [Google Scholar] [CrossRef]
- Tang, H.; Li, C.; Hu, X.; Wang, L.; Criss, R.; Su, A.; Wu, Y.; Xiong, C. Deformation response of the Huangtupo landslide to rainfall and the changing levels of the Three Gorges Reservoir. Bull. Eng. Geol. Environ. 2014, 74, 933–942. [Google Scholar] [CrossRef]
- Zangerl, C.; Eberhardt, E.; Perzlmaier, S. Kinematic behavior and velocity characteristics of a complex deep-seated crystalline rockslide system in relation to its interaction with a dam reservoir. Eng. Geol. 2010, 112, 53–67. [Google Scholar] [CrossRef]
- Cruden, D.M.; Varnes, D.J. Landslide types and processes, special report, transportation research board. Natl. Acad. Sci. 1996, 247, 36–75. [Google Scholar]
Figure 1.
Landslide location and geological map of the study area: (a) regional geological setting and tectonic features of the study area; (b) panoramic photograph of the Outang landslide.
Figure 1.
Landslide location and geological map of the study area: (a) regional geological setting and tectonic features of the study area; (b) panoramic photograph of the Outang landslide.

Figure 2.
Topographical map of the Outang landslide with the location of monitoring instruments. Arrows show the magnitude and direction of displacements vectors measured by global positioning system (GPS).
Figure 2.
Topographical map of the Outang landslide with the location of monitoring instruments. Arrows show the magnitude and direction of displacements vectors measured by global positioning system (GPS).

Figure 3.
Component and structure of mobilized materials of the landslide: (a) gravel soil (surficial material) and fractured sandstone near the toe; (b) bedding planes and rock disclosed by adit; (c) bedding planes and rock daylighting at the landslide foot.
Figure 3.
Component and structure of mobilized materials of the landslide: (a) gravel soil (surficial material) and fractured sandstone near the toe; (b) bedding planes and rock disclosed by adit; (c) bedding planes and rock daylighting at the landslide foot.

Figure 4.
Incompetent layers (ILs): (a) outcrops of the IL1, IL2, and IL3. (b1,b2) IL1 and IL3 revealed by trench adit and trench, separately. (c1,c2) Striated polished surface in IL1 and IL3 revealed by adit and trench exploration.
Figure 4.
Incompetent layers (ILs): (a) outcrops of the IL1, IL2, and IL3. (b1,b2) IL1 and IL3 revealed by trench adit and trench, separately. (c1,c2) Striated polished surface in IL1 and IL3 revealed by adit and trench exploration.

Figure 5.
Bedrock and the orientation of the bedding planes, revealed by a horizontal adit.

Figure 6.
Geological profile section of A–A in Figure 2 and signs of landslide activity (a,b) located at block O1, (c,d) located at block O2, and (e,f) located at block O3.
Figure 6.
Geological profile section of A–A in Figure 2 and signs of landslide activity (a,b) located at block O1, (c,d) located at block O2, and (e,f) located at block O3.

Figure 7.
Monitoring results from inclinometers that were installed on local fast movement zones (LFMZs) (a,b) and three blocks (c–e).
Figure 7.
Monitoring results from inclinometers that were installed on local fast movement zones (LFMZs) (a,b) and three blocks (c–e).

Figure 8.
Time evolution of cumulative displacement during the monitoring period.

Figure 9.
(a) Hydrological factors (reservoir water and precipitation) and (b–e) time-dependent change in daily displacement velocities, measured at the selected GPS points (MJ01, MJ05, MJ08, and TN03).
Figure 9.
(a) Hydrological factors (reservoir water and precipitation) and (b–e) time-dependent change in daily displacement velocities, measured at the selected GPS points (MJ01, MJ05, MJ08, and TN03).

Figure 10.
Model for the Outang landslide built by GEO-STUDIO.

Figure 11.
Permeability coefficient as a function of matric suction.

Figure 12.
Seepage condition during the drawdown operation. (a) The seepage condition of the slope on 20 April 2011; (b) the seepage condition of the slope on 29 May 2011.
Figure 12.
Seepage condition during the drawdown operation. (a) The seepage condition of the slope on 20 April 2011; (b) the seepage condition of the slope on 29 May 2011.

Figure 13.
Seepage conditions during the rainfall season, when reservoir water level remains nearly 145 m a.s.l.; (a) the seepage condition of the slope on 10 June 2011. (b) The seepage condition of the slope on 27 August 2011.
Figure 13.
Seepage conditions during the rainfall season, when reservoir water level remains nearly 145 m a.s.l.; (a) the seepage condition of the slope on 10 June 2011. (b) The seepage condition of the slope on 27 August 2011.

Figure 14.
Seepage condition on 3 December 2011, when reservoir experienced filling operation.

Figure 15.
The long-term stability evolution of Outang landslide under effects of reservoir water level and rainfall.
Figure 15.
The long-term stability evolution of Outang landslide under effects of reservoir water level and rainfall.

Figure 16.
Conceptual model of the formation mechanism and process for the landslide. (a) Fluvial incision, (b) creation of tensile crack and buckling in block O1, (c) intensive buckling and curved shear surface occurring at the bottom of block O1, (d) formation of block O1and emergence of the free space in the front of block O2, (e) formation of block O2, (f) formation of block O3.


Table 1.
Physical and mechanical properties of the landslide.
| Soil Type | Unit Weight γ (kN/m3) | Friction Angle φ (°) | Cohesion c (kPa) | Elastic Modulus E (MPa) | Poisson’s Ratio μ |
|---|---|---|---|---|---|
| Gravel soil (landslide body) | 19.5 | 21 | 25 | 60 | 0.32 |
| Fractured sandstone (landslide body) | 21.0 | 29 | 39 | 120 | 0.30 |
| Weak interlayers (sliding zone soil) | 19.0 | 18 | 13 | 15 | 0.37 |
| Fine sandstone (bedrock) | 24.2 | 34 | 20,000 | 26,000 | 0.22 |
Table 2.
Hydromechanical properties of landslide in numerical simulation (modified from Dai (2016)).
Table 2.
Hydromechanical properties of landslide in numerical simulation (modified from Dai (2016)).
| Material | SWCC | θs (m3/m3) | θr (m3/m3) | Ks (m/s) | ||
|---|---|---|---|---|---|---|
| A (kPa−1) | n | n | ||||
| Gravel soil | 1.10 | 3.40 | 0.73 | 0.35 | 0.021 | 1.7 × 10⁻⁷ |
| Fractured sandstone | 1.11 | 3.86 | 0.71 | 0.48 | 0.095 | 2.2 × 10⁻⁵ |
| Incompetent layers | 0.04 | 2.07 | 0.52 | 0.45 | 0.010 | 1.3 × 10⁻⁸ |
© 2020 by the authors. Licensee MDPI, Basel, Switzerland. This article is an open access article distributed under the terms and conditions of the Creative Commons Attribution (CC BY) license (http://creativecommons.org/licenses/by/4.0/).
Share and Cite
MDPI and ACS Style
Luo, S.; Jin, X.; Huang, D.; Kuang, X.; Song, Y.; Gu, D. Reactivation of a Huge, Deep-Seated, Ancient Landslide: Formation Mechanism, Deformation Characteristics, and Stability. Water 2020, 12, 1960. https://doi.org/10.3390/w12071960
AMA Style
Luo S, Jin X, Huang D, Kuang X, Song Y, Gu D. Reactivation of a Huge, Deep-Seated, Ancient Landslide: Formation Mechanism, Deformation Characteristics, and Stability. Water. 2020; 12(7):1960. https://doi.org/10.3390/w12071960
Chicago/Turabian StyleLuo, Shilin, Xiaoguang Jin, Da Huang, Xibin Kuang, Yixiang Song, and Dongming Gu. 2020. "Reactivation of a Huge, Deep-Seated, Ancient Landslide: Formation Mechanism, Deformation Characteristics, and Stability" Water 12, no. 7: 1960. https://doi.org/10.3390/w12071960
Note that from the first issue of 2016, this journal uses article numbers instead of page numbers. See further details here.