
Comparative Study on Hydrolysis, Physicochemical and Antioxidant Properties in Simulated Digestion System between Cooked Pork and Fish Meat

Abstract
:
1. Introduction
2. Materials and Methods
2.1. Materials
2.2. Meat Cooking
2.3. Preparation of IVD
2.4. Degree of Hydrolysis
2.5. Particle Size and Zeta Potential Determination
2.6. Microscopic Morphological Observations
2.7. SDS-PAGE
2.8. TCA-Soluble Peptides
2.9. Molecular Weight Distribution
2.10. Amino Acid Composition
2.11. Circular Dichroism (CD)
2.12. Fluorescence Spectroscopy Measurement
2.13. Antioxidant Capacity Assay
2.13.1. ABTS+ Scavenging Activity
2.13.2. DPPH· Scavenging Activity
2.13.3. Ferric Reducing Ability
2.13.4. Fe2+ Chelating Ability
2.14. Statistical Analysis
3. Results and Discussion
3.1. Degree of Hydrolysis
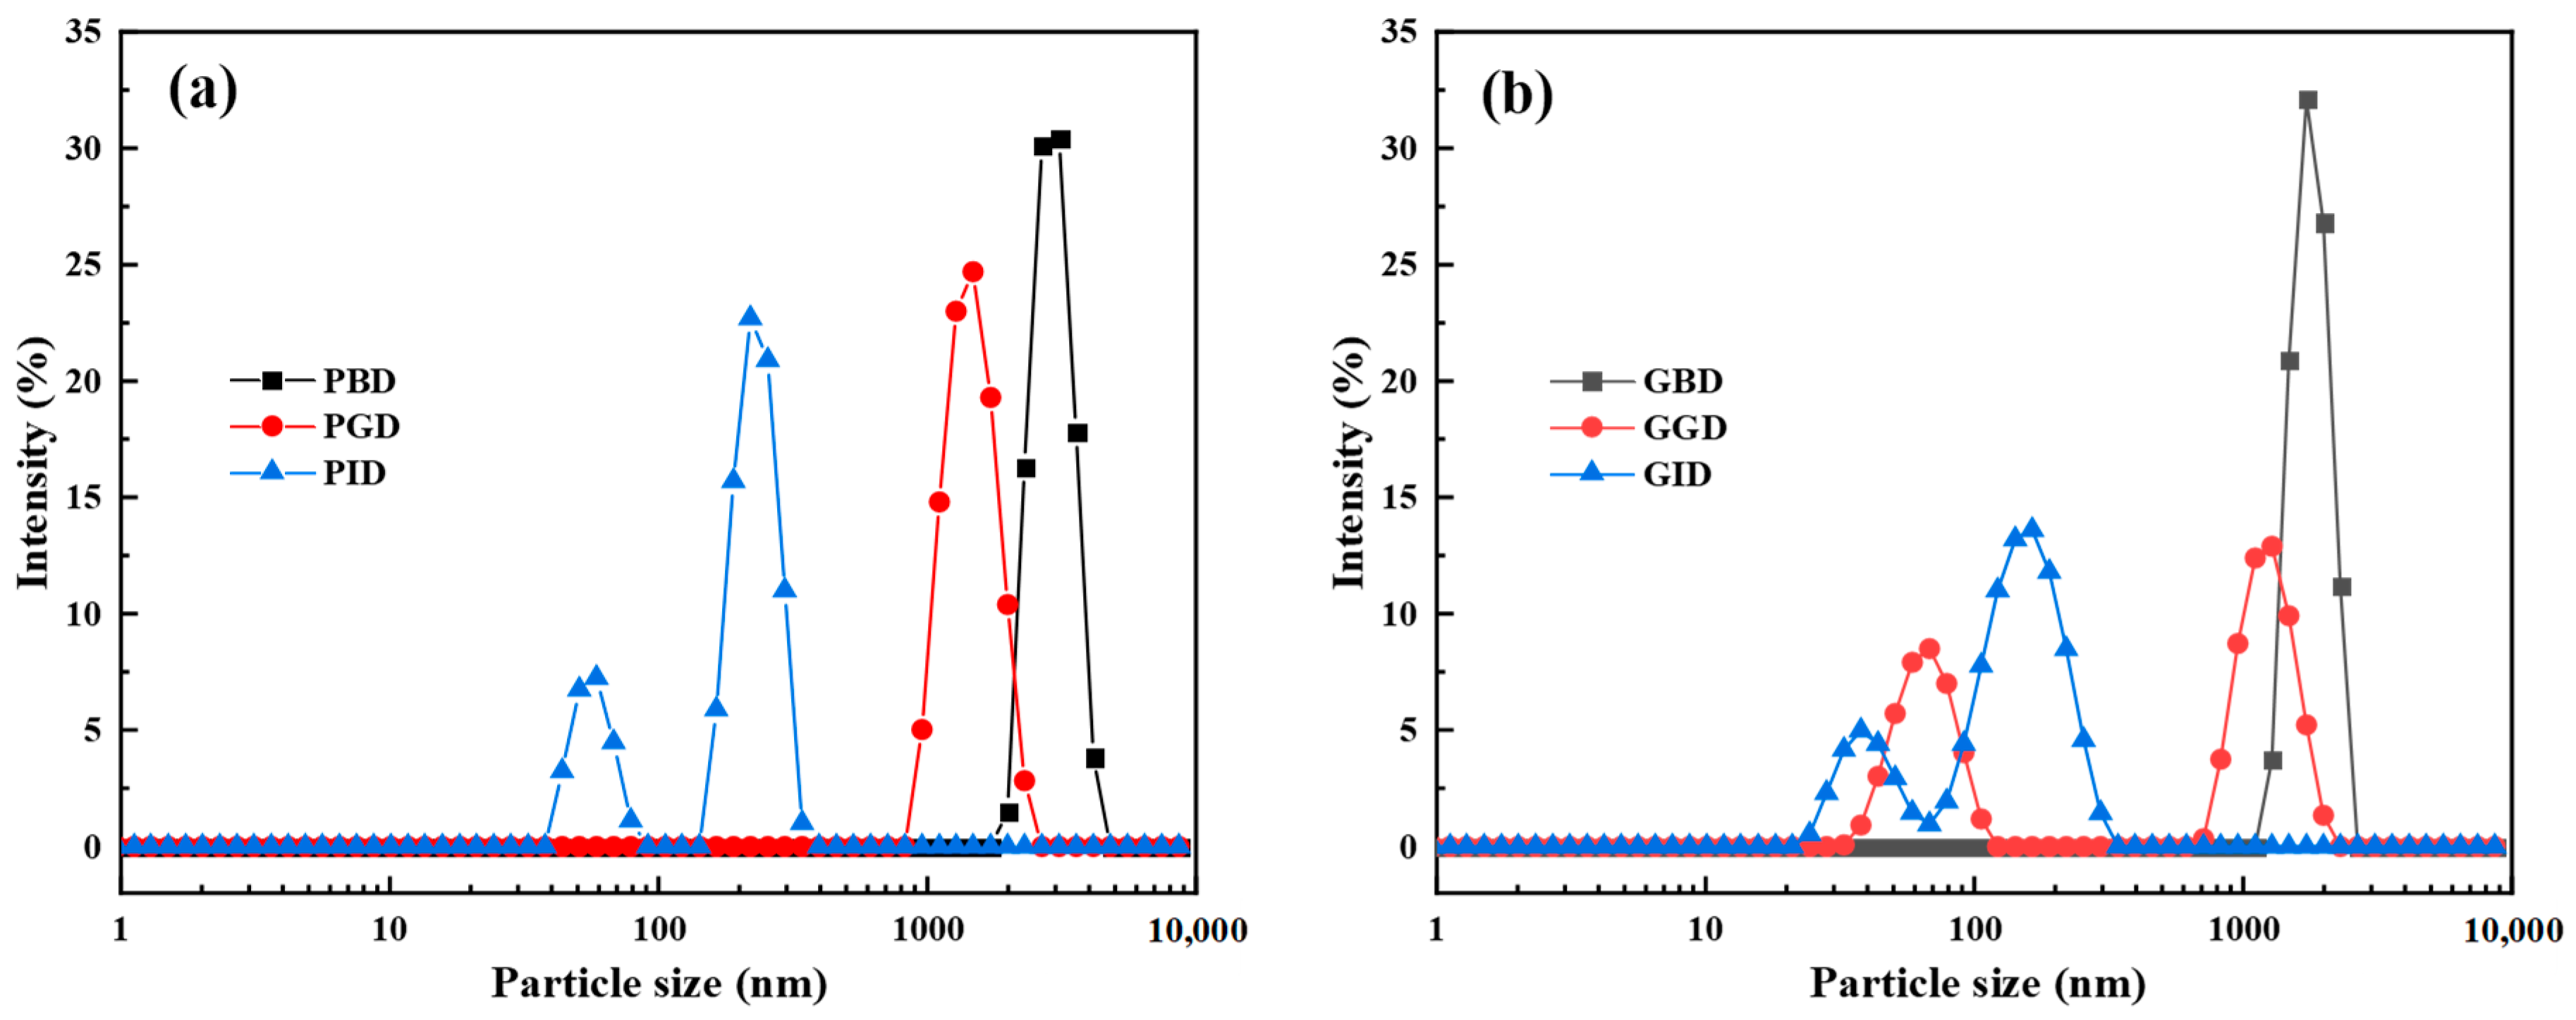
3.2. Particle Size Distribution and Zeta Potential
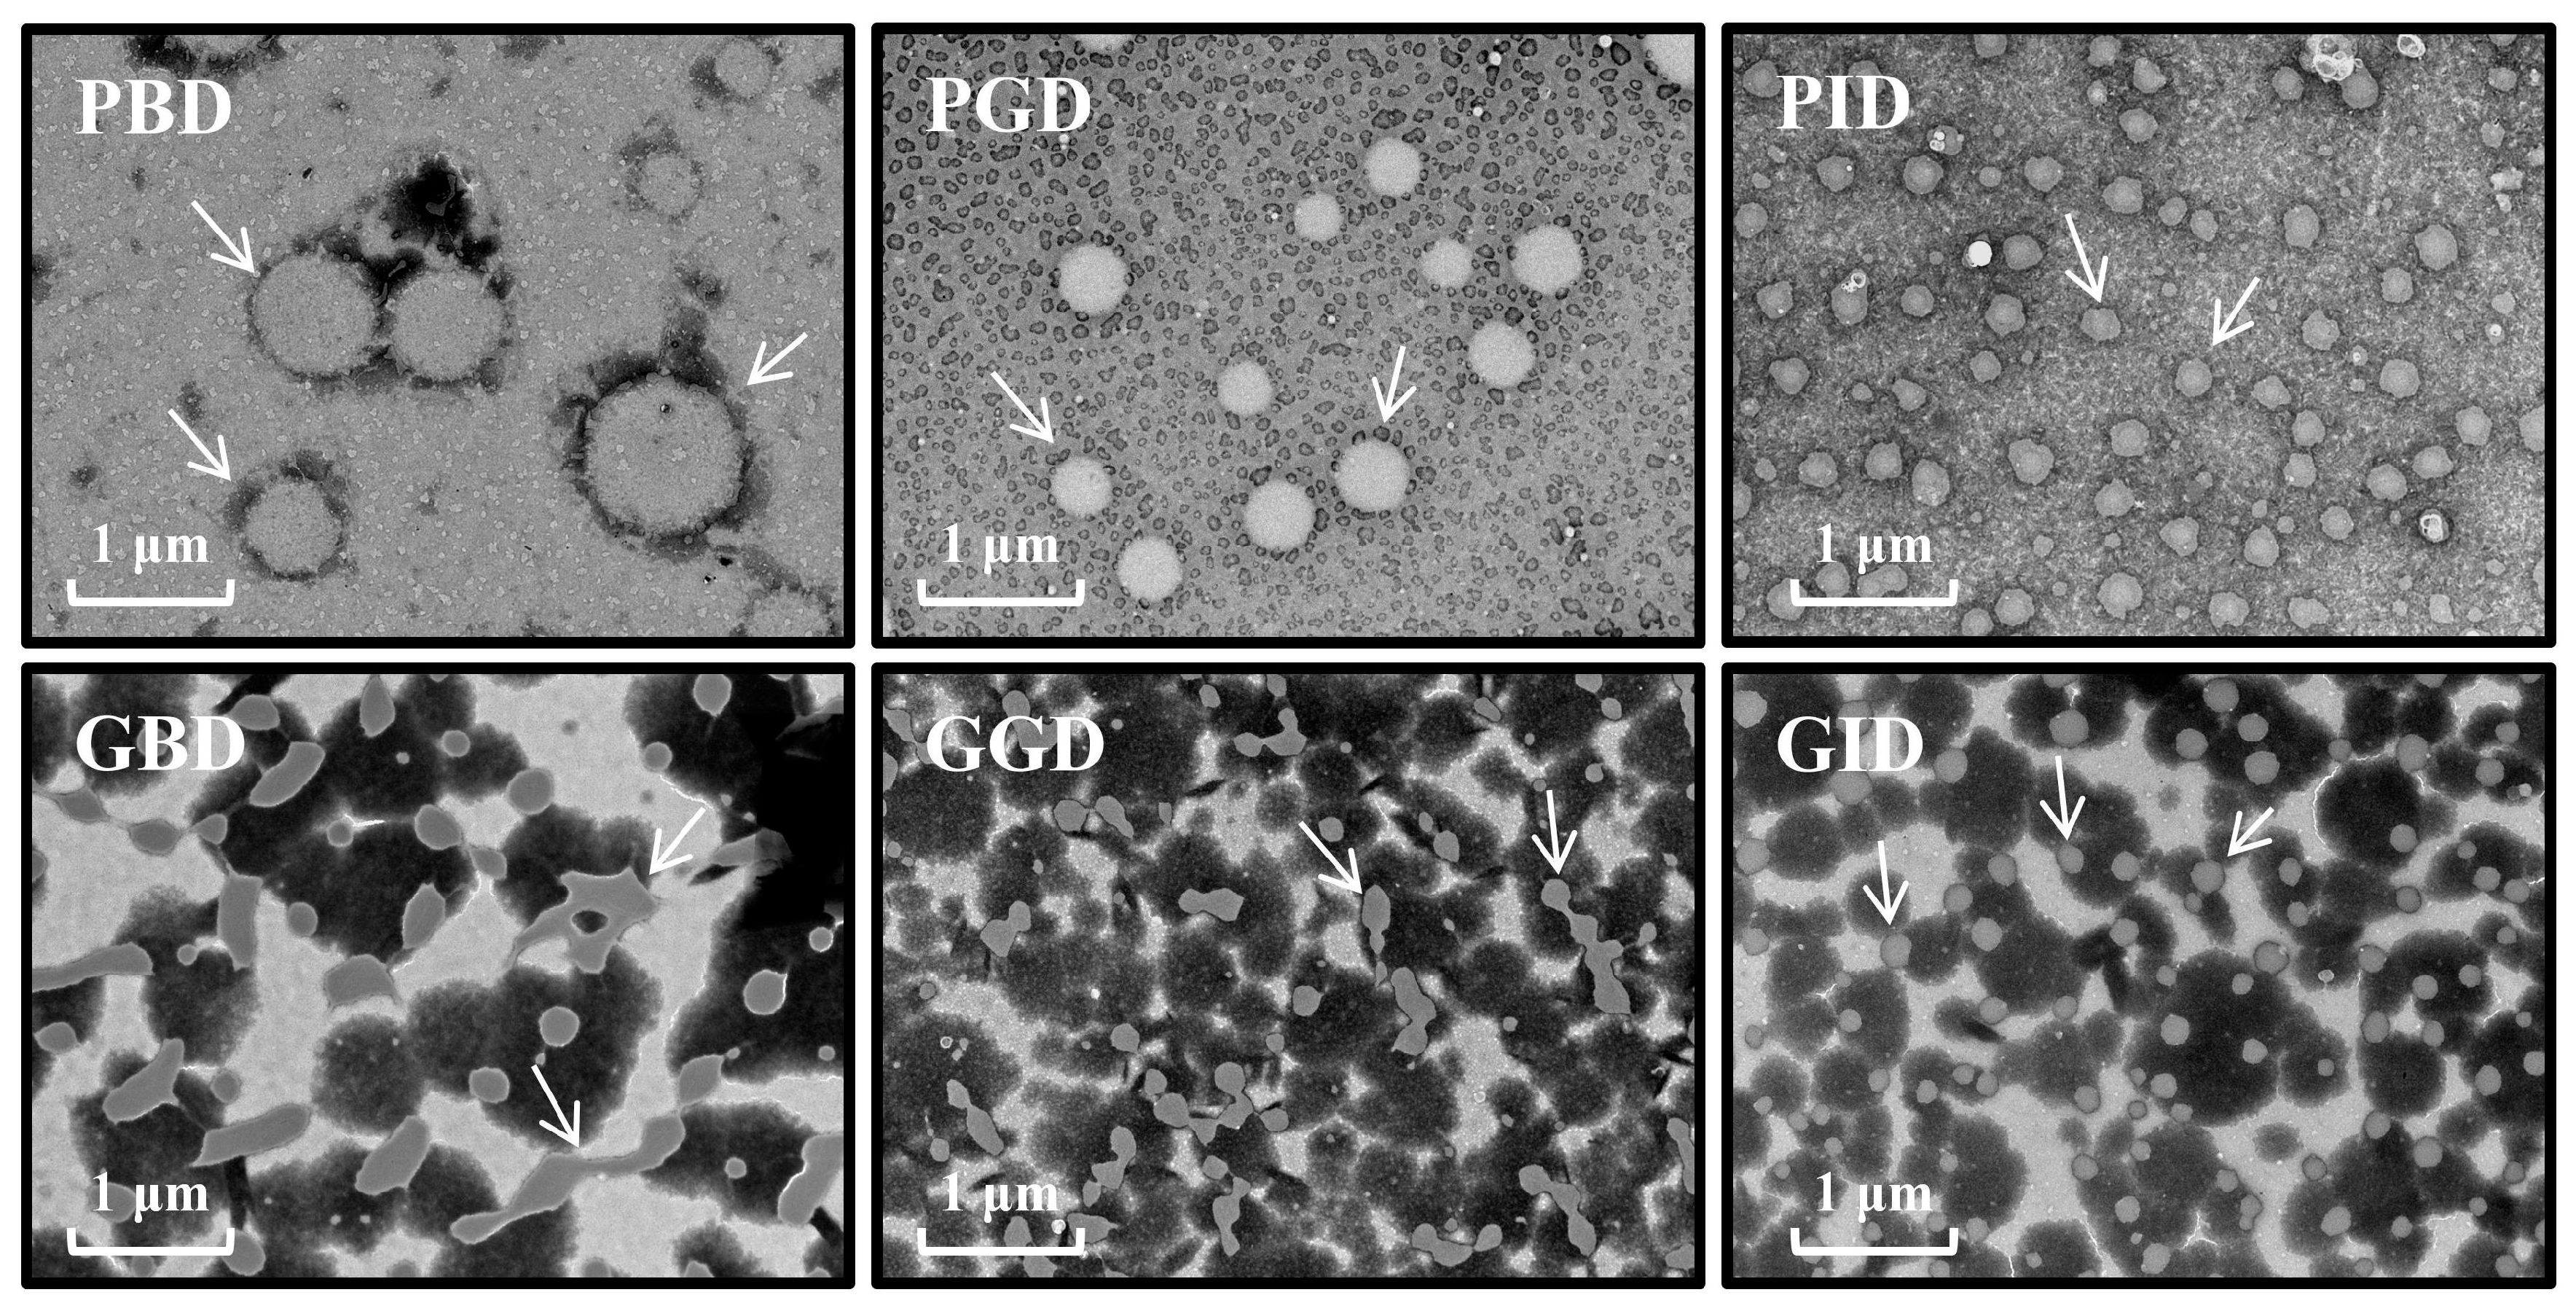
3.3. Microstructure
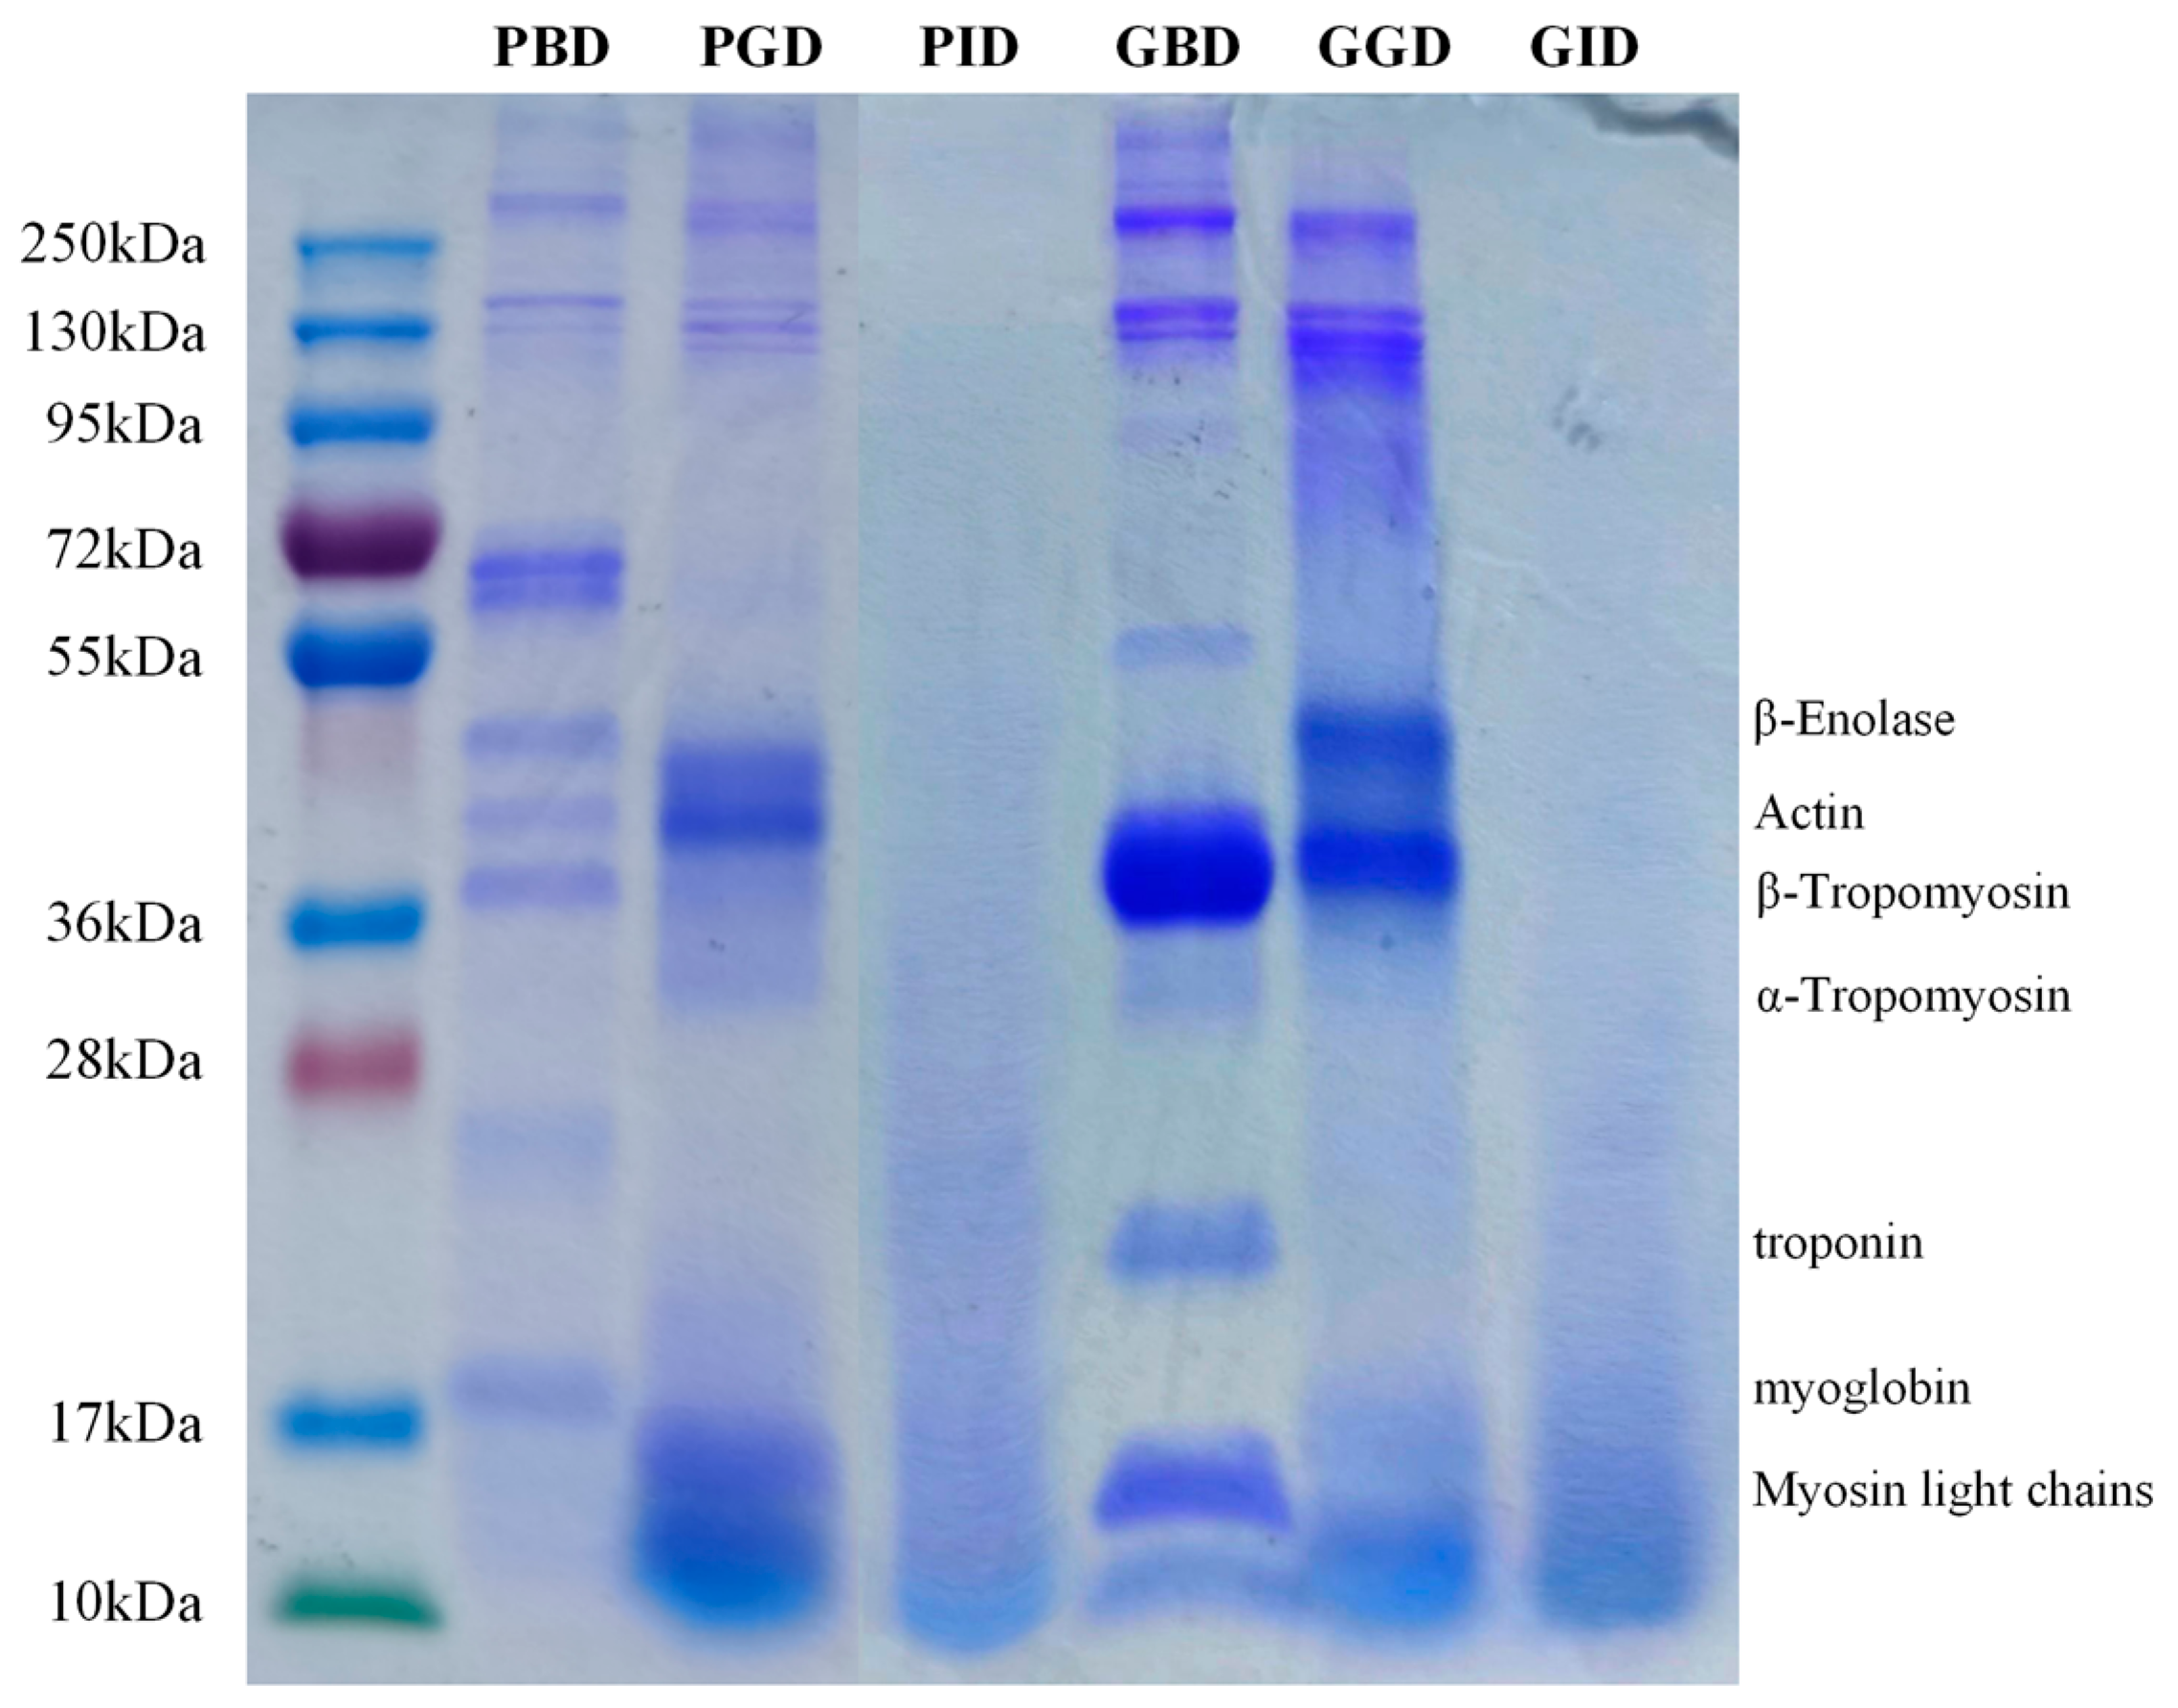
3.4. SDS-PAGE
3.5. TCA-Soluble Peptides
3.6. Molecular Weight Distribution
3.7. Free Amino Acids
3.8. Amino Acid Composition of the Peptides
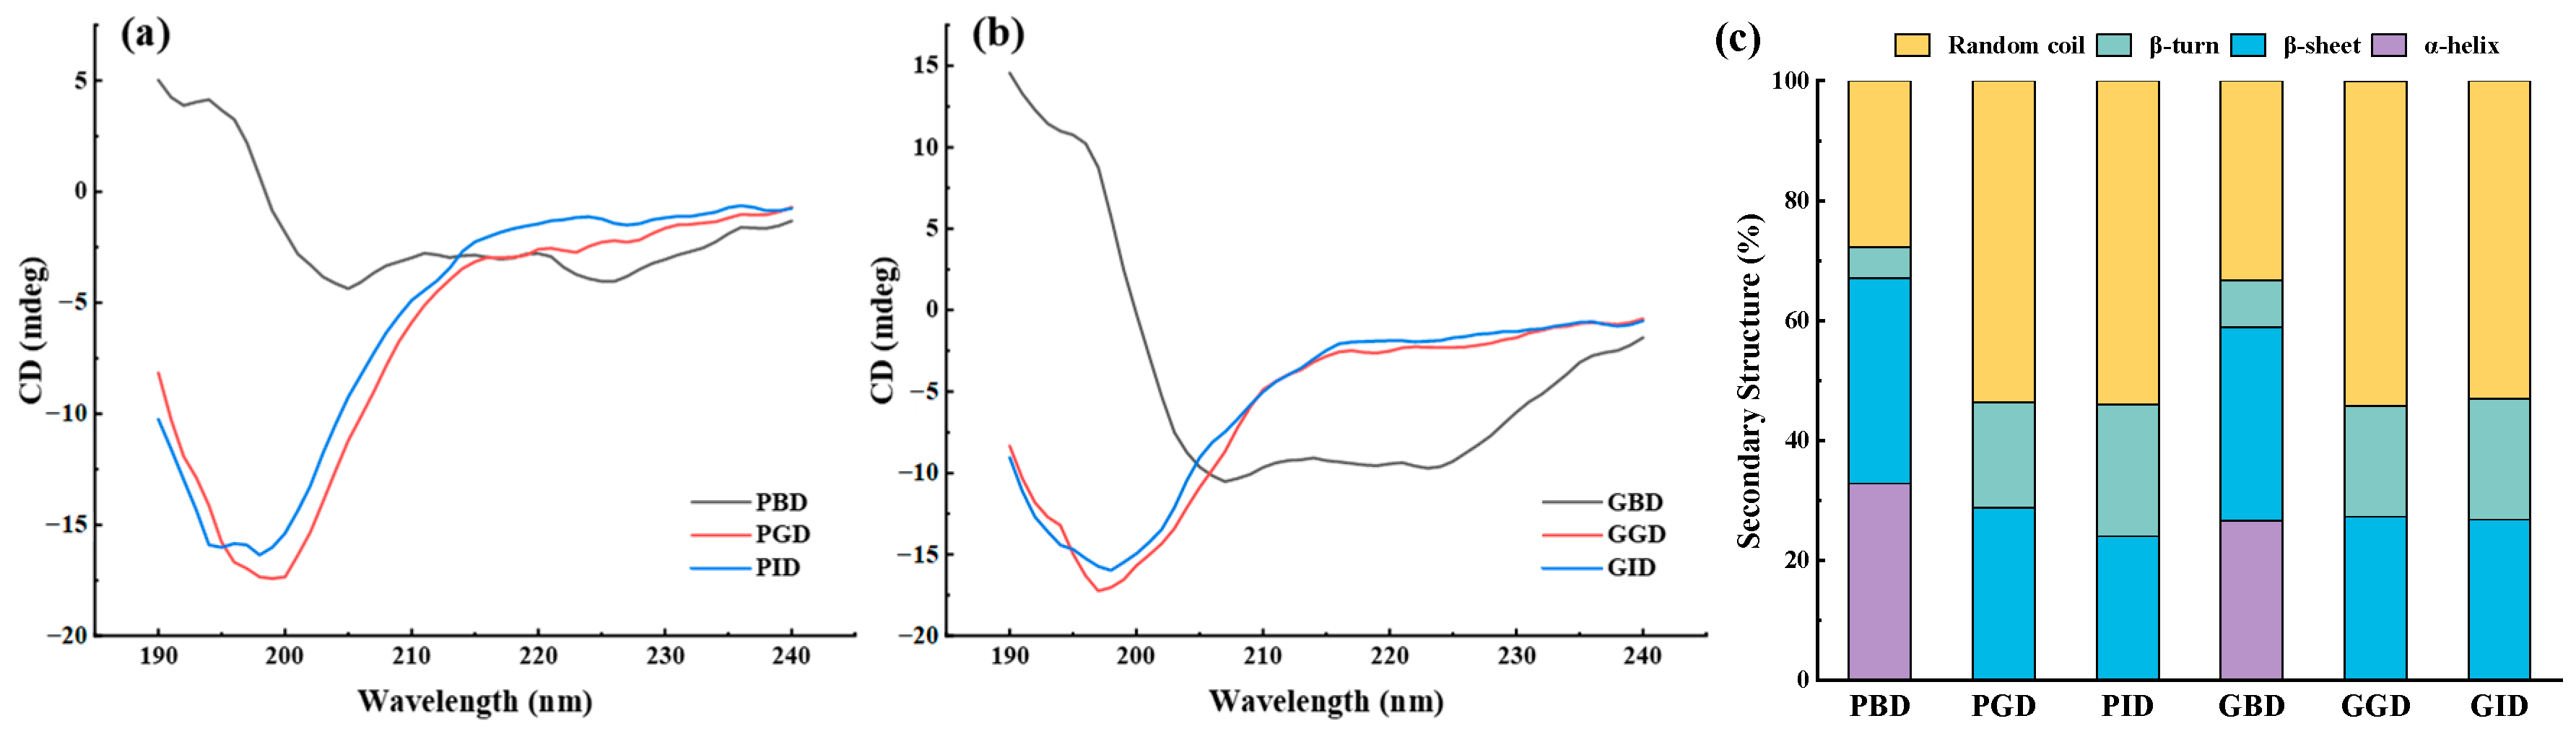
3.9. Circular Dichroism
3.10. Fluorescence Spectroscopy Analysis
3.11. Antioxidation
3.12. Correlation Analysis
3.13. Limitations and Perspective
4. Conclusions
Author Contributions
Funding
Data Availability Statement
Conflicts of Interest
References
- Feskens, E.J.M.; Sluik, D.; van Woudenbergh, G.J. Meat Consumption, Diabetes, and Its Complications. Curr. Diabetes Rep. 2013, 13, 298–306. [Google Scholar] [CrossRef] [PubMed]
- Haring, B.; Wang, W.; Fretts, A.; Shimbo, D.; Lee, E.T.; Howard, B.V.; Roman, M.J.; Devereux, R.B. Red meat consumption and cardiovascular target organ damage (from the Strong Heart Study). J. Hypertens. 2017, 35, 1794–1800. [Google Scholar] [CrossRef] [PubMed]
- Zhang, Y.; Zhang, D.-Z. Red meat, poultry, and egg consumption with the risk of hypertension: A meta-analysis of prospective cohort studies. J. Hum. Hypertens. 2018, 32, 507–517. [Google Scholar] [CrossRef]
- Hodgson, J.M.; Burke, V.; Beilin, L.J.; Puddey, I.B. Partial substitution of carbohydrate intake with protein intake from lean red meat lowers blood pressure in hypertensive persons. Am. J. Clin. Nutr. 2006, 83, 780–787. [Google Scholar] [CrossRef] [PubMed]
- Hur, S.J.; Yoon, Y.; Jo, C.; Jeong, J.Y.; Lee, K.T. Effect of Dietary Red Meat on Colorectal Cancer Risk-A Review. Compr. Rev. Food Sci. Food Saf. 2019, 18, 1812–1824. [Google Scholar] [CrossRef] [PubMed]
- Dong, H.; Hu, W. Demand for Pork and Meat in China. Master’ Dissertation, University of Kentucky Libraries, Lexington, KY, USA, 2016. [Google Scholar]
- Akpan, S.J. The Influence of Cultural Factors on Consumer Buying Behaviour (A Case Study of Pork). Br. J. Mark. Stud. 2016, 4, 44–57. [Google Scholar]
- FAO. The State of World Fisheries and Aquaculture (SOFIA) 2022; FAO: Rome, Italy, 2022. [Google Scholar]
- Lin, S.; Milardi, M.; Gao, Y.; Wong, M.H. Sustainable management of non-native grass carp as a protein source, weed-control agent and sport fish. Aquac. Res. 2022, 53, 5809–5824. [Google Scholar] [CrossRef]
- Yang, W.; Shi, W.; Zhou, S.; Qu, Y.; Wang, Z. Research on the changes of water-soluble flavor substances in grass carp during steaming. J. Food Biochem. 2019, 43, e12993. [Google Scholar] [CrossRef]
- Li, X.; Luo, Y.; Shen, H.; You, J. Antioxidant activities and functional properties of grass carp (Ctenopharyngodon idellus) protein hydrolysates. J. Sci. Food Agric. 2012, 92, 292–298. [Google Scholar] [CrossRef]
- Chen, J.; Wang, Y.; Zhong, Q.; Wu, Y.; Xia, W. Purification and characterization of a novel angiotensin-I converting enzyme (ACE) inhibitory peptide derived from enzymatic hydrolysate of grass carp protein. Peptides 2012, 33, 52–58. [Google Scholar] [CrossRef]
- Tang, L.; Chen, S.; Su, W.; Weng, W.; Osako, K.; Tanaka, M. Physicochemical properties and film-forming ability of fish skin collagen extracted from different freshwater species. Process Biochem. 2015, 50, 148–155. [Google Scholar] [CrossRef]
- Mitra, B.; Kristensen, L.; Lametsch, R.; Ruiz-Carrascal, J. Cooking affects pork proteins in vitro rate of digestion due to different structural and chemical modifications. Meat Sci. 2022, 192, 108924. [Google Scholar] [CrossRef] [PubMed]
- Brodkorb, A.; Egger, L.; Alminger, M.; Alvito, P.; Assunção, R.; Ballance, S.; Bohn, T.; Bourlieu-Lacanal, C.; Boutrou, R.; Carrière, F.; et al. INFOGEST static in vitro simulation of gastrointestinal food digestion. Nat. Protoc. 2019, 14, 991–1014. [Google Scholar] [CrossRef] [PubMed]
- Minekus, M.; Alminger, M.; Alvito, P.; Ballance, S.; Bohn, T.; Bourlieu, C.; Carrière, F.; Boutrou, R.; Corredig, M.; Dupont, D. A standardised static in vitro digestion method suitable for food–an international consensus. Food Funct. 2014, 5, 1113–1124. [Google Scholar] [CrossRef] [PubMed]
- Zaky, A.A.; Simal-Gandara, J.; Eun, J.-B.; Shim, J.-H.; Abd El-Aty, A. Bioactivities, applications, safety, and health benefits of bioactive peptides from food and by-products: A review. Front. Nutr. 2022, 8, 815640. [Google Scholar] [CrossRef] [PubMed]
- Borrajo, P.; Pateiro, M.; Barba, F.J.; Mora, L.; Franco, D.; Toldrá, F.; Lorenzo, J.M. Antioxidant and antimicrobial activity of peptides extracted from meat by-products: A review. Food Anal. Methods 2019, 12, 2401–2415. [Google Scholar] [CrossRef]
- Wang, K.; Han, L.; Hong, H.; Pan, J.; Liu, H.; Luo, Y. Purification and identification of novel antioxidant peptides from silver carp muscle hydrolysate after simulated gastrointestinal digestion and transepithelial transport. Food Chem. 2021, 342, 128275. [Google Scholar] [CrossRef]
- Xie, Y.; Cai, L.; Zhao, D.; Liu, H.; Xu, X.; Zhou, G.; Li, C. Real meat and plant-based meat analogues have different in vitro protein digestibility properties. Food Chem. 2022, 387, 132917. [Google Scholar] [CrossRef]
- Zenker, H.E.; van Lieshout, G.A.; van Gool, M.P.; Bragt, M.C.; Hettinga, K.A. Lysine blockage of milk proteins in infant formula impairs overall protein digestibility and peptide release. Food Funct. 2020, 11, 358–369. [Google Scholar] [CrossRef]
- Leng, D.; Chen, H.; Li, G.; Guo, M.; Zhu, Z.; Xu, L.; Wang, Y. Development and comparison of intramuscularly long-acting paliperidone palmitate nanosuspensions with different particle size. Int. J. Pharm. 2014, 472, 380–385. [Google Scholar] [CrossRef]
- Buamard, N.; Benjakul, S. Improvement of gel properties of sardine (Sardinella albella) surimi using coconut husk extracts. Food Hydrocoll. 2015, 51, 146–155. [Google Scholar] [CrossRef]
- Lorieau, L.; Halabi, A.; Ligneul, A.; Hazart, E.; Dupont, D.; Floury, J. Impact of the dairy product structure and protein nature on the proteolysis and amino acid bioaccessiblity during in vitro digestion. Food Hydrocoll. 2018, 82, 399–411. [Google Scholar] [CrossRef]
- Yang, J.; Huang, J.; Dong, X.; Zhang, Y.; Zhou, X.; Huang, M.; Zhou, G. Purification and identification of antioxidant peptides from duck plasma proteins. Food Chem. 2020, 319, 126534. [Google Scholar] [CrossRef] [PubMed]
- Liu, D.; Chen, X.; Huang, J.; Huang, M.; Zhou, G. Generation of bioactive peptides from duck meat during post-mortem aging. Food Chem. 2017, 237, 408–415. [Google Scholar] [CrossRef] [PubMed]
- Escudero, E.; Sentandreu, M.Á.; Toldrá, F. Characterization of Peptides Released by in Vitro Digestion of Pork Meat. J. Agric. Food Chem. 2010, 58, 5160–5165. [Google Scholar] [CrossRef]
- Wang, C.; Zhao, F.; Bai, Y.; Li, C.; Xu, X.; Kristiansen, K.; Zhou, G. Effect of gastrointestinal alterations mimicking elderly conditions on in vitro digestion of meat and soy proteins. Food Chem. 2022, 383, 132465. [Google Scholar] [CrossRef]
- Martini, S.; Conte, A.; Tagliazucchi, D. Comparative peptidomic profile and bioactivities of cooked beef, pork, chicken and turkey meat after in vitro gastro-intestinal digestion. J. Proteom. 2019, 208, 103500. [Google Scholar] [CrossRef]
- Guillon, F.; Champ, M. Structural and physical properties of dietary fibres, and consequences of processing on human physiology. Food Res. Int. 2000, 33, 233–245. [Google Scholar] [CrossRef]
- Khalifa, I.; Zhu, W.; Nawaz, A.; Li, K.; Li, C. Microencapsulated mulberry anthocyanins promote the in vitro-digestibility of whey proteins in glycated energy-ball models. Food Chem. 2021, 345, 128805. [Google Scholar] [CrossRef]
- Ahmad, M.; Gani, A. Ultrasonicated resveratrol loaded starch nanocapsules: Characterization, bioactivity and release behaviour under in-vitro digestion. Carbohydr. Polym. 2021, 251, 117111. [Google Scholar] [CrossRef]
- Hasanvand, E.; Fathi, M.; Bassiri, A.; Javanmard, M.; Abbaszadeh, R. Novel starch based nanocarrier for vitamin D fortification of milk: Production and characterization. Food Bioprod. Process. 2015, 96, 264–277. [Google Scholar] [CrossRef]
- Vigneshkumar, P.N.; George, E.; Joseph, J.; John, F.; George, J. Chapter 12—Liposomal bionanomaterials for nucleic acid delivery. In Fundamentals of Bionanomaterials; Barhoum, A., Jeevanandam, J., Danquah, M.K., Eds.; Elsevier: Amsterdam, The Netherlands, 2022; pp. 327–362. [Google Scholar]
- Demetriades, K.; Coupland, J.N.; McClements, D.J. Physical Properties of Whey Protein Stabilized Emulsions as Related to pH and NaCl. J. Food Sci. 1997, 62, 342–347. [Google Scholar] [CrossRef]
- Zhou, S.-D.; Lin, Y.-F.; Xu, X.; Meng, L.; Dong, M.-S. Effect of non-covalent and covalent complexation of (−)-epigallocatechin gallate with soybean protein isolate on protein structure and in vitro digestion characteristics. Food Chem. 2020, 309, 125718. [Google Scholar] [CrossRef]
- Chen, W.; Liao, A.; Hou, Y.; Pan, L.; Yu, G.; Du, J.; Yang, C.; Li, X.; Huang, J. Digestive characteristics and peptide release from wheat embryo proteins in vitro. Food Funct. 2021, 12, 2257–2269. [Google Scholar] [CrossRef] [PubMed]
- Wen, S.; Zhou, G.; Li, L.; Xu, X.; Yu, X.; Bai, Y.; Li, C. Effect of cooking on in vitro digestion of pork proteins: A peptidomic perspective. J. Agric. Food Chem. 2015, 63, 250–261. [Google Scholar] [CrossRef]
- Azadian, M.; Moosavi-Nasab, M.; Abedi, E. Comparison of functional properties and SDS-PAGE patterns between fish protein isolate and surimi produced from silver carp. Eur. Food Res. Technol. 2012, 235, 83–90. [Google Scholar] [CrossRef]
- Bhat, Z.F.; Morton, J.D.; Mason, S.L.; Bekhit, A.E.-D.A. Pulsed electric field improved protein digestion of beef during in-vitro gastrointestinal simulation. LWT 2019, 102, 45–51. [Google Scholar] [CrossRef]
- Choi, J.S.; Chin, K.B. Structural changes of meat protein of chicken sausages with various levels of salt and phosphate and their effects on in vitro digestion. Int. J. Food Sci. Technol. 2021, 56, 5250–5258. [Google Scholar] [CrossRef]
- Zou, X.; He, J.; Zhao, D.; Zhang, M.; Xie, Y.; Dai, C.; Wang, C.; Li, C. Structural Changes and Evolution of Peptides during Chill Storage of Pork. Front. Nutr. 2020, 7, 151. [Google Scholar] [CrossRef]
- Ketnawa, S.; Ogawa, Y. Evaluation of protein digestibility of fermented soybeans and changes in biochemical characteristics of digested fractions. J. Funct. Foods 2019, 52, 640–647. [Google Scholar] [CrossRef]
- Diaz, M.; Vattem, D.; Mahoney, R.R. Production of dialysable and reduced iron by in vitro digestion of chicken muscle protein fractions. J. Sci. Food Agric. 2002, 82, 1551–1555. [Google Scholar] [CrossRef]
- Lee, S.; Jo, K.; Jeong, H.G.; Yong, H.I.; Choi, Y.-S.; Kim, D.; Jung, S. Freezing-then-aging treatment improved the protein digestibility of beef in an in vitro infant digestion model. Food Chem. 2021, 350, 129224. [Google Scholar] [CrossRef] [PubMed]
- Ranathunga, S.; Rajapakse, N.; Kim, S.-K. Purification and characterization of antioxidative peptide derived from muscle of conger eel (Conger myriaster). Eur. Food Res. Technol. 2006, 222, 310–315. [Google Scholar] [CrossRef]
- Rezvankhah, A.; Yarmand, M.S.; Ghanbarzadeh, B.; Mirzaee, H. Generation of bioactive peptides from lentil protein: Degree of hydrolysis, antioxidant activity, phenol content, ACE-inhibitory activity, molecular weight, sensory, and functional properties. J. Food Meas. Charact. 2021, 15, 5021–5035. [Google Scholar] [CrossRef]
- Prandi, B.; Zurlini, C.; Maria, C.I.; Cutroneo, S.; Di Massimo, M.; Bondi, M.; Brutti, A.; Sforza, S.; Tedeschi, T. Targeting the nutritional value of proteins from legumes by-products through mild extraction technologies. Front. Nutr. 2021, 8, 695793. [Google Scholar] [CrossRef]
- Park, C.S.; Adeola, O. Digestibility of amino acids in fish meal and blood-derived protein sources fed to pigs. Anim. Biosci. 2022, 35, 1418–1425. [Google Scholar] [CrossRef]
- Ao, J.; Li, B. Stability and antioxidative activities of casein peptide fractions during simulated gastrointestinal digestion in vitro: Charge properties of peptides affect digestive stability. Food Res. Int. 2013, 52, 334–341. [Google Scholar] [CrossRef]
- Santos-Hernández, M.; Alfieri, F.; Gallo, V.; Miralles, B.; Masi, P.; Romano, A.; Ferranti, P.; Recio, I. Compared digestibility of plant protein isolates by using the INFOGEST digestion protocol. Food Res. Int. 2020, 137, 109708. [Google Scholar] [CrossRef]
- Nwachukwu, I.D.; Aluko, R.E. Structural and functional properties of food protein-derived antioxidant peptides. J. Food Biochem. 2019, 43, e12761. [Google Scholar] [CrossRef]
- Zou, T.-B.; He, T.-P.; Li, H.-B.; Tang, H.-W.; Xia, E.-Q. The structure-activity relationship of the antioxidant peptides from natural proteins. Molecules 2016, 21, 72. [Google Scholar] [CrossRef]
- Sun, C.; Tang, X.; Ren, Y.; Wang, E.; Shi, L.; Wu, X.; Wu, H. Novel antioxidant peptides purified from mulberry (Morus atropurpurea Roxb.) leaf protein hydrolysates with hemolysis inhibition ability and cellular antioxidant activity. J. Agric. Food Chem. 2019, 67, 7650–7659. [Google Scholar] [CrossRef] [PubMed]
- Saiga, A.; Tanabe, S.; Nishimura, T. Antioxidant activity of peptides obtained from porcine myofibrillar proteins by protease treatment. J. Agric. Food Chem. 2003, 51, 3661–3667. [Google Scholar] [CrossRef] [PubMed]
- Woodward, R.B.; Schramm, C.H. Synthesis of Protein Analogs. J. Am. Chem. Soc. 1947, 69, 1551–1552. [Google Scholar] [CrossRef] [PubMed]
- Jiang, S.; Zhang, M.; Liu, H.; Li, Q.; Xue, D.; Nian, Y.; Zhao, D.; Shan, K.; Dai, C.; Li, C. Ultrasound treatment can increase digestibility of myofibrillar protein of pork with modified atmosphere packaging. Food Chem. 2022, 377, 131811. [Google Scholar] [CrossRef] [PubMed]
- Khalifa, I.; Lorenzo, J.M.; Bangar, S.P.; Morsy, O.M.; Nawaz, A.; Walayat, N.; Sobhy, R. Effect of the non-covalent and covalent interactions between proteins and mono- or di-glucoside anthocyanins on β-lactoglobulin-digestibility. Food Hydrocoll. 2022, 133, 107952. [Google Scholar] [CrossRef]
- Yuan, H.; Lv, J.; Gong, J.; Xiao, G.; Zhu, R.; Li, L.; Qiu, J. Secondary structures and their effects on antioxidant capacity of antioxidant peptides in yogurt. Int. J. Food Prop. 2018, 21, 2167–2180. [Google Scholar] [CrossRef]
- Tang, C.-H.; Sun, X. Structure–physicochemical function relationships of 7S globulins (vicilins) from red bean (Phaseolus angularis) with different polypeptide constituents. Food Hydrocoll. 2011, 25, 536–544. [Google Scholar] [CrossRef]
- Wang, C.; Xu, F.; Li, D.; Zhang, M. Physico-chemical and structural properties of four rice bran protein fractions based on the multiple solvent extraction method. Czech J. Food Sci. 2015, 33, 283–291. [Google Scholar] [CrossRef]
- Li, Q.; Zhao, D.; Liu, H.; Zhang, M.; Jiang, S.; Xu, X.; Zhou, G.; Li, C. “Rigid” structure is a key determinant for the low digestibility of myoglobin. Food Chem. X 2020, 7, 100094. [Google Scholar] [CrossRef]
- Chao, D.; He, R.; Jung, S.; Aluko, R.E. Effect of pressure or temperature pretreatment of isolated pea protein on properties of the enzymatic hydrolysates. Food Res. Int. 2013, 54, 1528–1534. [Google Scholar] [CrossRef]
- Jiang, H.; Zhang, Z.; Wang, Y.; Gao, J.; Yuan, Q.; Mao, X. Effects of high hydrostatic pressure treatment on the antigenicity, structural and digestive properties of whey protein. LWT 2023, 178, 114628. [Google Scholar] [CrossRef]
- Wang, J.; Chi, Y.; Cheng, Y.; Zhao, Y. Physicochemical properties, in vitro digestibility and antioxidant activity of dry-heated egg white protein. Food Chem. 2018, 246, 18–25. [Google Scholar] [CrossRef] [PubMed]
- Zhang, Y.; Niu, F.; Zhang, X.; Lu, Z.; Guo, Y.; Wang, H. Controlled enzymatic hydrolysis on characteristic and antioxidant properties of soybean protein isolate-maltodextrin conjugates. Int. J. Food Prop. 2018, 21, 2239–2249. [Google Scholar] [CrossRef]
- Jia, J.; Ma, H.; Zhao, W.; Wang, Z.; Tian, W.; Luo, L.; He, R. The use of ultrasound for enzymatic preparation of ACE-inhibitory peptides from wheat germ protein. Food Chem. 2010, 119, 336–342. [Google Scholar] [CrossRef]
- Ling, B.; Ouyang, S.; Wang, S. Effect of radio frequency treatment on functional, structural and thermal behaviors of protein isolates in rice bran. Food Chem. 2019, 289, 537–544. [Google Scholar] [CrossRef] [PubMed]
- Ryan, J.T.; Ross, R.P.; Bolton, D.; Fitzgerald, G.F.; Stanton, C. Bioactive Peptides from Muscle Sources: Meat and Fish. Nutrients 2011, 3, 765–791. [Google Scholar] [CrossRef] [PubMed]
- Carrillo, C.; Barrio, Á.; del Mar Cavia, M.; Alonso-Torre, S. Global antioxidant response of meat. J. Sci. Food Agric. 2017, 97, 2358–2365. [Google Scholar] [CrossRef]
- Wu, G. Important roles of dietary taurine, creatine, carnosine, anserine and 4-hydroxyproline in human nutrition and health. Amino. Acids. 2020, 52, 329–360. [Google Scholar] [CrossRef]
- Liu, Q.; Kong, B.; Xiong, Y.L.; Xia, X. Antioxidant activity and functional properties of porcine plasma protein hydrolysate as influenced by the degree of hydrolysis. Food Chem. 2010, 118, 403–410. [Google Scholar] [CrossRef]
- Min, B.; Cordray, J.C.; Ahn, D.U. Antioxidant effect of fractions from chicken breast and beef loin homogenates in phospholipid liposome systems. Food Chem. 2011, 128, 299–307. [Google Scholar] [CrossRef]
- Zheng, L.; Lin, L.; Su, G.; Zhao, Q.; Zhao, M. Pitfalls of using 1, 1-diphenyl-2-picrylhydrazyl (DPPH) assay to assess the radical scavenging activity of peptides: Its susceptibility to interference and low reactivity towards peptides. Food Res. Int. 2015, 76, 359–365. [Google Scholar] [CrossRef] [PubMed]
- Zhu, L.; Chen, J.; Tang, X.; Xiong, Y.L. Reducing, radical scavenging, and chelation properties of in vitro digests of alcalase-treated zein hydrolysate. J. Agric. Food Chem. 2008, 56, 2714–2721. [Google Scholar] [CrossRef] [PubMed]


| Samples | Mean Particle Size (nm) | PDI | Zeta Potential (mV) |
|---|---|---|---|
| PBD | 2448 ± 141.45 Aa | 0.17 ± 0.06 Bc | 0.55 ± 0.01 Bc |
| PGD | 1197 ± 65.5 Ab | 0.27 ± 0.02 Bb | −1.77 ± 0.03 Bb |
| PID | 459.5 ± 13.23 Ac | 0.55 ± 0.06 Aa | −30.53 ± 0.12 Aa |
| GBD | 2074.7 ± 89.5 Ba | 0.20 ± 0.02 Ac | −0.65 ± 0.03 Ac |
| GGD | 395.1 ± 60.42 Bb | 0.53 ± 0.05 Aa | −2.73 ± 0.13 Ab |
| GID | 105 ± 0.87 Bc | 0.40 ± 0.01 Bb | −30.33 ± 0.67 Aa |
| Amino Acid Content (mg/g Protein) | PBD | PGD | PID | GBD | GGD | GID |
|---|---|---|---|---|---|---|
| Asp | 0.07 ± 0 Ab | 0.15 ± 0 Ab | 2.59 ± 0.06 Aa | 0.05 ± 0.01 Bb | 0.11 ± 0.02 Ab | 3.56 ± 1.88 Aa |
| Glu | 0.61 ± 0.02 Ac | 0.92 ± 0.06 Ab | 8.82 ± 0.26 Aa | 0.2 ± 0.03 Bb | 1.43 ± 0.26 Ab | 11.73 ± 1.9 Aa |
| Asn | 0.16 ± 0 Ab | 0.21 ± 0.02 Ab | 8.79 ± 0.39 Aa | 0 ± 0 Bb | 0 ± 0 Bb | 10.1 ± 1.83 Aa |
| Ser | 0.42 ± 0.09 Ab | 0.54 ± 0.02 Ab | 5.96 ± 0.38 Aa | 0.14 ± 0.02 Bb | 0.44 ± 0.04 Bb | 5.07 ± 0.8 Aa |
| Gln | 1.22 ± 0.1 Ab | 1.61 ± 0.12 Ab | 16.44 ± 1.59 Aa | 0.41 ± 0.02 Bb | 1.56 ± 0.07 Bb | 17.73 ± 3.26 Aa |
| His | 0.18 ± 0 Bb | 0.27 ± 0.05 Bb | 6.28 ± 0.26 Ba | 5.71 ± 0.31 Ab | 17.29 ± 1.15 Ab | 17.75 ± 3.49 Aa |
| Gly | 0.48 ± 0.14 Bc | 0.65 ± 0.02 Bb | 3.45 ± 0.03 Ba | 1.41 ± 0.06 Ac | 4.21 ± 0.56 Ab | 5.5 ± 0.93 Aa |
| Thr | 0.38 ± 0.07 Ab | 0.46 ± 0.13 Bb | 7.23 ± 0.14 Aa | 0.24 ± 0.01 Bb | 0.76 ± 0.1 Ab | 7.2 ± 1.4 Aa |
| Arg | 0.3 ± 0.08 Ab | 0.46 ± 0.08 Bb | 48.07 ± 3.43 Aa | 0.32 ± 0.02 Ab | 1.01 ± 0.13 Ab | 59.66 ± 5.95 Aa |
| Ala | 11.96 ± 0.6 Ac | 15.28 ± 1.19 Ab | 21.01 ± 0.77 Aa | 0.5 ± 0.02 Bb | 1.56 ± 0.36 Bb | 10.35 ± 1.73 Ba |
| Tyr | 0.35 ± 0.09 Ab | 0.6 ± 0.03 Bb | 9.72 ± 0.41 Ba | 0.16 ± 0.01 Bb | 0.65 ± 0.1 Ab | 32.19 ± 5.86 Aa |
| Cys | 0.03 ± 0 Bc | 0.25 ± 0.02 Ab | 0.71 ± 0.01 Aa | 0.05 ± 0 Ab | 0.18 ± 0.01 Bb | 1.25 ± 0.23 Aa |
| Val | 0.32 ± 0.05 Ab | 0.46 ± 0.01 Ab | 9.07 ± 0.18 Aa | 0.16 ± 0.04 Bb | 0.48 ± 0.01 Ab | 8.32 ± 1.62 Aa |
| Met | 0.28 ± 0.02 Ac | 0.78 ± 0.03 Ab | 12.27 ± 0.26 Aa | 0.09 ± 0 Bb | 0.45 ± 0.08 Bb | 10.73 ± 2.14 Aa |
| Trp | 0.07 ± 0 Bb | 0.13 ± 0.03 Bb | 10.59 ± 0.22 Aa | 0.19 ± 0 Ab | 0.29 ± 0.01 Ab | 9.07 ± 1.92 Aa |
| Phe | 0.4 ± 0.05 Ac | 1.83 ± 0.04 Bb | 26.94 ± 2.05 Aa | 0.25 ± 0.01 Bb | 2 ± 0.14 Ab | 35.86 ± 8.42 Aa |
| Ile | 0.31 ± 0.02 Ab | 0.55 ± 0.01 Bb | 12.22 ± 0.28 Aa | 0.22 ± 0.03 Bb | 1.16 ± 0.06 Ab | 11.23 ± 2.42 Aa |
| Leu | 0.52 ± 0.07 Ab | 1.31 ± 0.06 Bb | 45.14 ± 1.6 Aa | 0.33 ± 0.02 Bb | 1.65 ± 0.21 Ab | 46.8 ± 4.84 Aa |
| Lys | 0.36 ± 0.1 Bc | 0.51 ± 0.04 Bb | 0.98 ± 0.04 Ba | 0.78 ± 0.07 Ab | 2.35 ± 0.12 Ab | 60.57 ± 8.26 Aa |
| Pro | 0.24 ± 0.05 Bb | 0.51 ± 0.91 Bb | 1.02 ± 0.06 Ba | 3.15 ± 0.25 Ab | 8.09 ± 0.23 Aa | 8.5 ± 1.87 Aa |
| TAA | 18.66 ± 0.02 Ac | 27.47 ± 0.1 Bb | 257.29 ± 0.78 Ba | 14.37 ± 0.01 Bc | 45.66 ± 0.07 Ab | 373.18 ± 15.67 Aa |
| EAA/TAA | 14.14% | 21.91% | 48.36% | 15.75% | 20.00% | 50.86% |
Disclaimer/Publisher’s Note: The statements, opinions and data contained in all publications are solely those of the individual author(s) and contributor(s) and not of MDPI and/or the editor(s). MDPI and/or the editor(s) disclaim responsibility for any injury to people or property resulting from any ideas, methods, instructions or products referred to in the content. |
© 2023 by the authors. Licensee MDPI, Basel, Switzerland. This article is an open access article distributed under the terms and conditions of the Creative Commons Attribution (CC BY) license (https://creativecommons.org/licenses/by/4.0/).
Share and Cite
Chen, Y.; Jing, H.; Xiong, S.; Manyande, A.; Du, H. Comparative Study on Hydrolysis, Physicochemical and Antioxidant Properties in Simulated Digestion System between Cooked Pork and Fish Meat. Foods 2023, 12, 1757. https://doi.org/10.3390/foods12091757
Chen Y, Jing H, Xiong S, Manyande A, Du H. Comparative Study on Hydrolysis, Physicochemical and Antioxidant Properties in Simulated Digestion System between Cooked Pork and Fish Meat. Foods. 2023; 12(9):1757. https://doi.org/10.3390/foods12091757
Chicago/Turabian StyleChen, Yuhan, Hanzhi Jing, Shanbai Xiong, Anne Manyande, and Hongying Du. 2023. "Comparative Study on Hydrolysis, Physicochemical and Antioxidant Properties in Simulated Digestion System between Cooked Pork and Fish Meat" Foods 12, no. 9: 1757. https://doi.org/10.3390/foods12091757