
Neglected Theories of Business Cycle—Alternative Ways of Explaining Economic Fluctuations

1
Department of Economics, Prague University of Economics and Business, 130 67 Prague, Czech Republic
2
Faculty of Mathematics and Physics, Charles University, 110 00 Prague, Czech Republic
*
Author to whom correspondence should be addressed.
Data 2021, 6(11), 109; https://doi.org/10.3390/data6110109
Submission received: 30 August 2021
/
Revised: 11 October 2021
/
Accepted: 18 October 2021
/
Published: 20 October 2021
(This article belongs to the Special Issue Big Data Analytics in Bankruptcy Prediction)
Abstract
:The business cycle is a frequent topic in economic research; however, the approach based on individual strategies often remains neglected. The aspiration of this study is to prove that the behavior of individuals can originate and fuel an economic cycle. For this purpose, we are using an algorithm based on a repeated dove–hawk game. The results reveal that the sum of output in a society is affected by the ratio of individual strategies. Cyclical changes in this ratio will be translated into fluctuations of the total product of society. We present game theory modelling of a strategic behavioral approach as a valid theoretical foundation for explaining economic fluctuations. This article offers an unusual insight into the business cycle’s causes and growth theories.
1. Introduction
The business/economic cycle consists of more or less periodical alternation of booms and recessions. The periods, however, do not necessarily alternate regularly. Quite often, it is the reverse. Recently, the world economy has experienced a double bottom recession (W); sometimes, on the other hand, the upswing period lasts for many years. Economic literature identifies a wide range of impulses for the origin of cycle alternation. Rios [1] provides an overview of possible generators of changes in dynamism of the economy. He finds that among the most pronounced factors throughout history that initiates a change in dynamism in the economy are: concentration of income, changes in technology, and changes in institutional frameworks.
In this article, we want to show that some economic cycles can be initiated by the strategic behavior of individuals and that cycle dynamism is fueled by rational strategy changing over time. First, we will frame basic theoretical approaches to economic cycles. As we want to simulate a cyclical behavior of economic subjects, we will concentrate on endogenous cycle generation and dynamics, and we will propose the strategic cycle concept as a valid theoretical foundation for explaining economic fluctuations. Our aim is to show how the strategic behavior of individuals can initiate and fuel an economic cycle, which is thus far considered a macroeconomic phenomenon.
We hypothesize that individuals behaving rationally will change their strategies in time according to their payoff. Changing the share of the strategies in society will influence the aggregate output of entire society. To prove this, we will simulate strategic behavior through the doves and hawks game.
What we expect is that in periods with a larger share of peaceful strategies, the sum of output/aggregate product will be higher. By simulating strategic behavior in many game rounds, we expect the sum of the society’s output to oscillate in cycles. We argue that it is the strategic behavior of individual economic subjects that influences the procyclical oscillation of aggregate output. Our aim is to prove this via the doves and hawks behavior simulations that will follow.
As previously said, this study is methodologically based on game theory, aiming to find an alternative way of explaining cyclical aggregate output fluctuations. Economic cycles traditionally have been studied as (only) a macroeconomic phenomenon. The usual classification of business cycles in economic literature is based on the length of their period: e.g., Kitchin cycles [2], Juglar cycles [3], Kuznets cycles [4], and Kondratiev cycles [5]. Vorlicek [6] categorizes exogenous and endogenous cycles. Endogenous cycles, whose causes lie within the behavior of economic entities or the parameters of the economic or social system, can be technically further classified as real cycles and strategic cycles.
Real business cycles are initiated by the activity of economic entities but not primarily by the interaction among them. An example of a real cycle is the innovation cycle [7] further developer by Kydland and Prescott [8,9]. The phases of the innovation cycle are irregular both in product fluctuation size and in occurrence in time. Moreover, as innovations are the cause of economic growth, i.e., increase in production capacity, the theory of innovation cycle connects the business cycle with economic growth. In a growing economy, the business cycle will not occur as product fluctuations but only as fluctuations in the growth rate of the product.
Strategic business cycles, on the other hand, are caused by the strategic behavior of various economic entities during their mutual interaction. It is this category of economic cycles where we will test by simulation of the behavior of individuals in a population how changing strategies may initiate a cyclical performance of aggregate product. Strategic cycles include both institutional cycles and natural cycles.
Institutional (or collective) cycles, where the business cycle is caused by specific social institutions. This category includes, for example, monetary and budgetary cycles.
Monetary cycle theory was first presented by Austrians—Hayek [10], Mises [11], and Wicksell [12]. Monetary policy makers usually hope for investment caused by monetary expansion to have the effect of creating capacity. That means there will be an increase in production capacity, which will lead to an increase in the potential economic product. In other words, the recession that will follow will be smaller than the induced boom. However, according to the theory of rational expectations, the monetary cycle will not even take place because economic entities are able to anticipate the behavior of the central banks and they do not react to monetary expansion by increasing investments. The theory of rational expectations will conclude that money has no influence on real values. However, monetary expansion has not only monetary but also structural impacts, which the theory of rational expectations does not take into account. Changes of economic structure will provoke changes in investments initiating an investment cycle. Whether the monetary expansion will lead to increase in production capacity of the economy, which is what the monetary policy makers expect, depends on the fact of whether the newly issued money is obtained by companies that will make sensible investment creating capacity. That means investing in making production more efficient by reducing production inputs and producing goods and services that are needed. If they do not do that, there will only be a shift of sources from one group of entities in the economy to another one.
The budget cycle is often referred to as a political cycle or an electoral cycle. It is based on ideas of the theory of public choices. Nordhaus [13] and Tufte [14] are usually considered pioneers of this field. The economic cycle here copies elections periods. It turned out that both right-wing and left-wing governments tend to buy voters before elections by fiscal expansions. GDP will grow and unemployment will decrease. Governments finance this expansion by loans, which makes the government debt grow and forces private investments to be crowded out. Jobs and products lost in the private sector are not so obviously visible. Fiscal expansion will lead to increased inflation in the post-election period. Therefore, after elections the government creates fiscal restrictions, which make the GDP fall and unemployment rise in a short period of time. The electoral cycle is therefore a result of politicians’ effort to be re-elected by increasing public expenditures before elections, which leads to the necessity of austerity measures—at least shortly after the elections, when citizens, as voters, are the least sensitive to them.
Natural (or individual) cycles are caused by strategic behavior of individuals in the society. Under the theory of natural strategic cycles, we can also list some older theories, which are currently seen as marginal in the context of economic theory. These theories of natural cycles are somewhat marginal to the mainstream in economic research because their formal apparatus does not provide very good opportunities for formulating strategies by means of the game theory, which was not yet developed at the time of their creation. These theories, thus, did not explain cycles primarily as strategic; however, these cycles are strategic by nature and as such can be explained by t game theory. In particular, this concerns the following four theories: the Marxist cycle theory [15], in a modern form represented by the Goodwin model; the speculation cycle theory, introduced by George [16], explaining the business cycle based on land speculation; the theory explaining the business cycle based on the credit cycle, built on Fisher’s [17] hypothesis of debt deflation; and the financial instability of Minsky [18].
Marx’s theory is probably the oldest endogenous theory of the business cycle, even though what Marx talked about were not cycles but crises. According to Marx, capitalism is unstable and prone to periodical crises, which are not primarily caused by external or random reasons but which stem from systemic elements of capitalism as a way of production and social order organization.
Marx’s theory of crisis is based on the law of “falling profit rate” in combination with various countertendencies, which can slow down or change its impact. In short, capitalists invest more and more in new technologies and less and less in work. Considering that the surplus value gained from work is a source of income, the rate of profit will decrease even if the economy is rising. This leads to a decrease in capital accumulation and thus to a recession. The economic crisis is a crisis of overproduction and impoverishment of workers.
The original Marxist model of business cycles was formalized by Goodwin [19]. According to Goodwin’s model, the cycle in the performance of the economy is caused by the division of income between corporate profit and wages of employees. Fluctuations of wages are almost on the same level as fluctuations of the employment rate (the wage cycle lags behind the cycle of employment by one period). If there is a high level of employment in the economy, employees are able to ask for higher wages. On the other hand, in the period of low employment level (or high unemployment) wages tend to fall. The recession is caused by enhanced bargaining power of employees, which increases the share of wages in the national income, suppresses profits, and leads to a reduction of capital accumulation. As a result of a recession, unemployment starts rising, the share of wages then starts to decrease, and the share of profits rises. Accumulation of capital is restored, and performance of the economy starts to increase again. This distributional cycle can have short as well as long periods. The long-term cycle of distribution is caused by periodical changes of the “social structure of capital accumulation”, which is a set of institutions ensuring and stabilizing capital accumulation. A strategic cycle is reflected in the choice of various strategies of individual entities during wage bargaining; the shares of various strategies they choose fluctuate depending on how changes the expected profitability for the entities in question. The long-term cycle is determined by periodical changes of the social structure, e.g., the set of institutions which influence the choice of strategies of individual entities in specific situations.
As an example of a cycle theory working with changes of the social structure, we can name the theory of partisan cycle of the Marxist/post-Keynesian economist Kalecki [20]. This theory relates such changes with changes of political regimes caused by alternation of governments with different ideological orientation. This theory is sometimes considered to be the first theory of what is called political cycle, as compared to modern theories of the political cycle, which are focused on changes of government within the same (democratic) regime.
George’s theory [16] sees land speculations as the primary cause of most business cycles. George observed that the price of land, which is essential for all types of production, has an inherent tendency to rise together with a rising economy. The reason is that the amount of land is fixed. Given that residential and commercial properties provide security for a significant part of credits, prices for properties grow in the rising phase of the business cycle faster than the inflation rate, which is motivation for land speculations. These speculations thus take economic sources away from production, which is carried out on the land. This means that profits are taken from the hands of producers, who invest in production, and are given to hands of landowners who invest in unproductive speculations. Land speculations therefore create an immanent supply shock, because they draw off sources from productive economy in great disproportion to rise of the economic output. This systemic slowdown of the economy is a drag for further economic expansion, and it creates basic tendency toward inflation and recession in the late growth phase of the business cycle. According to George, land speculations are always a cause of economic decline. It is interesting that this theory is generally neglected today, despite the fact that the two biggest economic depressions in last 100 years (1929–1933 and 2008–2013) were accompanied by speculative bubbles on the real estate market.
The essence of the business cycle as described by the Georgists is very similar to the strategic cycle presented in this article. The cycle is reflected in the choice of various strategies of individual subjects when making investments, e.g., when they decide where to allocate their capital—either into production or land speculation. The boom phase is characterized by an increasing share of speculative investment strategies, because investments in land represent, or seem to represent, more advantages than investment in production. However, such an increase in speculations draws off sources from production and at the same time it increases the risk of speculative investments. That leads to recession during which the speculative bubble bursts and speculative investment strategies are no longer more advantageous for investors than production investment strategies. The share of production investment strategies starts to grow, up to the point when the speculative strategy is again so low, that speculative risks are considered to be small, which once more makes speculative strategies more attractive than production strategies.
Additionally, the post-Keynesian theory of the business cycle describes basically a strategic business cycle while it sees finance and banking as the central cause of the business cycle. It says that the cause of business cycles is the credit cycle, during which the pure expansion of credits (increase in private credits and the consequent increase in indebtedness as a percent of the GDP) leads to economic expansion. In contrast, pure concentration of credits causes economic recession and if it lasts it can even develop into depression. Bursting of the speculative bubble is seen as the immediate cause of depressions. During the period of economic expansion interest rates are low and therefore it is easy for companies to borrow money from banks for investment. Banks are willing to lend them money, because thanks to the increase in economic activity many companies’ cash flow grows beyond what is needed for repaying debts. Companies can easily pay their loans back and this gives rise to speculative euphoria. However, over time this leads to excessive indebtedness of companies and that brings about a financial crisis. Banks gradually increase interest rates and reduce the number of credits, companies reduce their investments, and the economy falls into recession. Speculative investment bubbles are therefore a common part of functioning of financial markets.
This theory has been introduced into the modern economy by Minsky as the “hypothesis of financial instability” [18]. This hypothesis is complementary to an older theory known as theory of debt deflation conceived by Fisher [17]. Both these theories are combined in Keen’s model [21]. The essence of the economic cycle is reflected in how individual entities choose the share of various strategies or rather how the share fluctuates when the entity decides how to finance their investments. This theory does not differ much from the aforementioned theory of George. They only differ in what they see as the primary cause of speculative bubbles—whether it is land speculation or speculation in financial assets. Nevertheless, according to the theory of natural strategic cycle presented here, this question is of secondary importance, because both the types of speculation are a consequence of changes in strategies chosen by individual entities. It is also proven by the anatomy of the current crisis that speculation in lands and speculation in financial assets can intertwine with each other, follow one another or determine one another.
We will now focus on our concept of strategic cycle in more details. Within the classification presented above the strategic cycle can be categorized into the natural (individual) cycles group.
As a contribution to the discussion on generation and performance of strategic cycles in the economy we will now present a mathematical simulation of doves and hawks’ behavior and see whether their repeated rational strategic behavior will result in cyclical performance of the total output of the society. The doves and hawks model is a frequently used tool for microeconomic modelling. We will use this tool to derive an explanation of macroeconomic cycles from individual behavior.
2. Methodology
Modelling of cyclical processes has spread from pure macroeconomics to a vast field of economic reality today. Traditionally any cyclical process is measured using nonparametric estimation. Recently this methodology has been refined by time-varying coefficients panel data analysis [22] which gives more accurate results about parameters responsiveness. As a contribution to cyclical process modelling, we offer here an innovative application of evolutionary game theory to aggregate output modelling based on individual strategies. The aspiration of the study is to show that changing strategies of each individual (strategic behavior) will initiate a cycle on aggregate (population) level, thus macroeconomic cycle.
The evolutionary game theory is concerned with populations of agents allowed to act strategically in the interactions among them [23]. This theory provides a theoretical framework to model Darwinian competition that has been widely used to study evolving populations of lifeforms in biology and, particularly, for the study of cooperative behavior in animals [24,25], and more explicitly, among humans [26]. Most of the research in this field has focused on two-person games, where individuals play strategic games and profit from selfishness to the cost of others [27], such as the prisoner’s dilemma [28], the stag hunt [29], and the hawk–dove Game [30].
Here, we propose a model based on the principles of the hawk–dove game. Doves are peaceful and they are willing to share the territory, the hawks are aggressive and prefer conflict over peace, which results in one victor that gets the whole territory for himself, and one loser that has to leave and usually ends up wounded.
The payoff obtained in interactions depends on strategies of the interacting agents—doves and hawks. If there are more hawks than doves in the population the output of each individual strategy is lower leading to the total product being lower than in the equilibrium state. Output of doves is relatively higher than the performance of hawk. On the other hand, if there are more doves than hawks, the output of each individual strategy is higher, and it leads to the total product being higher than in the equilibrium state. However, the output of hawk is now relatively higher than the output of dove (in this situation, hawks will reproduce faster than doves in given population). It is obvious that the economy of this population goes through a cycle, while boom phase is caused by an increase in a portion of cooperative doves on population. Decline in portion of doves (and increase in the portion of hawks) result in the recession (a decline of product) in population. Crisis is a period, where the portion of doves on population is on its minimum and the portion of hawks on population is at its maximum.
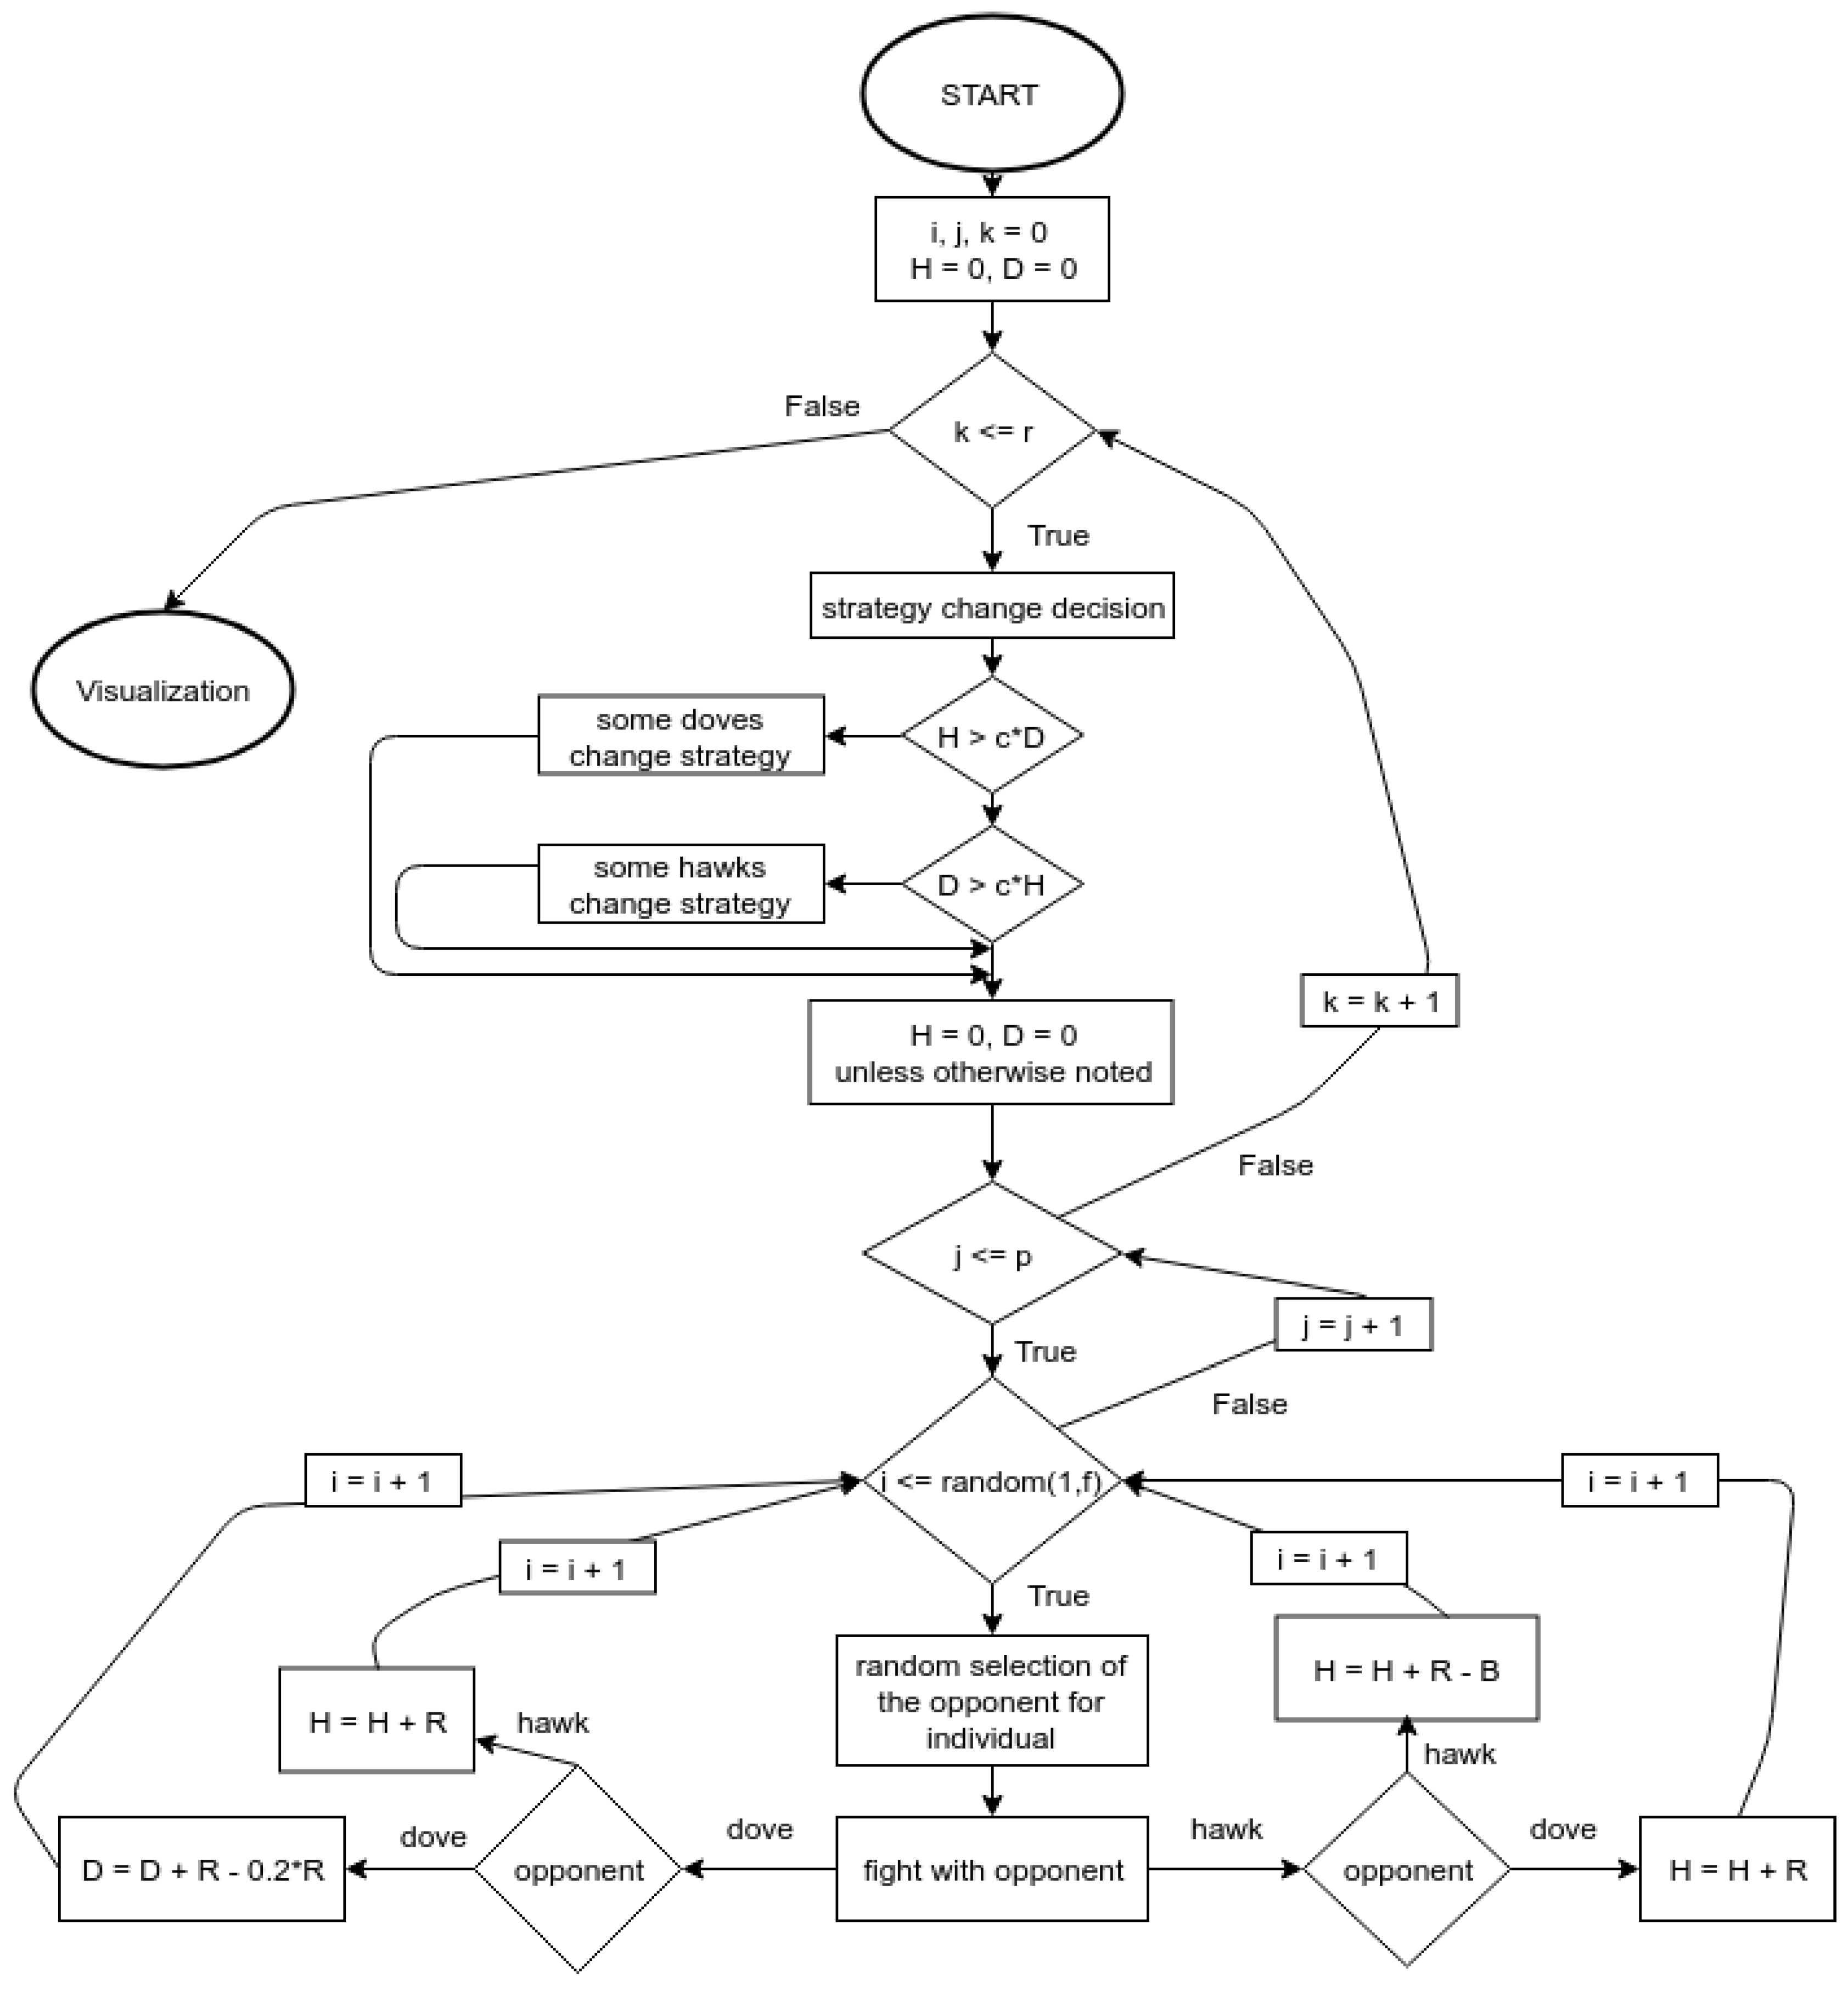
The payoff matrix presented below shows outcomes resulting from a fight between the two opponents. This matrix is slightly different from typical hawk–dove payoff matrix, which usually aims to describe individual outcome of adopting a strategy for each individual (applied for negotiation game, usually, as may be seen, e.g., in Clare [31], Russett [32], or Klugman [33]. We present an aggregate approach, so far not presented in economic literature, which will allow us to draw conclusions about cycle initiation on macroeconomic/aggregate level. We will not concentrate on payoff of a single individual; we will measure hawks or doves entire population result. When a round of fights begins, we set H = 0 (hawks result) and D = 0 (doves result) as seen in algorithm scheme—flow diagram 1. Additionally, during the fights we do mathematical operations written in payment matrix below:
| Opponent | Hawk | Dove |
| Hawk | H = H + R − B | H = H + R |
| Dove | H = H + R | D = D + R − 0.2 * R |
Hawks identify individuals who always fight and doves identify individuals, who never fight. For the simulation presented in the following test, we use the following data and assumptions:
Hawks: aggressive and always fight for resources.
If two hawks meet each other, they always fight for the resource. The winner takes the resource, and the loser is injured. We suppose that individual cannot die and is fully prepared for the next fight. For simplicity, we assume, that all hawks are equal, so every hawk has 50% chance of winning a fight with another hawk. Contests are symmetrical.
Doves: peaceful and never fight.
If two doves meet each other, they share the resource. However, there is a period of displaying, which costs time and energy. The cost of display is the same for every dove meeting. If dove meets hawks, she never fights and withdraws from the fight. Thus, the hawk wins the resource. However, the dove is not injured, and the cost of the display is zero.
The first assumption is that a number of territories (rents) is unlimited. We can ask how we simulate injury. This is very simple. For our simulation, the most important thing is, that we care only about the sum of results of fights for each strategy and round (let us call it aggregate product). Thus, the key thing is what is the price of injury and what is the price of the resource. Thus, two of the parameters used in the simulation are rent and injury value. Let us denote parameter R as rent and parameter B as injury. Both parameters are positive rational numbers. The values R and B influence the simulation and are summarized in Table 1.
As announced above we will concentrate on the sum of fight results for each strategy. Thus, let us denote as H the sum of fight results of hawks in single round.
where Hi is the result for an individual hawk and h is a number of hawks in the population. We ran the same situation for doves. Thus, let us denote as D the sum of fight results of doves in a single round.
where Dj is result for an individual dove and d is number of doves in the population. Thus, we can define P as a product in one round of fights as
In the simulation we will be using the following parameters. Parameter p for population defines a number of individuals in the population as either hawk or dove. The share of hawks in population defines values of h and d. We will denote as f the maximum number of fights in each round for each individual and r as number of rounds. In every round every individual in population compete in random number of fights (between 1 and f) with random (based on number of hawks and doves in population) opponents. Now we can define as I product of each individual with formula
where Ik is a result of one fight. The last parameter is a coefficient for strategy change, we denote it c1.01 ≤ c ≤ 1.15 and depending on other parameters. After one round of fights, a small percentage of individuals decide to change the strategy. It means, that some hawks can change to doves, or some doves can change to hawks. The decision is based on the following rules and made after every single round. If then random a percentage (1–3) of doves change their strategy and change to hawks. If then a random percentage (1–3) of hawks change their strategy and change to doves. If neither of the two mentioned conditions is met, every individual reuses their strategy in the next round. After each round we reset to zero values H and D, but we do not have to, because in both cases simulation gives predicted results. Scheme 1 shows a simplified flow diagram of the algorithm used in the simulation.
It will be interesting to see whether the behavior of doves and hawks that follow strategies set in the payoff matrix will result in cycles in their aggregate product. Let us now simulate a population of doves and hawks behaving strategically under the above-described algorithm.
3. Results and Discussion
The simulation of aggregate output is performed using php programming language. The figures below show how aggregate output responses on the change in parameters. With a population size of 1000, the simulation showed a cyclical trend in aggregate output. Increasing the size of the population had no significant effect on trends in aggregate output. In the simulation we used data mined from the abovementioned algorithm (Scheme 1). The algorithm was implemented in the php programming language and visualization was performed through the php chart library.
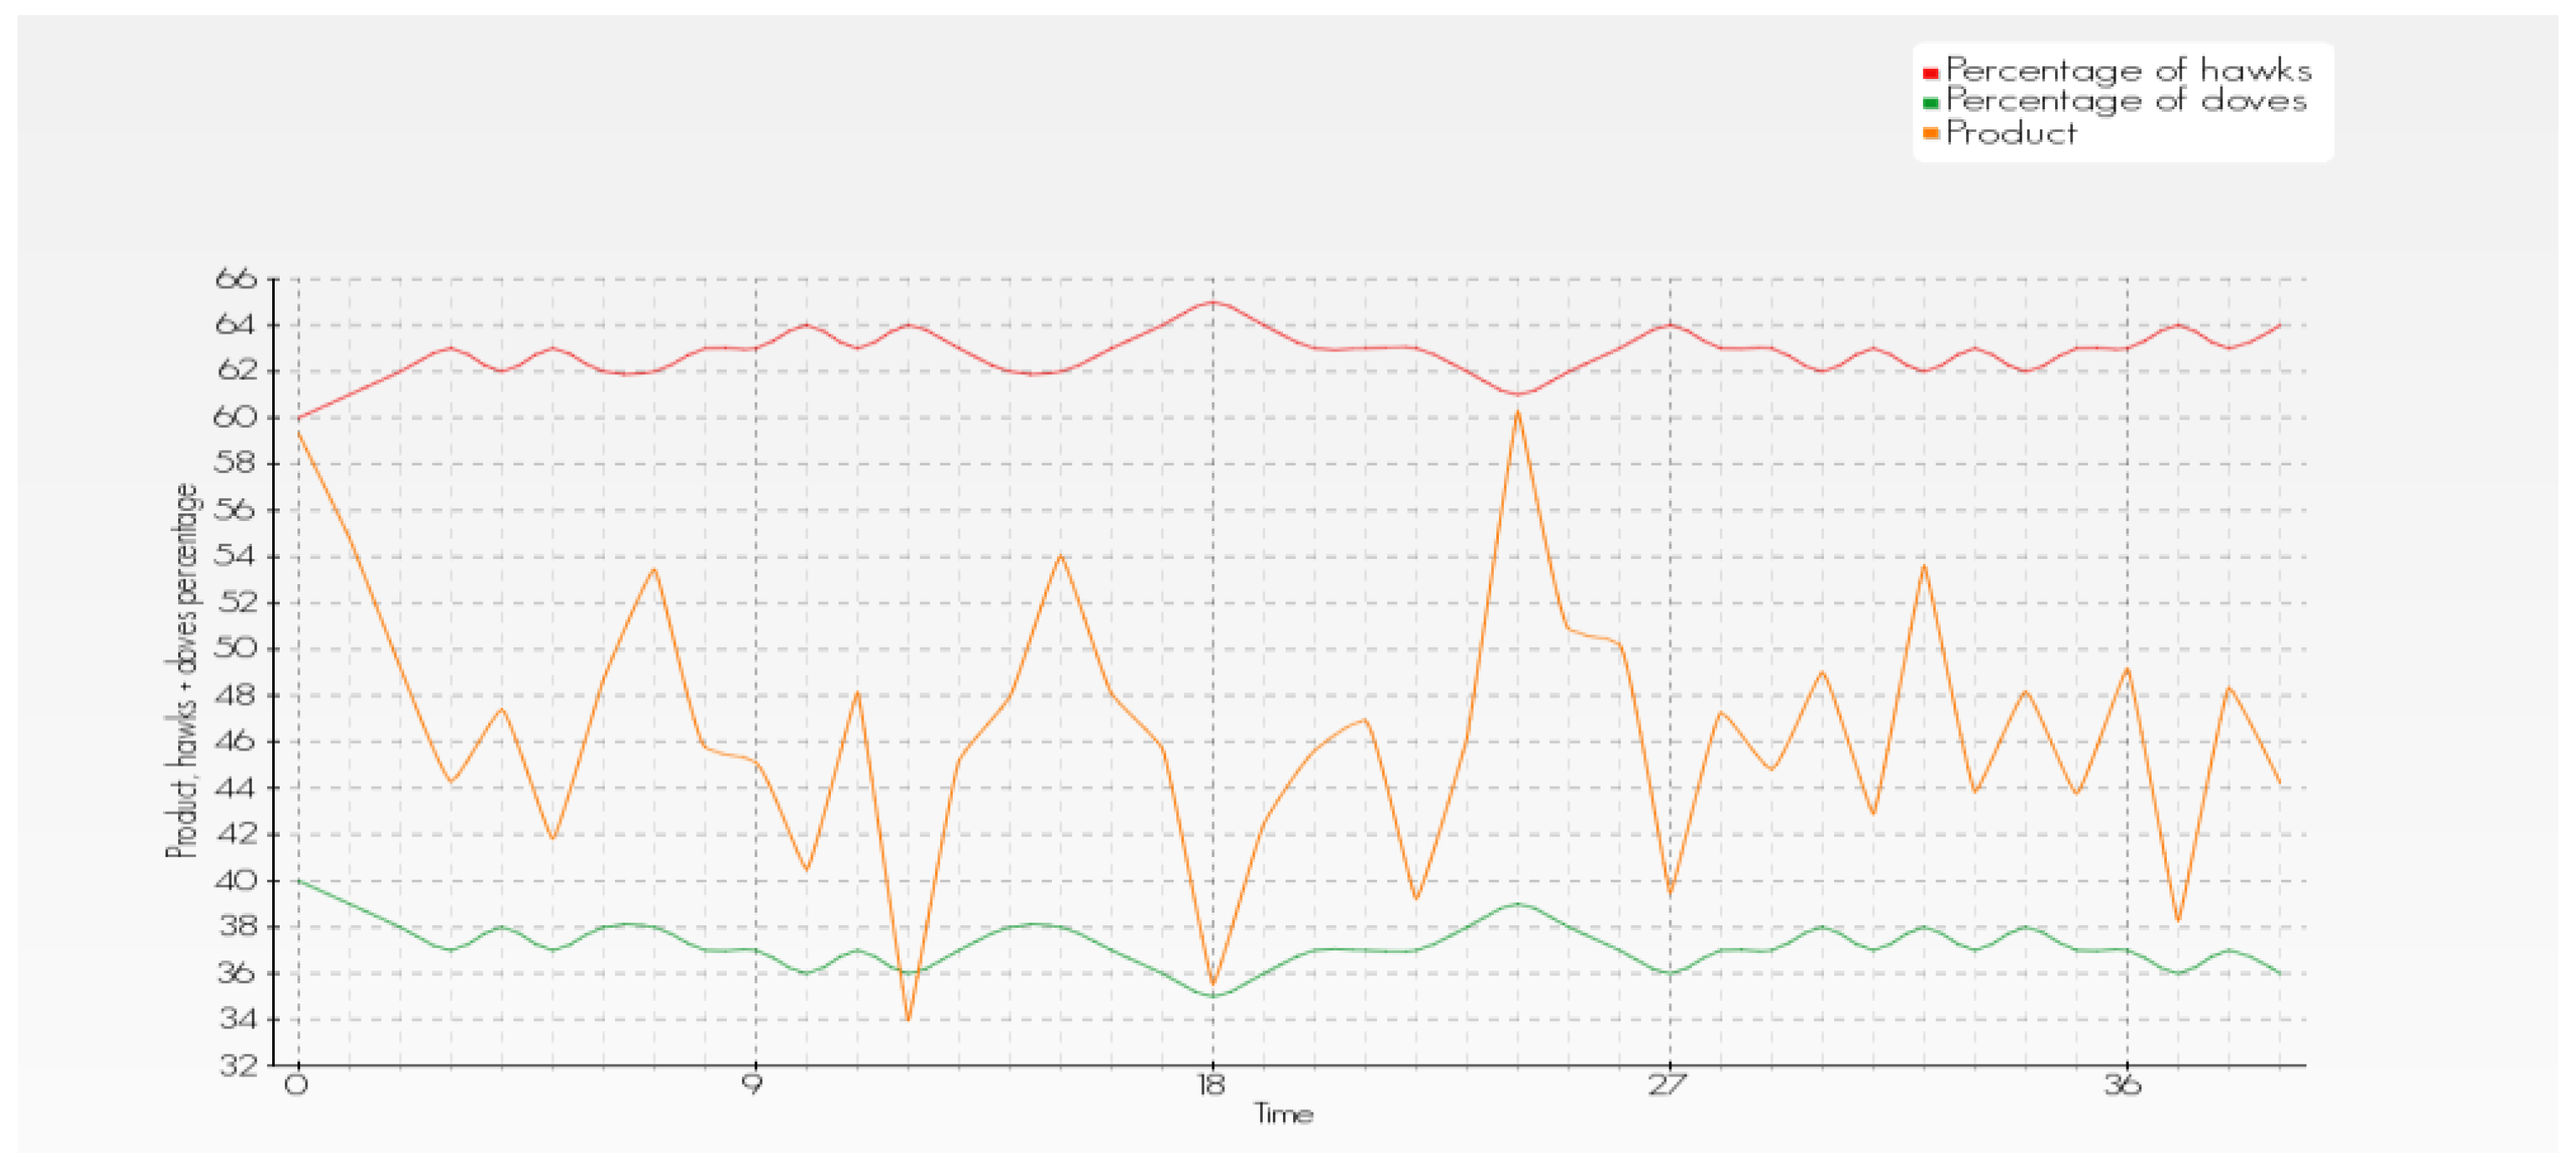
Axis x represents time (number of rounds) and axis y represents product P (orange line), percentage of hawks (red line), and percentage of doves (green line).
Figure 1 shows the simulation outcome under the following input coefficients: the starting percentage of hawks in the population is 60%. Over time the percentage of hawks oscillates between 60 and 65%, because the B (injury) value is not too high. We can see cycles and economic result (for population) is larger, when the percentage of doves grows.
The simulation presented in Figure 2 works with a starting percentage of hawks in the population of 60%. Over time, the percentage of hawks decreases to values of around 50% because the B (injury) value is higher than in the simulation seen in Figure 1. The equilibrium (percentage of hawks and doves) is different from Figure 1. We can see cycles as well, and the economic result (for population) is larger when percentage of doves grows.
The simulation presented in Figure 3 shows the following: the starting percentage of hawks in population is 60%, the same as in the previous two simulations. The B value (injury) is too high; thus, the hawk strategy is disadvantageous. Over time, the dove strategy prevails. As we can also see with these parameters, there is a cyclical oscillation of aggregate output.
Figure 4 shows a situation where the B value (injury) is low, so the hawk strategy is advantageous and over time the hawk strategy prevails. The starting percentage of hawks in the population is 60%. As we can also see with these parameters there are cycles, but the aggregate output (for population) is lower.
In the last simulation, as shown in Figure 5, we have increased the starting percentage of hawks in the population to 65%. R value (rent) and B value (injury) are in a similar ratio as in Figure 1. However, the population is much larger (100,000). Over time, the percentage of hawks oscillates between 65 and 67%. We can see cycles and the economic result (for population) is larger when percentage of doves grows.
All the simulations presented above confirm that the ratio of different strategies used by individual subjects (aggressive versus peaceful) in the population causes the cyclical development of performance of the society. A higher ratio of doves will mean a lower incidence of injury, so the sum of products in the population is higher. The number of hawks will increase, so the best strategy for the doves is to change their strategy to a hawk. This process will be reproduced cyclically. Cyclical changes confirm that if the dove increases to the detriment of hawks, the conjunction stage is in progress, and when the hawks increase to the detriment of the doves, the recession phase occurs. The hawks and doves’ percentage in the population oscillates around some value. This value is dependent on the described parameters R and B. The size of the population has only a minor influence on the results, as well as resetting the product at the beginning of each round.
What has been confirmed by the simulation at hand is that the performance of the society is affected by the ratio of individual strategies that are adopted in the population, therefore cyclical changes in this ratio necessarily cause fluctuations of the total product of society.
4. Concluding Remarks
The economic cycle has always been approached as a macroeconomic phenomenon [34,35] and economic research thus far has not used game theory—primarily a microeconomic apparatus describing behavior of individuals—as a standard tool for economic cycle identification. This study offers an unusual explanation of the economic cycle using the well-known apparatus of game theory.
Our ambition in the present study was to build the theory of the economic cycle on a microeconomic basis. Our contribution to the research on the economic cycle, we believe, consists of modelling an economic cycle (thus far, an eminent macroeconomic topic) by means of the game theory (principally a tool used for microeconomic analysis). In this paper, we show how individual strategies (strategic behavior) explained by means of the game theory may initiate the cyclical performance of aggregate output (macroeconomic cycle). Results of the presented simulation of dove–hawk games show that changing the share of the strategies in society will influence the aggregate output of the entire society. Individuals will change strategies rationally according to their payoff initiate in aggregation and cyclical oscillations in the society/economy product.
We argue that all types of economic cycles that may be defined as strategic (principally institutional and individual) may be potentially explained by game theory as shown in this paper. Reformulating strategic cycles using game theory and behavior simulations may well reinforce the explanatory power of traditional economic cycle theories.
Our results show that game theory has the potential to unify different methodologically existing approaches to the explanation of economic cycles. We are not sure if this methodological approach can be credibly applied to real cycle theories (for example innovation cycles). We believe, however, that also the real cycle theories may be amended by the strategic behavior of individuals. Applying this tool to other types of cycles (natural or institutional) remains an ambition for future research. We also hope to analyze strategic behavior of individual economic subjects under exogenous shocks.
Author Contributions
Conceptualization, K.Č., J.V. and M.B.; methodology, K.Č., J.V. and M.B.; software, M.B.; validation, M.B., J.V. and K.Č.; formal analysis, K.Č. and M.B.; investigation, K.Č. and J.V.; resources, H.M.; data curation, M.B.; writing—original draft preparation, K.Č.; writing—review and editing, H.M.; visualization, H.M.; supervision, K.Č.; project administration, K.Č. and H.M.; funding acquisition, K.Č. and H.M. All authors have read and agreed to the published version of the manuscript.
Funding
This research was funded by Prague University of Economics and Business, Economic Faculty, grant numbers IGS F5/2/2020 and IGS F5/25/2021.
Institutional Review Board Statement
Not applicable.
Informed Consent Statement
Not applicable.
Data Availability Statement
Data sharing not applicable.
Conflicts of Interest
The authors declare no conflict of interest.
References
- Ríos, M.Á.R.; López, J.B.L.; Veiga, J.G. Present and Future in the Mirror of the Past: Capitalist Dynamics, Digital Technology and Industry in the Fifth Kondratiev. World Rev. Political Econ. 2019, 10, 449–483. [Google Scholar] [CrossRef]
- Kitchin, J. Cycles and Trends in Economic Factors. Rev. Econ. Stat. 1923, 5, 10–16. [Google Scholar] [CrossRef]
- Juglar, C. Des Crises Commerciales; ENS Éditions: Paris, France, 1862. [Google Scholar]
- Kuznets, S. Secular Movements in Production and Prices; Houghton Miffin: Boston, MA, USA, 1930. [Google Scholar]
- Kondratieff, N.D. The Long Waves in Economic Life. Rev. Econ. Stat. 1935, 2, 105–115. [Google Scholar] [CrossRef]
- Vorlicek, J.; Cermakova, K. Strategic behavior as the cause of business cycles. Int. J. Econ. Sci. 2017, 6, 33–40. [Google Scholar] [CrossRef] [Green Version]
- Schumpeter, J.A. Business Cycles; McGraw-Hill: New York, NY, USA, 1939. [Google Scholar]
- Kydland, F.E.; Prescott, E.C. Time to Build and Aggregate Fluctuations. Econometrica 1982, 50, 1345–1371. [Google Scholar] [CrossRef]
- Kydland, F.E.; Prescott, E.C. Business Cycles: Real Facts and Monetary Myth. In Quarterly Review, Federal Reserve Bank of Mineapolis; Spring: Berlin, Germany, 1990. [Google Scholar]
- Hayek, F.A. Monetary Theory and Trade Cycle; Sentry Press: New York, NY, USA, 1933. [Google Scholar]
- Mises, L. The Theory of Money and Credit; Yale University Press: New Haven, CT, USA, 1953. [Google Scholar]
- Wicksell, K. Interest and Prices: A Study of the Causes Regulating the Value of Money; Macmillan: London, UK, 1936. [Google Scholar]
- Nordhaus, W.D. The Political Business Cycle. Rev. Econ. Stud. 1975, 42, 169–190. [Google Scholar] [CrossRef]
- Tufte, E.R. The Political Manipulation of the Economy: Influence of the Electoral Cycle on Macroeconomic Performance and Policy; Department of Politics, Princeton University: Princeton, NJ, USA, 1974. [Google Scholar]
- Marx, K. Capital: A Critique of Political Economy—Volume III: The Process of Capitalist Production as a Whole; Charles H. Kerr and Co. Cooperative: Chicago, IL, USA, 1909. [Google Scholar]
- George, H. Progress and Poverty: An Inquiry into the Cause of Industrial Depressions and of Increase of Want with Increase of Wealth; The Remedy, Robert Schalkenbach Foundation: New York, NY, USA, 1935. [Google Scholar]
- Fisher, I. The Debt-Deflation Theory of Great Depressions. Econometrica 1933, 1, 337–357. [Google Scholar] [CrossRef] [Green Version]
- Minsky, H.P. The Modeling of Financial Instability: An introduction in: Modeling and Simulation. In Proceedings of the Fifth Annual Pittsburgh Conference 5, Pittsburgh, PA, USA, 24–26 April 1974. [Google Scholar]
- Goodwin, R.M. A Growth Cycle, in: Socialism, Capitalism and Economic Growth; Cambridge Uni Press: Cambridge, UK, 1967. [Google Scholar]
- Kalecki, M. Selected Essays on the Dynamics of the Capitalist Economy; Cambridge University Press: Cambridge, UK, 1971. [Google Scholar]
- Keen, S. Finance and economic breakdown: Modelling Minsky’s Financial Instability Hypothesis. J. Post Keynes. Econ. 1995, 17, 607–635. [Google Scholar] [CrossRef]
- Sadik-Zada, E.R.; Loewenstein, W. Drivers of CO2-Emissions in Fossil Fuel Abundant Settings: (Pooled) Mean Group and Nonparametric Panel Analyses. Energies 2020, 13, 3956. [Google Scholar] [CrossRef]
- Gintis, H. Game Theory Evolving: A Problem-Centered Introduction to Modeling Strategic Behavior; Princeton University Press: Princeton, NJ, USA, 2000. [Google Scholar]
- Smith, J.M.; Price, G. The logic of animal conflict. Nature 1973, 246, 15. [Google Scholar] [CrossRef]
- Nowak, M.A. Evolutionary Dynamics: Exploring the Equations of Life; Harvard University Press: Cambridge, MA, USA, 2006. [Google Scholar]
- Poncela-Casasnovas, J.; Gutiérrez-Roig, M.; Gracia-Lázaro, C.; Vicens, J.; Gómez-Gardeñes, J.; Perelló, J.; Moreno, Y.; Duch, J.; Sánchez, A. Humans display a reduced set of consistent behavioral phenotypes in dyadic games. Sci. Adv. 2016, 2, e1600451. [Google Scholar] [CrossRef] [PubMed] [Green Version]
- Perc, M.; Szolnoki, A. Coevolutionary games—a mini review. BioSystems 2010, 99, 109–125. [Google Scholar] [CrossRef] [PubMed] [Green Version]
- Meloni, S.; Buscarino, A.; Fortuna, L.; Frasca, M.; Gómez-Gardeñes, J.; Latora, V.; Moreno, Y. Effects of mobility in a population of prisoner’s dilemma players. Phys. Rev. E 2009, 79, 067101. [Google Scholar] [CrossRef] [Green Version]
- Pacheco, J.M.; Santos, F.C.; Souza, M.O.; Skyrms, B. Evolutionary dynamics of collective action in N-person stag hunt dilemmas. Proc. Biol. Sci. 2009, 276, 315–321. [Google Scholar] [CrossRef] [PubMed] [Green Version]
- Doebeli, M.; Hauert, C. Models of cooperation based on the prisoner’s dilemma and the snowdrift game. Ecol. Lett. 2005, 8, 748–766. [Google Scholar] [CrossRef] [Green Version]
- Clare, J. Hawks, Doves, and International Cooperation. J. Confl. Resolut. 2014, 58, 1311–1337. [Google Scholar] [CrossRef]
- Russett, B. Doves, Hawks, and U.S. Public Opinion. Political Sci. Q. 1990, 105, 515–538. [Google Scholar] [CrossRef]
- Klugman, J. Hawks and Doves. Political Psychol. 1985, 6, 573–589. [Google Scholar] [CrossRef]
- Kadeřábková, B.; Jasová, E.; Holman, R. Analysis of substitution changes in the Phillips curve in V4 countries over the course of economic cycles. Int. J. Econ. Sci. 2020, 9, 39–54. [Google Scholar] [CrossRef]
- Kadeřábková, B.; Jašová, E. Development of real unit wage costs on the macro and mezzo level of the Czech Republic. Int. J. Econ. Sci. 2019, 8, 45–59. [Google Scholar] [CrossRef] [Green Version]
Scheme 1.
The flow diagram.

Figure 1.
Population 1000, R = 10, B = 19, 40 rounds.

Figure 2.
Population 1000, R = 10, B = 22, 40 rounds.

Figure 3.
Population 1000, R = 10, B = 25, 40 rounds.

Figure 4.
Population 1000, R = 10, B = 15, 40 rounds.

Figure 5.
Population 100,000, R = 5, B = 9, 20 rounds.


Table 1.
R and B simulation.
| Injury value is too high, so the hawk’s strategy is not effective. If we allow change of strategy, hawks little by little change to doves. | |
| Optimal value range for R and B. | |
| Injury value is low, so the hawk’s strategy is effective and numbers of doves in population are low, around 20%. |
Publisher’s Note: MDPI stays neutral with regard to jurisdictional claims in published maps and institutional affiliations. |
© 2021 by the authors. Licensee MDPI, Basel, Switzerland. This article is an open access article distributed under the terms and conditions of the Creative Commons Attribution (CC BY) license (https://creativecommons.org/licenses/by/4.0/).
Share and Cite
MDPI and ACS Style
Čermáková, K.; Bejček, M.; Vorlíček, J.; Mitwallyová, H. Neglected Theories of Business Cycle—Alternative Ways of Explaining Economic Fluctuations. Data 2021, 6, 109. https://doi.org/10.3390/data6110109
AMA Style
Čermáková K, Bejček M, Vorlíček J, Mitwallyová H. Neglected Theories of Business Cycle—Alternative Ways of Explaining Economic Fluctuations. Data. 2021; 6(11):109. https://doi.org/10.3390/data6110109
Chicago/Turabian StyleČermáková, Klára, Michal Bejček, Jan Vorlíček, and Helena Mitwallyová. 2021. "Neglected Theories of Business Cycle—Alternative Ways of Explaining Economic Fluctuations" Data 6, no. 11: 109. https://doi.org/10.3390/data6110109