
Do you ever feel like your friends have more friends than you do? Though your mom might insist that you’re just as popular as they are, math’s inspection paradox explains why you’re probably right. It also reveals why it often feels like you’re waiting too long for the train or bus, why call centers always seem to be experiencing higher-than-average call volume and other daily frustrations.
Consider a social network like Facebook, where the average user has a few hundred friends. Someone with 10,000 friends appears in 10,000 other users’ friend lists, making many of those (average) people feel unpopular by comparison. On the flip side, someone with five friends appears only in their five friends’ lists, making only five people feel popular by comparison. That’s the key idea: a person’s representation in other users’ friend circles is proportional to their own popularity. You’re more likely to have very popular friends preciselybecause they’re popular. Don’t tell your mom.
Just consider the simple social network below.
On supporting science journalism
If you're enjoying this article, consider supporting our award-winning journalism by subscribing. By purchasing a subscription you are helping to ensure the future of impactful stories about the discoveries and ideas shaping our world today.
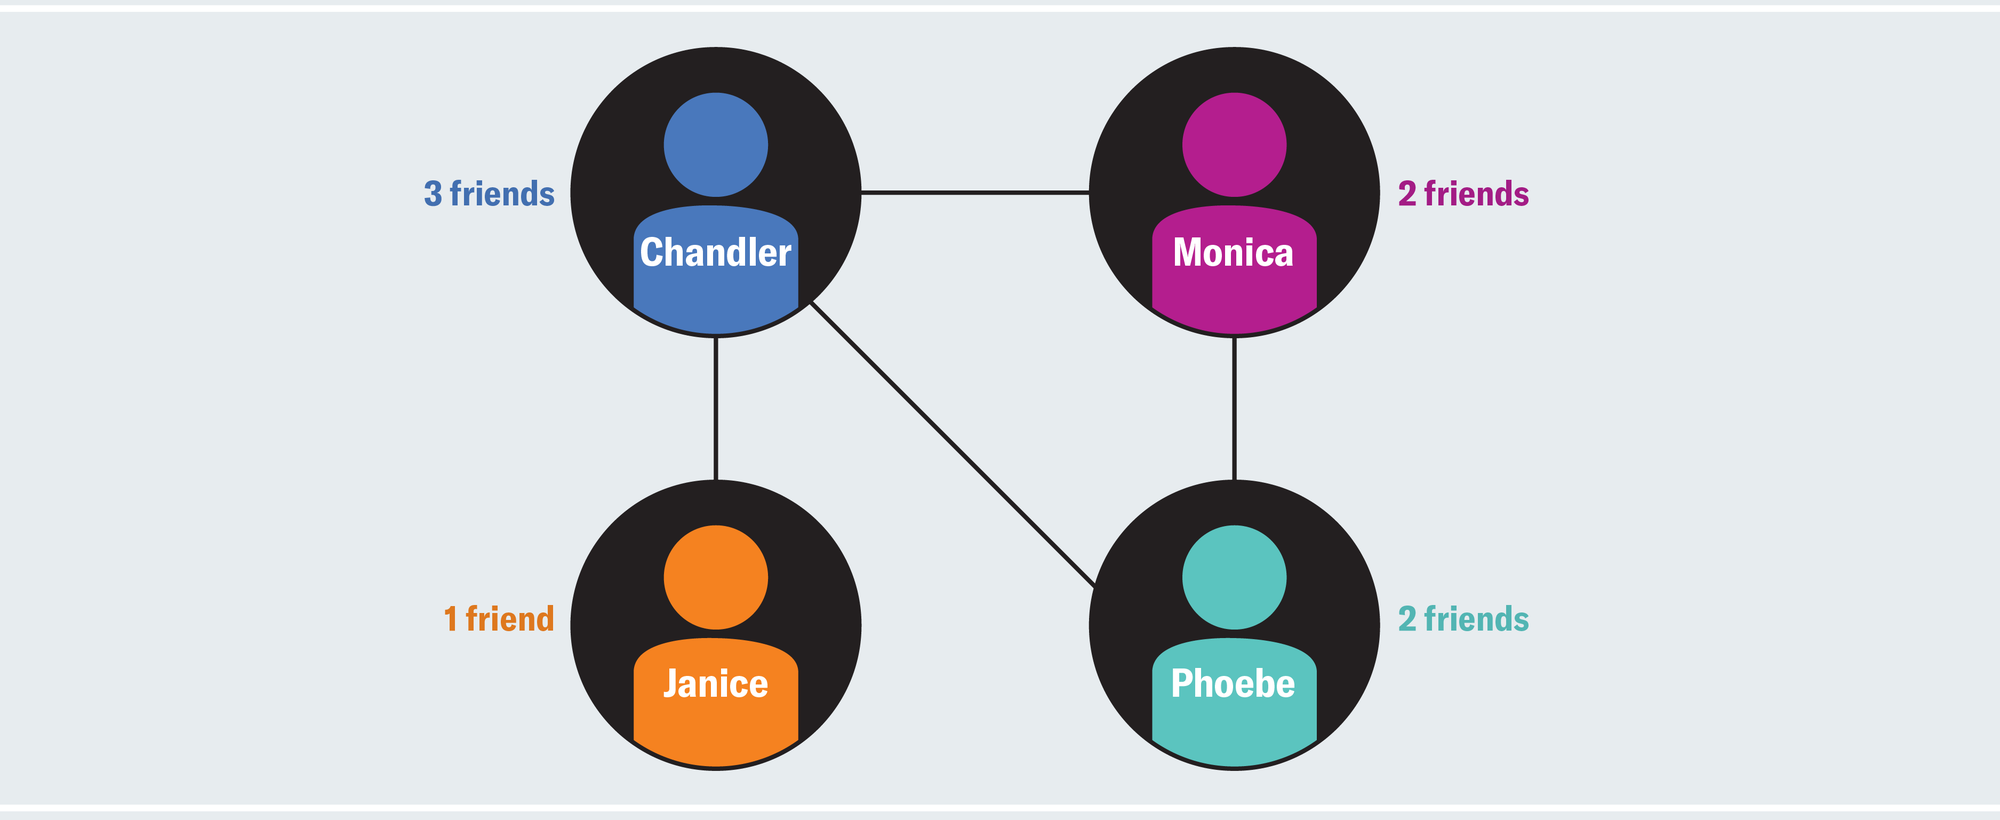
Credit: Amanda Montañez
Chandler has three friends, Monica and Phoebe have two, and Janice has one, for a total of eight. We then divide those eight friends by the four people in the network to get an average of two friends. Notice, though, that Monica’s friends have 2.5 friends on average (Chandler’s three plus Phoebe’s two, all divided by two). Monica’s friends have more friends on average than she does (2.5 > 2), which could make her feel relatively unpopular even though she’s actually perfectly average. Her local perspective on her immediate friend circle tells a different story from the global perspective of her status in the network as a whole.
The same happens to Phoebe and Janice, whose friends have 2.5 and three friends on average, respectively. Only Chandler’s friend group is relatively unpopular, with an average that rounds to 1.67 friends. The majority of people in this group are less popular than their friends. Another way to quantify this is to look at the average number of friends that one’s friends have in this network, which is approximately (2.5 + 2.5 + 3 + 1.67) / 4 = 2.42. That number is larger than the average person’s friend count of two.
Surprisingly, this will always happen in every network (unless everybody has an identical number of friends, in which case the measures will be equal). On average, people’s co-authors have had more co-authors than they have, and their sexual partners have had more sexual partners than they have. Though the network examples are sometimes dubbed the “friendship paradox,” they fall under a more general phenomenon known as the “inspection paradox.” The inspection paradox is not a paradox at all, as both perspectives can be valid simultaneously. Monica’s friends in our hypothetical network are more popular than she is, and she also has a typical number of friends.
Confused? Here’s another example. Ask university students their average class size, and it will always skew larger than the administration’s official reports of average class size. Are these students exaggerating? Is the administration deflating numbers to make their student-teacher ratio look more favorable? No, both perspectives are correct. Students in big lecture courses naturally report larger class-size averages, whereas students who only take intimate seminars report smaller class-size averages, but there are far more people in the former group precisely because lecture halls contain more people than intimate seminars. Polling the students counts high-enrollment classes more often than low-enrollment classes, whereas when the university tallies average class size, they count big lectures and small seminars each only once.
The inspection paradox is at work in some of the most mundane places. Suppose a transit authority promises that its metro trains pull through a station every eight minutes on average. If you arrive at the station at a random time between trains (ignore rush hour), then sometimes you’ll sit for seven minutes and 50 seconds, and other times you’ll hear the oncoming whistle just as you cross the turnstile. You might expect these cases to even out over time to about a four-minute wait on average. So why does it always feel longer than that? Sure, train arrivals every eight minutes on average don’t imply every eight minutes on the dot. The schedule usually staggers, with some long intervals between arrivals and some short. But why does your bad luck always plunk you in a long interval? It’s not bad luck, it’s just probability. You’re more likely to arrive during long intervals because they’re longer.
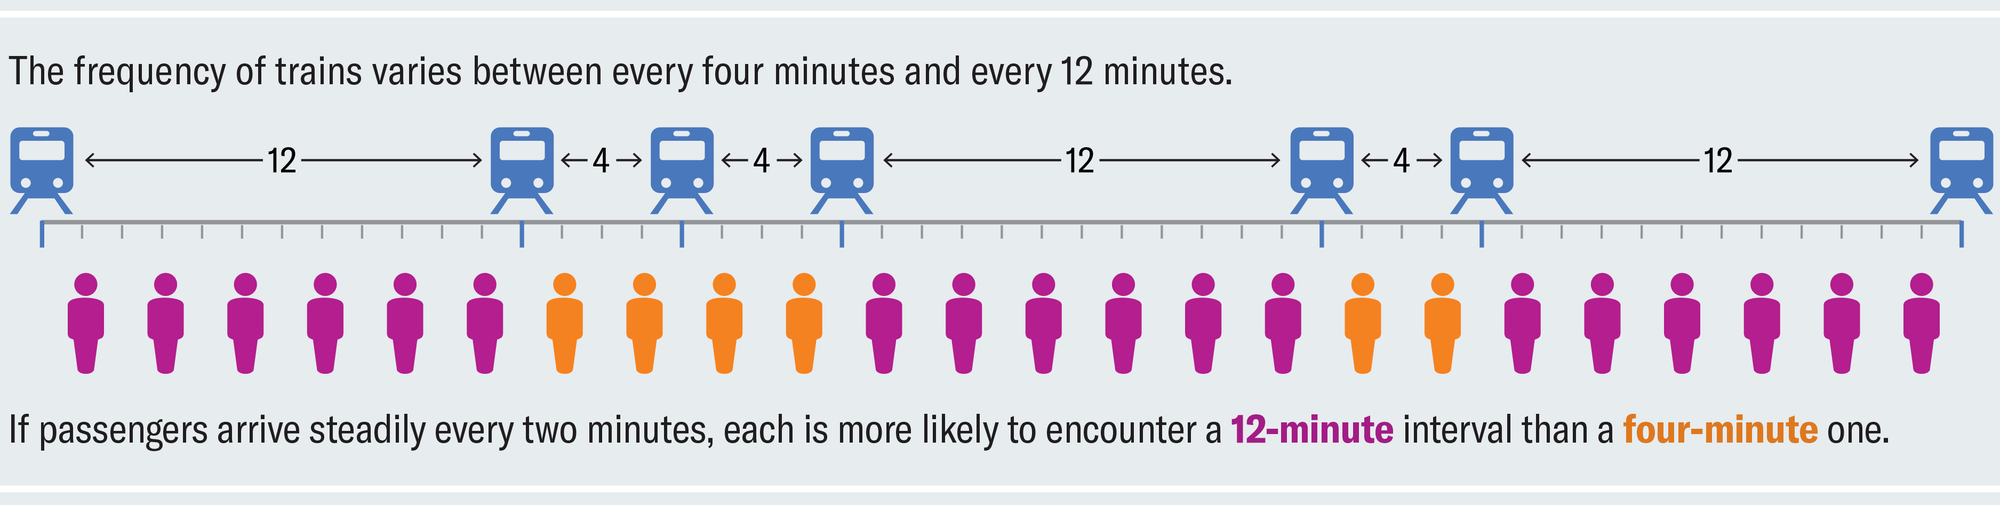
Credit: Amanda Montañez
The sample timeline above depicts six intervals between trains—half of these last 12 minutes and the other half last four. The transit authority could advertise an average duration of eight minutes between trains, but individual commuters are three times as likely to show up during a long interval and experience a frustrating wait.
Scientists need to stay diligent about the inspection paradox and the biases it could cause. To conduct a study on average university class sizes, for example, one must specify exactly what one means to measure and tailor the polling methodology accordingly. But some clever researchers have also exploited the phenomenon to improve their random sampling. A particularly interesting example comes from a study on the spread of flu. During an outbreak, well-connected people tend to contract diseases earlier because of their high social contact. To detect outbreaks quickly, epidemiologists could prioritize monitoring those people, if they knew who they were in advance. The naive method of checking the flu status of random members of the population gives no priority to well-connected people; and mapping out the structure of the social network would take too much time. Instead, researchers tried picking random people and monitoring their friends. This slight tweak greatly improves the chances that well-connected people show up in the sample because, as we’ve seen, people’s friends tend to be more popular than they are. This technique allowed the researchers to detect a flu outbreak two weeks earlier than traditional random sampling.
For the rest of us who don’t work in research, the inspection paradox can still help explain our everyday observations. Why is it that call centers always seem to be experiencing higher-than-normal call volume? Maybe they just say that to excuse understaffing, or maybe we all tend to call at the same time, like our lunch breaks. But perhaps we’re just more likely to belong to a bigger group of simultaneous callers precisely because it’s bigger. If an airline complains that not enough people buy tickets and they’re forced to fly near-empty planes, why do you so rarely enjoy the luxury of an uncontested armrest? Because, by definition, few people do. Sometimes when you feel down on your luck, a broader perspective really can help. At least it’s something to ponder while we wait for the next train.