SlideShare a Scribd company logo
1 of 13
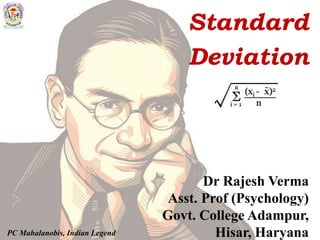
Standard
Deviation
Dr Rajesh Verma
Asst. Prof (Psychology)
Govt. College Adampur,
Hisar, HaryanaPC Mahalanobis, Indian Legend
Meaning-Cum-Definition
It’s a quantity that indicates by how much the
members of a group differ from the mean value for the
group.
Standard deviation is and index of degree of
dispersion and an estimate of the variability in the
population from which the sample is drawn (Guilford
& Fruchter,
1976).
Introduction
SD is also known as Coefficient of Variation (CV). It’s
a kind of special average of all the deviation from the group
mean. Special average means that SD is beyond the simple
arithmetic mean. Along with the total range, semi-
interquartile range, average deviation it is the most
commonly used single number to indicate
variability among a data set. Variability is
the scatter or spread of the separate scores
around their central tendency (Garret, 2014).
SD is the most stable index of variability
which is computed using squared deviations
that are taken from mean only i.e. neither
median nor mode.
Characteristics
(i) High value of SD means that most of the scores are
away from group mean and vice versa.
(ii) It is the index of spread of scores about the mean that
involves every observation.
(iii) Greater SD than mean indicates
that the distribution have majority of
low values.
(iv) Lower SD than mean indicates
that the distribution have majority
of high values.
(v) It can also indicate that whether
the distribution has dispersion of
extreme values or has
central tendency.
(vi) It is expressed in the same units as the data.
(vii) It is possible to calculate the combined standard
deviation of two or more groups.
(viii) The SD is considered most appropriate statistical tool
for comparing the variability of two or more groups.
(ix) It is used as unit of measurement in normal
probability distribution.
(x) SD forms the base for
several statistical techniques
such skewness, kurtosis,
ANOVA etc.
How much SD is Good or Bad
No amount of SD is good or bad because it’s just an
indicator of spread of scores. If someone is interested to see
the closeness of scores around the mean than SD ≤ 1 is good,
on the other hand if someone is interested in larger spread
than SD ≥ 1 is good. Across books and manuals it has been
accepted that SD ≥ 1 is the
indicator of high variation
among the scores and SD ≤ 1
indicates low variation. It’s a
kind of rule of thumb.
In fact it depend upon
the data set and objectives of
the researcher.
Computation of SD
For Ungrouped Data
Let us take an hypothetical data.
Ex – 12, 54, 32, 51, 24, 58, 21, 43, 31, 48
Step I – Calculate the mean.
Mean ( 𝒙) =
∑𝒙
𝑵
Where, x = Score
N = total no. of score
Therefore, 12+54+32+51+24
+58+21+43+31+48 = 374
𝒙 =
𝟑𝟕𝟒
𝟏𝟏
= 34
Step II – Calculate deviation (d) of each score from
the mean.
(i) It is achieved by
subtracting group mean
from each score,
(ii) Square the each
Deviation,
(iii) Sum up squared
Deviations,
Step III – Calculate SD by
using the following formula
σ =
∑𝒅 𝟐
𝑵
=>
𝟐𝟑𝟐𝟕
𝟏𝟏
=> 𝟐𝟏𝟏. 𝟓𝟒𝟓 = 14.545
SD of Grouped Data
Let us take Hypothetical Data
as shown in adjacent table
Step I - Calculate the mean
For calculation of mean we must
follow the following few steps
Steps of calculating mean
(i) Find the midpoints of CI (x)
(ii) Multiply midpoints (x) with their respective
frequency (f)
(iii) Add fx
(iv) Divide it by the sum of
frequencies i.e. 50
mean =
∑𝒇 𝒙
𝑵
=
𝟏𝟔𝟓𝟎
𝟓𝟎
= 33
Step II-Subtract mean from the mid points i.e. 𝒙 − 𝒙
Step III-Square these values which are denoted by (x`)
Step IV-Multiply x` with their respective frequencies (fx`)
Step V-Add fx`
Finally substitute the values in the formula
σ =
∑𝒇𝒙`
𝑵
=
𝟓𝟓𝟏𝟐
𝟓𝟎
= 𝟏𝟏𝟎. 𝟐𝟒
(𝒔 𝟐
= 110.24)
= 10.499
References:
1. https://dictionary.apa.org/quartile-deviation.
2. Guilford, J. P. and Fruchter, B. (1978). Fundamental Statistics in
Psychology and Education, 6th ed. Tokyo: McGraw-Hill.
3. https://todayinsci.com/M/Mahalanobis_Prasanta/
MahalanobisPrasanta-Quotations.htm.
4. Garrett, H. E. (2014). Statistics in Psychology and Education. New
Delhi: Pragon International.
5. Levin, J. & Fox, J. A. (2006). Elementary Statistics.
New Delhi: Pearson.
vermasujit@yahoo.com
Next
Discussion
Concept of
Normality

More Related Content

What's hot (20)

O-give slide share
O-give slide shareO-give slide share
O-give slide share
 
Rank correlation
Rank correlationRank correlation
Rank correlation
 
Percentile and percentile rank
Percentile and percentile rankPercentile and percentile rank
Percentile and percentile rank
 
Measurement of scales
Measurement of scalesMeasurement of scales
Measurement of scales
 
Normal probability curve zubia
Normal probability curve zubiaNormal probability curve zubia
Normal probability curve zubia
 
Descriptive statistics
Descriptive statisticsDescriptive statistics
Descriptive statistics
 
Measures of dispersion
Measures of dispersion Measures of dispersion
Measures of dispersion
 
Measure of dispersion
Measure of dispersionMeasure of dispersion
Measure of dispersion
 
Graphical Representation of Statistical data
Graphical Representation of Statistical dataGraphical Representation of Statistical data
Graphical Representation of Statistical data
 
Statistics report THE RANGE
Statistics report THE RANGEStatistics report THE RANGE
Statistics report THE RANGE
 
Measurement of central tendency
Measurement of central tendencyMeasurement of central tendency
Measurement of central tendency
 
Meaning and types of correlation
Meaning and types of correlationMeaning and types of correlation
Meaning and types of correlation
 
Likert scale
Likert scaleLikert scale
Likert scale
 
Measures of dispersion
Measures  of  dispersionMeasures  of  dispersion
Measures of dispersion
 
Frequency Polygon.pptx
Frequency Polygon.pptxFrequency Polygon.pptx
Frequency Polygon.pptx
 
Measures of variability
Measures of variabilityMeasures of variability
Measures of variability
 
Point and Interval Estimation
Point and Interval EstimationPoint and Interval Estimation
Point and Interval Estimation
 
Median & mode
Median & modeMedian & mode
Median & mode
 
Scales of Measurement - Thiyagu
Scales of Measurement - ThiyaguScales of Measurement - Thiyagu
Scales of Measurement - Thiyagu
 
Karl pearson's correlation
Karl pearson's correlationKarl pearson's correlation
Karl pearson's correlation
 

Similar to Standard Deviation (Meaning, Characteristics and Calculation)

Statistics and permeability engineering reports
Statistics and permeability engineering reportsStatistics and permeability engineering reports
Statistics and permeability engineering reportswwwmostafalaith99
 
BRM_Data Analysis, Interpretation and Reporting Part II.ppt
BRM_Data Analysis, Interpretation and Reporting Part II.pptBRM_Data Analysis, Interpretation and Reporting Part II.ppt
BRM_Data Analysis, Interpretation and Reporting Part II.pptAbdifatahAhmedHurre
 
Describing quantitative data with numbers
Describing quantitative data with numbersDescribing quantitative data with numbers
Describing quantitative data with numbersUlster BOCES
 
MEASURES OF DISPERSION I BSc Botany .ppt
MEASURES OF DISPERSION I BSc Botany .pptMEASURES OF DISPERSION I BSc Botany .ppt
MEASURES OF DISPERSION I BSc Botany .pptaigil2
 
MEASURE-OF-VARIABILITY- for students. Ppt
MEASURE-OF-VARIABILITY- for students. PptMEASURE-OF-VARIABILITY- for students. Ppt
MEASURE-OF-VARIABILITY- for students. PptPrincessjaynoviaKali
 
Unit 1 bp801 t i standard deviation
Unit 1 bp801 t  i standard deviationUnit 1 bp801 t  i standard deviation
Unit 1 bp801 t i standard deviationashish7sattee
 
best for normal distribution.ppt
best for normal distribution.pptbest for normal distribution.ppt
best for normal distribution.pptDejeneDay
 
statical-data-1 to know how to measure.ppt
statical-data-1 to know how to measure.pptstatical-data-1 to know how to measure.ppt
statical-data-1 to know how to measure.pptNazarudinManik1
 
Central tendency _dispersion
Central tendency _dispersionCentral tendency _dispersion
Central tendency _dispersionKirti Gupta
 
Descriptive Statistics: Measures of Central Tendency - Measures of Dispersion...
Descriptive Statistics: Measures of Central Tendency - Measures of Dispersion...Descriptive Statistics: Measures of Central Tendency - Measures of Dispersion...
Descriptive Statistics: Measures of Central Tendency - Measures of Dispersion...EqraBaig
 
STATISTICAL PARAMETERS
STATISTICAL  PARAMETERSSTATISTICAL  PARAMETERS
STATISTICAL PARAMETERSHasiful Arabi
 
Unit 5 8614.pptx A_Movie_Review_Pursuit_Of_Happiness
Unit 5 8614.pptx A_Movie_Review_Pursuit_Of_HappinessUnit 5 8614.pptx A_Movie_Review_Pursuit_Of_Happiness
Unit 5 8614.pptx A_Movie_Review_Pursuit_Of_Happinessourbusiness0014
 
These is info only ill be attaching the questions work CJ 301 – .docx
These is info only ill be attaching the questions work CJ 301 – .docxThese is info only ill be attaching the questions work CJ 301 – .docx
These is info only ill be attaching the questions work CJ 301 – .docxmeagantobias
 

Similar to Standard Deviation (Meaning, Characteristics and Calculation) (20)

Statistics and permeability engineering reports
Statistics and permeability engineering reportsStatistics and permeability engineering reports
Statistics and permeability engineering reports
 
BRM_Data Analysis, Interpretation and Reporting Part II.ppt
BRM_Data Analysis, Interpretation and Reporting Part II.pptBRM_Data Analysis, Interpretation and Reporting Part II.ppt
BRM_Data Analysis, Interpretation and Reporting Part II.ppt
 
Describing quantitative data with numbers
Describing quantitative data with numbersDescribing quantitative data with numbers
Describing quantitative data with numbers
 
MEASURES OF DISPERSION I BSc Botany .ppt
MEASURES OF DISPERSION I BSc Botany .pptMEASURES OF DISPERSION I BSc Botany .ppt
MEASURES OF DISPERSION I BSc Botany .ppt
 
Lec 13
Lec 13Lec 13
Lec 13
 
MEASURE-OF-VARIABILITY- for students. Ppt
MEASURE-OF-VARIABILITY- for students. PptMEASURE-OF-VARIABILITY- for students. Ppt
MEASURE-OF-VARIABILITY- for students. Ppt
 
statistics
statisticsstatistics
statistics
 
Measure of Central Tendency
Measure of Central TendencyMeasure of Central Tendency
Measure of Central Tendency
 
Unit 1 bp801 t i standard deviation
Unit 1 bp801 t  i standard deviationUnit 1 bp801 t  i standard deviation
Unit 1 bp801 t i standard deviation
 
best for normal distribution.ppt
best for normal distribution.pptbest for normal distribution.ppt
best for normal distribution.ppt
 
statical-data-1 to know how to measure.ppt
statical-data-1 to know how to measure.pptstatical-data-1 to know how to measure.ppt
statical-data-1 to know how to measure.ppt
 
Central tendency _dispersion
Central tendency _dispersionCentral tendency _dispersion
Central tendency _dispersion
 
Stat11t chapter3
Stat11t chapter3Stat11t chapter3
Stat11t chapter3
 
Measures of Dispersion (Variability)
Measures of Dispersion (Variability)Measures of Dispersion (Variability)
Measures of Dispersion (Variability)
 
Measures of dispersion
Measures of dispersionMeasures of dispersion
Measures of dispersion
 
Descriptive Statistics: Measures of Central Tendency - Measures of Dispersion...
Descriptive Statistics: Measures of Central Tendency - Measures of Dispersion...Descriptive Statistics: Measures of Central Tendency - Measures of Dispersion...
Descriptive Statistics: Measures of Central Tendency - Measures of Dispersion...
 
STATISTICAL PARAMETERS
STATISTICAL  PARAMETERSSTATISTICAL  PARAMETERS
STATISTICAL PARAMETERS
 
Unit 5 8614.pptx A_Movie_Review_Pursuit_Of_Happiness
Unit 5 8614.pptx A_Movie_Review_Pursuit_Of_HappinessUnit 5 8614.pptx A_Movie_Review_Pursuit_Of_Happiness
Unit 5 8614.pptx A_Movie_Review_Pursuit_Of_Happiness
 
21.StatsLecture.07.ppt
21.StatsLecture.07.ppt21.StatsLecture.07.ppt
21.StatsLecture.07.ppt
 
These is info only ill be attaching the questions work CJ 301 – .docx
These is info only ill be attaching the questions work CJ 301 – .docxThese is info only ill be attaching the questions work CJ 301 – .docx
These is info only ill be attaching the questions work CJ 301 – .docx
 

More from Dr Rajesh Verma

1_Anxiety disorders.pptx
1_Anxiety disorders.pptx1_Anxiety disorders.pptx
1_Anxiety disorders.pptxDr Rajesh Verma
 
2_Substance related and addictive disorders.pptx
2_Substance related and addictive disorders.pptx2_Substance related and addictive disorders.pptx
2_Substance related and addictive disorders.pptxDr Rajesh Verma
 
व्यावहारिक मनोविज्ञान का अर्थ इतिहास (Meaning and History of Applied Pschology)
व्यावहारिक मनोविज्ञान का अर्थ इतिहास (Meaning and History of Applied Pschology)व्यावहारिक मनोविज्ञान का अर्थ इतिहास (Meaning and History of Applied Pschology)
व्यावहारिक मनोविज्ञान का अर्थ इतिहास (Meaning and History of Applied Pschology)Dr Rajesh Verma
 
National Education day 11 November 2020
National Education day 11 November 2020National Education day 11 November 2020
National Education day 11 November 2020Dr Rajesh Verma
 
concept of abnormality (Hindi & English)
concept of abnormality (Hindi & English)concept of abnormality (Hindi & English)
concept of abnormality (Hindi & English)Dr Rajesh Verma
 
सामान्यता की अवधारणा (concept of normality)
सामान्यता की अवधारणा  (concept of normality)सामान्यता की अवधारणा  (concept of normality)
सामान्यता की अवधारणा (concept of normality)Dr Rajesh Verma
 
concept of normality (English)
concept of normality (English)concept of normality (English)
concept of normality (English)Dr Rajesh Verma
 
Overview of Quantitative research by Prof Rajbir Singh.
Overview of Quantitative research by Prof Rajbir Singh.Overview of Quantitative research by Prof Rajbir Singh.
Overview of Quantitative research by Prof Rajbir Singh.Dr Rajesh Verma
 
मानक विचलन (standard deviation)
मानक  विचलन (standard deviation)मानक  विचलन (standard deviation)
मानक विचलन (standard deviation)Dr Rajesh Verma
 
standard deviation: an introduction
standard deviation: an introductionstandard deviation: an introduction
standard deviation: an introductionDr Rajesh Verma
 
चतुर्थक विचलन (quartile deviation)
चतुर्थक विचलन (quartile deviation)चतुर्थक विचलन (quartile deviation)
चतुर्थक विचलन (quartile deviation)Dr Rajesh Verma
 
quartile deviation: An introduction
quartile deviation: An introductionquartile deviation: An introduction
quartile deviation: An introductionDr Rajesh Verma
 
विचलनशीलता: एक परिचय
विचलनशीलता:  एक परिचय विचलनशीलता:  एक परिचय
विचलनशीलता: एक परिचय Dr Rajesh Verma
 
variability an introduction
variability an introductionvariability an introduction
variability an introductionDr Rajesh Verma
 
Importance of social science research 17.09.2020
Importance of social science research 17.09.2020Importance of social science research 17.09.2020
Importance of social science research 17.09.2020Dr Rajesh Verma
 
केंद्रीय प्रवृत्ति के माप
केंद्रीय प्रवृत्ति के मापकेंद्रीय प्रवृत्ति के माप
केंद्रीय प्रवृत्ति के मापDr Rajesh Verma
 
measures of central tendencies
measures of central tendenciesmeasures of central tendencies
measures of central tendenciesDr Rajesh Verma
 
Measures of central tendencies
Measures of central tendenciesMeasures of central tendencies
Measures of central tendenciesDr Rajesh Verma
 
Mirror drawing Apparatus
Mirror drawing ApparatusMirror drawing Apparatus
Mirror drawing ApparatusDr Rajesh Verma
 

More from Dr Rajesh Verma (20)

1_Anxiety disorders.pptx
1_Anxiety disorders.pptx1_Anxiety disorders.pptx
1_Anxiety disorders.pptx
 
2_Substance related and addictive disorders.pptx
2_Substance related and addictive disorders.pptx2_Substance related and addictive disorders.pptx
2_Substance related and addictive disorders.pptx
 
व्यावहारिक मनोविज्ञान का अर्थ इतिहास (Meaning and History of Applied Pschology)
व्यावहारिक मनोविज्ञान का अर्थ इतिहास (Meaning and History of Applied Pschology)व्यावहारिक मनोविज्ञान का अर्थ इतिहास (Meaning and History of Applied Pschology)
व्यावहारिक मनोविज्ञान का अर्थ इतिहास (Meaning and History of Applied Pschology)
 
National Education day 11 November 2020
National Education day 11 November 2020National Education day 11 November 2020
National Education day 11 November 2020
 
concept of abnormality (Hindi & English)
concept of abnormality (Hindi & English)concept of abnormality (Hindi & English)
concept of abnormality (Hindi & English)
 
सामान्यता की अवधारणा (concept of normality)
सामान्यता की अवधारणा  (concept of normality)सामान्यता की अवधारणा  (concept of normality)
सामान्यता की अवधारणा (concept of normality)
 
concept of normality (English)
concept of normality (English)concept of normality (English)
concept of normality (English)
 
Overview of Quantitative research by Prof Rajbir Singh.
Overview of Quantitative research by Prof Rajbir Singh.Overview of Quantitative research by Prof Rajbir Singh.
Overview of Quantitative research by Prof Rajbir Singh.
 
मानक विचलन (standard deviation)
मानक  विचलन (standard deviation)मानक  विचलन (standard deviation)
मानक विचलन (standard deviation)
 
standard deviation: an introduction
standard deviation: an introductionstandard deviation: an introduction
standard deviation: an introduction
 
चतुर्थक विचलन (quartile deviation)
चतुर्थक विचलन (quartile deviation)चतुर्थक विचलन (quartile deviation)
चतुर्थक विचलन (quartile deviation)
 
quartile deviation: An introduction
quartile deviation: An introductionquartile deviation: An introduction
quartile deviation: An introduction
 
विचलनशीलता: एक परिचय
विचलनशीलता:  एक परिचय विचलनशीलता:  एक परिचय
विचलनशीलता: एक परिचय
 
variability an introduction
variability an introductionvariability an introduction
variability an introduction
 
Importance of social science research 17.09.2020
Importance of social science research 17.09.2020Importance of social science research 17.09.2020
Importance of social science research 17.09.2020
 
केंद्रीय प्रवृत्ति के माप
केंद्रीय प्रवृत्ति के मापकेंद्रीय प्रवृत्ति के माप
केंद्रीय प्रवृत्ति के माप
 
measures of central tendencies
measures of central tendenciesmeasures of central tendencies
measures of central tendencies
 
Measures of central tendencies
Measures of central tendenciesMeasures of central tendencies
Measures of central tendencies
 
Maze learning Apparatus
Maze learning ApparatusMaze learning Apparatus
Maze learning Apparatus
 
Mirror drawing Apparatus
Mirror drawing ApparatusMirror drawing Apparatus
Mirror drawing Apparatus
 

Recently uploaded

HMCS Max Bernays Pre-Deployment Brief (May 2024).pptx
HMCS Max Bernays Pre-Deployment Brief (May 2024).pptxHMCS Max Bernays Pre-Deployment Brief (May 2024).pptx
HMCS Max Bernays Pre-Deployment Brief (May 2024).pptxEsquimalt MFRC
 
Kodo Millet PPT made by Ghanshyam bairwa college of Agriculture kumher bhara...
Kodo Millet  PPT made by Ghanshyam bairwa college of Agriculture kumher bhara...Kodo Millet  PPT made by Ghanshyam bairwa college of Agriculture kumher bhara...
Kodo Millet PPT made by Ghanshyam bairwa college of Agriculture kumher bhara...pradhanghanshyam7136
 
How to Create and Manage Wizard in Odoo 17
How to Create and Manage Wizard in Odoo 17How to Create and Manage Wizard in Odoo 17
How to Create and Manage Wizard in Odoo 17Celine George
 
This PowerPoint helps students to consider the concept of infinity.
This PowerPoint helps students to consider the concept of infinity.This PowerPoint helps students to consider the concept of infinity.
This PowerPoint helps students to consider the concept of infinity.christianmathematics
 
Understanding Accommodations and Modifications
Understanding  Accommodations and ModificationsUnderstanding  Accommodations and Modifications
Understanding Accommodations and ModificationsMJDuyan
 
How to Give a Domain for a Field in Odoo 17
How to Give a Domain for a Field in Odoo 17How to Give a Domain for a Field in Odoo 17
How to Give a Domain for a Field in Odoo 17Celine George
 
Key note speaker Neum_Admir Softic_ENG.pdf
Key note speaker Neum_Admir Softic_ENG.pdfKey note speaker Neum_Admir Softic_ENG.pdf
Key note speaker Neum_Admir Softic_ENG.pdfAdmir Softic
 
REMIFENTANIL: An Ultra short acting opioid.pptx
REMIFENTANIL: An Ultra short acting opioid.pptxREMIFENTANIL: An Ultra short acting opioid.pptx
REMIFENTANIL: An Ultra short acting opioid.pptxDr. Ravikiran H M Gowda
 
The basics of sentences session 3pptx.pptx
The basics of sentences session 3pptx.pptxThe basics of sentences session 3pptx.pptx
The basics of sentences session 3pptx.pptxheathfieldcps1
 
Food safety_Challenges food safety laboratories_.pdf
Food safety_Challenges food safety laboratories_.pdfFood safety_Challenges food safety laboratories_.pdf
Food safety_Challenges food safety laboratories_.pdfSherif Taha
 
Basic Civil Engineering first year Notes- Chapter 4 Building.pptx
Basic Civil Engineering first year Notes- Chapter 4 Building.pptxBasic Civil Engineering first year Notes- Chapter 4 Building.pptx
Basic Civil Engineering first year Notes- Chapter 4 Building.pptxDenish Jangid
 
Jamworks pilot and AI at Jisc (20/03/2024)
Jamworks pilot and AI at Jisc (20/03/2024)Jamworks pilot and AI at Jisc (20/03/2024)
Jamworks pilot and AI at Jisc (20/03/2024)Jisc
 
80 ĐỀ THI THỬ TUYỂN SINH TIẾNG ANH VÀO 10 SỞ GD – ĐT THÀNH PHỐ HỒ CHÍ MINH NĂ...
80 ĐỀ THI THỬ TUYỂN SINH TIẾNG ANH VÀO 10 SỞ GD – ĐT THÀNH PHỐ HỒ CHÍ MINH NĂ...80 ĐỀ THI THỬ TUYỂN SINH TIẾNG ANH VÀO 10 SỞ GD – ĐT THÀNH PHỐ HỒ CHÍ MINH NĂ...
80 ĐỀ THI THỬ TUYỂN SINH TIẾNG ANH VÀO 10 SỞ GD – ĐT THÀNH PHỐ HỒ CHÍ MINH NĂ...Nguyen Thanh Tu Collection
 
Jual Obat Aborsi Hongkong ( Asli No.1 ) 085657271886 Obat Penggugur Kandungan...
Jual Obat Aborsi Hongkong ( Asli No.1 ) 085657271886 Obat Penggugur Kandungan...Jual Obat Aborsi Hongkong ( Asli No.1 ) 085657271886 Obat Penggugur Kandungan...
Jual Obat Aborsi Hongkong ( Asli No.1 ) 085657271886 Obat Penggugur Kandungan...ZurliaSoop
 
Wellbeing inclusion and digital dystopias.pptx
Wellbeing inclusion and digital dystopias.pptxWellbeing inclusion and digital dystopias.pptx
Wellbeing inclusion and digital dystopias.pptxJisc
 
Application orientated numerical on hev.ppt
Application orientated numerical on hev.pptApplication orientated numerical on hev.ppt
Application orientated numerical on hev.pptRamjanShidvankar
 
Sociology 101 Demonstration of Learning Exhibit
Sociology 101 Demonstration of Learning ExhibitSociology 101 Demonstration of Learning Exhibit
Sociology 101 Demonstration of Learning Exhibitjbellavia9
 
ICT Role in 21st Century Education & its Challenges.pptx
ICT Role in 21st Century Education & its Challenges.pptxICT Role in 21st Century Education & its Challenges.pptx
ICT Role in 21st Century Education & its Challenges.pptxAreebaZafar22
 
Towards a code of practice for AI in AT.pptx
Towards a code of practice for AI in AT.pptxTowards a code of practice for AI in AT.pptx
Towards a code of practice for AI in AT.pptxJisc
 

Recently uploaded (20)

HMCS Max Bernays Pre-Deployment Brief (May 2024).pptx
HMCS Max Bernays Pre-Deployment Brief (May 2024).pptxHMCS Max Bernays Pre-Deployment Brief (May 2024).pptx
HMCS Max Bernays Pre-Deployment Brief (May 2024).pptx
 
Kodo Millet PPT made by Ghanshyam bairwa college of Agriculture kumher bhara...
Kodo Millet  PPT made by Ghanshyam bairwa college of Agriculture kumher bhara...Kodo Millet  PPT made by Ghanshyam bairwa college of Agriculture kumher bhara...
Kodo Millet PPT made by Ghanshyam bairwa college of Agriculture kumher bhara...
 
How to Create and Manage Wizard in Odoo 17
How to Create and Manage Wizard in Odoo 17How to Create and Manage Wizard in Odoo 17
How to Create and Manage Wizard in Odoo 17
 
This PowerPoint helps students to consider the concept of infinity.
This PowerPoint helps students to consider the concept of infinity.This PowerPoint helps students to consider the concept of infinity.
This PowerPoint helps students to consider the concept of infinity.
 
Understanding Accommodations and Modifications
Understanding  Accommodations and ModificationsUnderstanding  Accommodations and Modifications
Understanding Accommodations and Modifications
 
How to Give a Domain for a Field in Odoo 17
How to Give a Domain for a Field in Odoo 17How to Give a Domain for a Field in Odoo 17
How to Give a Domain for a Field in Odoo 17
 
Key note speaker Neum_Admir Softic_ENG.pdf
Key note speaker Neum_Admir Softic_ENG.pdfKey note speaker Neum_Admir Softic_ENG.pdf
Key note speaker Neum_Admir Softic_ENG.pdf
 
REMIFENTANIL: An Ultra short acting opioid.pptx
REMIFENTANIL: An Ultra short acting opioid.pptxREMIFENTANIL: An Ultra short acting opioid.pptx
REMIFENTANIL: An Ultra short acting opioid.pptx
 
The basics of sentences session 3pptx.pptx
The basics of sentences session 3pptx.pptxThe basics of sentences session 3pptx.pptx
The basics of sentences session 3pptx.pptx
 
Food safety_Challenges food safety laboratories_.pdf
Food safety_Challenges food safety laboratories_.pdfFood safety_Challenges food safety laboratories_.pdf
Food safety_Challenges food safety laboratories_.pdf
 
Basic Civil Engineering first year Notes- Chapter 4 Building.pptx
Basic Civil Engineering first year Notes- Chapter 4 Building.pptxBasic Civil Engineering first year Notes- Chapter 4 Building.pptx
Basic Civil Engineering first year Notes- Chapter 4 Building.pptx
 
Jamworks pilot and AI at Jisc (20/03/2024)
Jamworks pilot and AI at Jisc (20/03/2024)Jamworks pilot and AI at Jisc (20/03/2024)
Jamworks pilot and AI at Jisc (20/03/2024)
 
80 ĐỀ THI THỬ TUYỂN SINH TIẾNG ANH VÀO 10 SỞ GD – ĐT THÀNH PHỐ HỒ CHÍ MINH NĂ...
80 ĐỀ THI THỬ TUYỂN SINH TIẾNG ANH VÀO 10 SỞ GD – ĐT THÀNH PHỐ HỒ CHÍ MINH NĂ...80 ĐỀ THI THỬ TUYỂN SINH TIẾNG ANH VÀO 10 SỞ GD – ĐT THÀNH PHỐ HỒ CHÍ MINH NĂ...
80 ĐỀ THI THỬ TUYỂN SINH TIẾNG ANH VÀO 10 SỞ GD – ĐT THÀNH PHỐ HỒ CHÍ MINH NĂ...
 
Jual Obat Aborsi Hongkong ( Asli No.1 ) 085657271886 Obat Penggugur Kandungan...
Jual Obat Aborsi Hongkong ( Asli No.1 ) 085657271886 Obat Penggugur Kandungan...Jual Obat Aborsi Hongkong ( Asli No.1 ) 085657271886 Obat Penggugur Kandungan...
Jual Obat Aborsi Hongkong ( Asli No.1 ) 085657271886 Obat Penggugur Kandungan...
 
Wellbeing inclusion and digital dystopias.pptx
Wellbeing inclusion and digital dystopias.pptxWellbeing inclusion and digital dystopias.pptx
Wellbeing inclusion and digital dystopias.pptx
 
Application orientated numerical on hev.ppt
Application orientated numerical on hev.pptApplication orientated numerical on hev.ppt
Application orientated numerical on hev.ppt
 
Sociology 101 Demonstration of Learning Exhibit
Sociology 101 Demonstration of Learning ExhibitSociology 101 Demonstration of Learning Exhibit
Sociology 101 Demonstration of Learning Exhibit
 
Mehran University Newsletter Vol-X, Issue-I, 2024
Mehran University Newsletter Vol-X, Issue-I, 2024Mehran University Newsletter Vol-X, Issue-I, 2024
Mehran University Newsletter Vol-X, Issue-I, 2024
 
ICT Role in 21st Century Education & its Challenges.pptx
ICT Role in 21st Century Education & its Challenges.pptxICT Role in 21st Century Education & its Challenges.pptx
ICT Role in 21st Century Education & its Challenges.pptx
 
Towards a code of practice for AI in AT.pptx
Towards a code of practice for AI in AT.pptxTowards a code of practice for AI in AT.pptx
Towards a code of practice for AI in AT.pptx
 

Standard Deviation (Meaning, Characteristics and Calculation)

  • 1. Standard Deviation Dr Rajesh Verma Asst. Prof (Psychology) Govt. College Adampur, Hisar, HaryanaPC Mahalanobis, Indian Legend
  • 2. Meaning-Cum-Definition It’s a quantity that indicates by how much the members of a group differ from the mean value for the group. Standard deviation is and index of degree of dispersion and an estimate of the variability in the population from which the sample is drawn (Guilford & Fruchter, 1976).
  • 3. Introduction SD is also known as Coefficient of Variation (CV). It’s a kind of special average of all the deviation from the group mean. Special average means that SD is beyond the simple arithmetic mean. Along with the total range, semi- interquartile range, average deviation it is the most commonly used single number to indicate variability among a data set. Variability is the scatter or spread of the separate scores around their central tendency (Garret, 2014). SD is the most stable index of variability which is computed using squared deviations that are taken from mean only i.e. neither median nor mode.
  • 4. Characteristics (i) High value of SD means that most of the scores are away from group mean and vice versa. (ii) It is the index of spread of scores about the mean that involves every observation. (iii) Greater SD than mean indicates that the distribution have majority of low values. (iv) Lower SD than mean indicates that the distribution have majority of high values. (v) It can also indicate that whether the distribution has dispersion of extreme values or has central tendency.
  • 5. (vi) It is expressed in the same units as the data. (vii) It is possible to calculate the combined standard deviation of two or more groups. (viii) The SD is considered most appropriate statistical tool for comparing the variability of two or more groups. (ix) It is used as unit of measurement in normal probability distribution. (x) SD forms the base for several statistical techniques such skewness, kurtosis, ANOVA etc.
  • 6. How much SD is Good or Bad No amount of SD is good or bad because it’s just an indicator of spread of scores. If someone is interested to see the closeness of scores around the mean than SD ≤ 1 is good, on the other hand if someone is interested in larger spread than SD ≥ 1 is good. Across books and manuals it has been accepted that SD ≥ 1 is the indicator of high variation among the scores and SD ≤ 1 indicates low variation. It’s a kind of rule of thumb. In fact it depend upon the data set and objectives of the researcher.
  • 7. Computation of SD For Ungrouped Data Let us take an hypothetical data. Ex – 12, 54, 32, 51, 24, 58, 21, 43, 31, 48 Step I – Calculate the mean. Mean ( 𝒙) = ∑𝒙 𝑵 Where, x = Score N = total no. of score Therefore, 12+54+32+51+24 +58+21+43+31+48 = 374 𝒙 = 𝟑𝟕𝟒 𝟏𝟏 = 34
  • 8. Step II – Calculate deviation (d) of each score from the mean. (i) It is achieved by subtracting group mean from each score, (ii) Square the each Deviation, (iii) Sum up squared Deviations, Step III – Calculate SD by using the following formula σ = ∑𝒅 𝟐 𝑵 => 𝟐𝟑𝟐𝟕 𝟏𝟏 => 𝟐𝟏𝟏. 𝟓𝟒𝟓 = 14.545
  • 9. SD of Grouped Data Let us take Hypothetical Data as shown in adjacent table Step I - Calculate the mean For calculation of mean we must follow the following few steps
  • 10. Steps of calculating mean (i) Find the midpoints of CI (x) (ii) Multiply midpoints (x) with their respective frequency (f) (iii) Add fx (iv) Divide it by the sum of frequencies i.e. 50 mean = ∑𝒇 𝒙 𝑵 = 𝟏𝟔𝟓𝟎 𝟓𝟎 = 33
  • 11. Step II-Subtract mean from the mid points i.e. 𝒙 − 𝒙 Step III-Square these values which are denoted by (x`) Step IV-Multiply x` with their respective frequencies (fx`) Step V-Add fx` Finally substitute the values in the formula σ = ∑𝒇𝒙` 𝑵 = 𝟓𝟓𝟏𝟐 𝟓𝟎 = 𝟏𝟏𝟎. 𝟐𝟒 (𝒔 𝟐 = 110.24) = 10.499
  • 12. References: 1. https://dictionary.apa.org/quartile-deviation. 2. Guilford, J. P. and Fruchter, B. (1978). Fundamental Statistics in Psychology and Education, 6th ed. Tokyo: McGraw-Hill. 3. https://todayinsci.com/M/Mahalanobis_Prasanta/ MahalanobisPrasanta-Quotations.htm. 4. Garrett, H. E. (2014). Statistics in Psychology and Education. New Delhi: Pragon International. 5. Levin, J. & Fox, J. A. (2006). Elementary Statistics. New Delhi: Pearson.