1d analysis of co2 sub-cooled/supercritical ejector refrigeration cycle
1d analysis of co2 sub-cooled/supercritical ejector refrigeration cycle
1d analysis of co2 sub-cooled/supercritical ejector refrigeration cycle

Create successful ePaper yourself
Turn your PDF publications into a flip-book with our unique Google optimized e-Paper software.
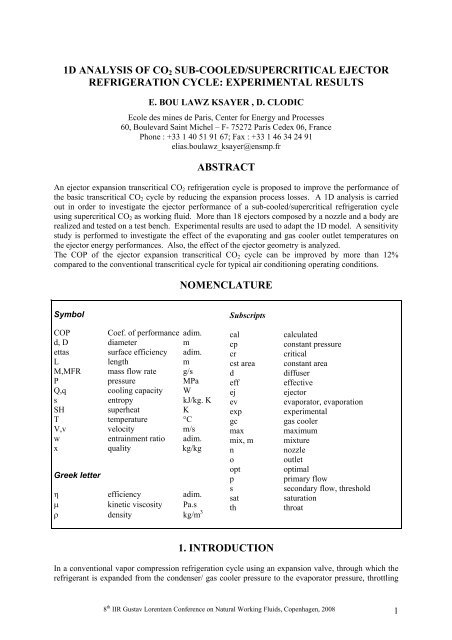
1D ANALYSIS OF CO 2 SUB-COOLED/SUPERCRITICAL EJECTOR<br />
REFRIGERATION CYCLE: EXPERIMENTAL RESULTS<br />
E. BOU LAWZ KSAYER , D. CLODIC<br />
Ecole des mines de Paris, Center for Energy and Processes<br />
60, Boulevard Saint Michel – F- 75272 Paris Cedex 06, France<br />
Phone : +33 1 40 51 91 67; Fax : +33 1 46 34 24 91<br />
elias.boulawz_ksayer@ensmp.fr<br />
ABSTRACT<br />
An <strong>ejector</strong> expansion transcritical CO 2 <strong>refrigeration</strong> <strong>cycle</strong> is proposed to improve the performance <strong>of</strong><br />
the basic transcritical CO 2 <strong>cycle</strong> by reducing the expansion process losses. A 1D <strong>analysis</strong> is carried<br />
out in order to investigate the <strong>ejector</strong> performance <strong>of</strong> a <strong>sub</strong>-<strong>cooled</strong>/<strong>supercritical</strong> <strong>refrigeration</strong> <strong>cycle</strong><br />
using <strong>supercritical</strong> CO 2 as working fluid. More than 18 <strong>ejector</strong>s composed by a nozzle and a body are<br />
realized and tested on a test bench. Experimental results are used to adapt the 1D model. A sensitivity<br />
study is performed to investigate the effect <strong>of</strong> the evaporating and gas cooler outlet temperatures on<br />
the <strong>ejector</strong> energy performances. Also, the effect <strong>of</strong> the <strong>ejector</strong> geometry is analyzed.<br />
The COP <strong>of</strong> the <strong>ejector</strong> expansion transcritical CO 2 <strong>cycle</strong> can be improved by more than 12%<br />
compared to the conventional transcritical <strong>cycle</strong> for typical air conditioning operating conditions.<br />
NOMENCLATURE<br />
Symbol<br />
Subscripts<br />
COP Coef. <strong>of</strong> performance adim. cal<br />
d, D diameter m cp<br />
ettas surface efficiency adim. cr<br />
L length m cst area<br />
M,MFR mass flow rate g/s d<br />
P pressure MPa eff<br />
Q,q cooling capacity W ej<br />
s entropy kJ/kg. K ev<br />
SH superheat K exp<br />
T temperature °C gc<br />
V,v velocity m/s max<br />
w entrainment ratio adim. mix, m<br />
x quality kg/kg n<br />
o<br />
opt<br />
Greek letter<br />
p<br />
s<br />
efficiency adim.<br />
sat<br />
kinetic viscosity Pa.s th<br />
density kg/m 3<br />
calculated<br />
constant pressure<br />
critical<br />
constant area<br />
diffuser<br />
effective<br />
<strong>ejector</strong><br />
evaporator, evaporation<br />
experimental<br />
gas cooler<br />
maximum<br />
mixture<br />
nozzle<br />
outlet<br />
optimal<br />
primary flow<br />
secondary flow, threshold<br />
saturation<br />
throat<br />
1. INTRODUCTION<br />
In a conventional vapor compression <strong>refrigeration</strong> <strong>cycle</strong> using an expansion valve, through which the<br />
refrigerant is expanded from the condenser/ gas cooler pressure to the evaporator pressure, throttling<br />
8 th IIR Gustav Lorentzen Conference on Natural Working Fluids, Copenhagen, 2008 1
losses are one <strong>of</strong> the highest thermodynamic losses. When the refrigerant pressure decreases, the<br />
current isenthalpic process dissipates the refrigerant kinetic energy as friction heat. The isenthalpic<br />
process generates a larger quantity <strong>of</strong> refrigerant vapor flash compared to isentropic process. As a<br />
result, the refrigerating capacity is reduced. In order to recover part <strong>of</strong> the potential kinetic energy <strong>of</strong><br />
the expansion process, various researchers have attempted to use other expanders rather than the<br />
expansion engine. An <strong>ejector</strong> constitutes an attractive alternative to the expansion valve <strong>of</strong><br />
<strong>refrigeration</strong> systems because <strong>of</strong> its low cost, its ability to handle two-phase flow without damage, and<br />
there is no moving parts [2,3,4,5,6].<br />
A 1D model <strong>of</strong> the CO 2 <strong>ejector</strong> has been developed to characterize the <strong>ejector</strong> operation. This<br />
document presents the validation <strong>of</strong> the 1D model and the description <strong>of</strong> the CO 2 <strong>ejector</strong> operation for<br />
different geometries, and different evaporating and gas cooler outlet temperatures.<br />
Models are validated generally referred to experimental results or by compared to validated models.<br />
For the <strong>ejector</strong> 1D model, a test bench has been designed to test <strong>ejector</strong>s, which have been sized using<br />
the 1D model. The main constraint that affects the test bench components is the CO 2 high pressure.<br />
The main objective <strong>of</strong> the test bench is the validation <strong>of</strong> the 1D model <strong>of</strong> <strong>sub</strong>-<strong>cooled</strong>/ <strong>supercritical</strong><br />
<strong>ejector</strong> <strong>cycle</strong>.<br />
To reduce the costs <strong>of</strong> the test bench and to<br />
obtain more accurate measured values, the<br />
heat exchangers are <strong>cooled</strong> by water. The test<br />
bench includes a <strong>cooled</strong> water loop and a CO 2<br />
<strong>refrigeration</strong> loop (Figure 1).<br />
The measured error is lower than 3%<br />
compared to the different calculated values.<br />
Taking in account the uncertainty span <strong>of</strong> the<br />
measurement instruments, the estimated error<br />
on the capacities is lower than 5%.<br />
2. TEST-BENCH COMPONENTS<br />
Figure 1: CO 2 <strong>refrigeration</strong> loop with <strong>ejector</strong>.<br />
3. EJECTOR TEST RESULTS AND 1D MODEL ADAPTATION<br />
The objectives <strong>of</strong> the tests are:<br />
- Adaptation <strong>of</strong> the 1D model <strong>of</strong> the <strong>ejector</strong>.<br />
- Characterization <strong>of</strong> the constant pressure chamber (CPC) length.<br />
- Characterization <strong>of</strong> the constant area chamber (CAC) diameter.<br />
A CFD study <strong>of</strong> vapor <strong>ejector</strong> has shown that the diffuser length should be larger than 9 D const area , and<br />
the CAC length should be larger than 3 D const area . Therefore, the realized <strong>ejector</strong> bodies have a CAC<br />
length varying between 6.3 and 8.6 D const area , and the lengths <strong>of</strong> the diffusers vary between 10.8 and<br />
40.7 D const area (Figure 2.a).<br />
4. TESTS<br />
54 different <strong>ejector</strong>s can be assembled based on the different parts realized for the tests:<br />
- 6 body cores (constant area diameter <strong>of</strong> 1.5, 2.0, 2.5, 3.0, 3.5, and 4.0 mm)<br />
- 3 nozzles (throat diameter <strong>of</strong> 0.75, 1.0, and 1.25 mm)<br />
- 3 disc thicknesses (8, 12, and 16 mm).<br />
18 assembled <strong>ejector</strong>s have been sufficient to adapt the 1D model and to characterize the non-tested<br />
<strong>ejector</strong>s. The test result interpretation is divided in two parts: nozzle characterization and <strong>ejector</strong> body<br />
characterization.<br />
8 th IIR Gustav Lorentzen Conference on Natural Working Fluids, Copenhagen, 2008 2
Cst Pressure chamber<br />
Cst area chamber<br />
Nozzle<br />
Body<br />
core<br />
Body<br />
a. Assembled <strong>ejector</strong> scheme. b. Assembled <strong>ejector</strong>.<br />
Figure 2: Ejector design.<br />
5. NOZZLE CHARACTERIZATION<br />
Three nozzles with different throat diameters (0.75, 1.0, and 1.25 mm) are tested with variable inlet<br />
parameters <strong>of</strong> temperature and pressure: 25 < T o,gc < 50 °C, and 6 < P o,gc < 12.5 MPa (Figure 3.a).<br />
Many authors described the CO 2 expansion flow through nozzles and fixed orifices [1,7], but<br />
experimental results <strong>of</strong> the nozzle show that the expansion efficiency in the nozzle convergent is close<br />
to one and so the expansion can be considered as isentropic. The flow passing through the nozzle<br />
at the throat is considered as the maximum flow, and phase change can occur in the nozzle<br />
convergent. At the throat, the flow quality varies from zero (saturated liquid) to one (saturated<br />
vapor).<br />
Figure 3.b shows that the relative error between the measured and calculated mass flow rates is lower<br />
than ±2%. The flow characteristics through a nozzle are as follows:<br />
- the expansion through our convergent nozzle is isentropic (efficiency = 1)<br />
- the flow is maximum at the nozzle throat<br />
- when the downstream pressure is higher than the calculated throat pressure, the throat pressure<br />
is the downstream pressure.<br />
T (K)<br />
340<br />
330<br />
320<br />
310<br />
300<br />
290<br />
280<br />
T sat liq T sat vap Inlet Throat max<br />
270<br />
0,8 1 1,2 1,4 1,6 1,8 2<br />
s (kj/kg K)<br />
MFR calculated (g/s)<br />
50<br />
45<br />
40<br />
35<br />
30<br />
25<br />
20<br />
15<br />
15 20 25 30 35 40 45 50<br />
MFR measured (g/s)<br />
b. Comparison <strong>of</strong> measured and calculated mass<br />
a. Position <strong>of</strong> test points in CO 2 T-s diagram.<br />
flow rates.<br />
Figure 3: Experimental results <strong>of</strong> the <strong>ejector</strong> nozzles.<br />
Figure 4.a presents the nozzle inlet pressure obtained when keeping constant the gas cooler outlet<br />
temperature while varying the high-side pressure P gc , 4.a, and according to the following assumptions:<br />
- saturated state at the throat for P sat ,<br />
- maximum mass flow rate for P max ,<br />
- isentropic expansion in the nozzle ( n = 1).<br />
8 th IIR Gustav Lorentzen Conference on Natural Working Fluids, Copenhagen, 2008 3
P (MPa)<br />
8<br />
7<br />
6<br />
5<br />
4<br />
3<br />
2<br />
1<br />
P sat P max T gc = 32°C<br />
P gc = 8.75 MPa<br />
0<br />
5 6 7 8 9 10 11 12 13 14 15 16<br />
P gc (MPa)<br />
mnozzle (g/s)<br />
90<br />
80<br />
70<br />
60<br />
50<br />
40<br />
30<br />
20<br />
10<br />
0<br />
6 7 8 9 10 11 12 13<br />
Pgc (MPa)<br />
b. Variation <strong>of</strong> nozzle mass flow rate with P<br />
a. T gc = 32 °C, P s = 8.75 MPa.<br />
gc for<br />
d th =1 mm.<br />
Figure 4: Variation <strong>of</strong> the saturated flow and the maximum flow throat pressure with P gc .<br />
To each T gc , corresponds a threshold gas cooler pressure P gc,s :<br />
- where the two assumptions are true: P gc P gc,s ; and<br />
- a P gc range in which only the maximum flow assumption is true: P gc < P gc,s .<br />
Figure 4.b shows that the mass flow rate <strong>of</strong> the nozzle increases with P gc and decreases with T gc .<br />
The new adapted nozzle assumptions will be used to characterize the <strong>ejector</strong> body operation.<br />
6. BODY CHARACTERIZATION<br />
According to the <strong>ejector</strong> 1D model, four parameters should be determined:<br />
- The nozzle divergent expansion efficiency: n .<br />
- The secondary flow expansion efficiency: s .<br />
- The mixture efficiency: m .<br />
- The diffuser efficiency: d .<br />
Assuming that n = s and fully developed flow in the CAC, the <strong>ejector</strong> outlet parameters: pressure<br />
and quality, are significantly lower than the measured ones. So, the following assumptions are made:<br />
- The nozzle and secondary flows are considered isentropic: n = s = 1.<br />
- The diffuser compression is isentropic: d = 1.<br />
- The two refrigerant flows go through an effective area in the CAC. This effective area is<br />
characterized by an effective surface efficiency, that will be called ettas and defined as:<br />
2<br />
effective area d<br />
area <br />
effective<br />
ettas <br />
(1)<br />
d<br />
constarea<br />
<br />
- The CPC (constant pressure chamber) pressure is calculated assuming that the maximum<br />
entrainment ratio, w, is sucked (Figure 6).<br />
- The mixture efficiency m is calculated to meet the measured <strong>ejector</strong> outlet pressure.<br />
Analyzing ettas and m values lead to the elaboration <strong>of</strong> empirical equations expressing these values<br />
as a function <strong>of</strong> the flow and <strong>ejector</strong> parameters:<br />
Re f ( , v , d , , x , , , P )<br />
(2)<br />
ettas<br />
th<br />
Re f ( , v , d , <br />
,<br />
, w)<br />
th<br />
th<br />
vap, th th sec sec in,<br />
sec<br />
m<br />
<br />
th th th vapth<br />
(3)<br />
ettas f (Re<br />
ettas<br />
, dcstarea<br />
, dth<br />
)<br />
(4)<br />
f (Re m<br />
)<br />
m<br />
(5)<br />
7. CPC LENGTH<br />
The effect <strong>of</strong> the CPC length has been investigated experimentally to define the optimal length.<br />
28<br />
30<br />
35<br />
40<br />
45<br />
50<br />
8 th IIR Gustav Lorentzen Conference on Natural Working Fluids, Copenhagen, 2008 4
m CO2 (g/s)<br />
35<br />
30<br />
25<br />
20<br />
15<br />
10<br />
5<br />
m max = 32.22 g/s<br />
P th,max = 5.97 MPa<br />
0<br />
0 2 4 6 8 10<br />
P th (MPa)<br />
Figure 5: Variation <strong>of</strong> CO 2 mass flow rate with the<br />
throat pressure for P gc = 8.5 MPa and T gc = 35 °C.<br />
w<br />
0.25<br />
0.2<br />
0.15<br />
0.1<br />
0.05<br />
w max = 0.2226<br />
P ch,max = 2.87 MPa<br />
0<br />
0 1 2 3 4<br />
P chamber (MPa)<br />
Figure 6: Variation <strong>of</strong> CO 2 mass flow rate with the<br />
CPC pressure for P gc = 8.5 MPa, T gc = 35 °C,<br />
ettas = 1, T oev = 7 °C and P o,ev = 3.673 MPa.<br />
Three different lengths L cp <strong>of</strong> the CPC are analyzed for three different nozzle diameters (0.75 mm,<br />
1 mm, and 1.25 mm).<br />
The comparison <strong>of</strong> ettas and m for different nozzle throat diameters, presented in Figure 7, show that<br />
these two parameters were not affected by L cp . Therefore, the experimental results prove that the<br />
tested CPC length L cp does not affect the <strong>ejector</strong> performance for values ranging from 1.8 to 5 d cst area<br />
on one side, and from 3.6 to 16.6 d th .<br />
ettas<br />
8 mm 12 mm 16 mm<br />
0.8<br />
0.7<br />
0.6<br />
0.5<br />
0.4<br />
0.3<br />
0.2<br />
0.1<br />
0<br />
0 0.5 1 1.5 2 2.5<br />
Re d<br />
ettas<br />
th = 1mm<br />
m<br />
8 mm 12 mm 16 mm<br />
0.85<br />
0.8<br />
0.75<br />
0.7<br />
0.65<br />
0.6<br />
0.55<br />
0.5<br />
0.6 0.7 0.8 0.9 1<br />
Re m<br />
dth = 1 mm<br />
a. ettas for d th = 1.0 mm b. m for d th = 1.0 mm<br />
Figure 7: Variation <strong>of</strong> ettas and m with L cp for different throat diameters.<br />
8. EXPERIMENTAL RESULT RELIABILITY<br />
For experimental tests, the gas cooler pressure is varied from 6 to 12.5 MPa and the gas cooler outlet<br />
temperature from 26 to 45 °C to analyze the <strong>sub</strong>critical and the <strong>supercritical</strong> operation modes <strong>of</strong> the<br />
<strong>ejector</strong>.<br />
The differences between the measured and the calculated values vary from ± 5 to ± 15%.<br />
For the <strong>ejector</strong> with nozzle throat diameter d th = 1 mm, the differences between measured and<br />
calculated values <strong>of</strong> ettas are lower than 10 % and lower than 5% for m , (Figures 8.b and 8.d). Four<br />
different constant area diameters are studied: 2, 2.5, 3, and 3.5 mm.<br />
The increase <strong>of</strong> d cst area decreases the area efficiency ettas.<br />
ettas<br />
ettas ettas cal<br />
1<br />
0.9<br />
0.8<br />
0.7<br />
0.6<br />
0.5<br />
0.4<br />
0.3<br />
0.2<br />
0.1<br />
0<br />
0 0.5 1 1.5 2 2.5<br />
Re ettas<br />
a. Variation <strong>of</strong> ettas with Re ettas for different d cst area<br />
2, 2.5, 3, and 3.5 mm.<br />
Calculated<br />
1<br />
0.9<br />
0.8<br />
0.7<br />
0.6<br />
0.5<br />
0.4<br />
0.3<br />
0.2<br />
0.1<br />
0<br />
+ 10%<br />
0 0.2 0.4 0.6 0.8 1<br />
Experimental<br />
- 10%<br />
b. Differences between the calculated and the<br />
measured ettas.<br />
8 th IIR Gustav Lorentzen Conference on Natural Working Fluids, Copenhagen, 2008 5
m<br />
0.9<br />
0.85<br />
0.8<br />
0.75<br />
0.7<br />
0.65<br />
0.6<br />
h m<br />
h m cal<br />
0.6 0.65 0.7 0.75 0.8 0.85 0.9 0.95<br />
Re m<br />
Calculated<br />
0.9<br />
0.85<br />
0.8<br />
0.75<br />
0.7<br />
0.65<br />
+ 5%<br />
- 5%<br />
0.6<br />
0.6 0.65 0.7 0.75 0.8 0.85 0.9<br />
Experimental<br />
c. Variation <strong>of</strong> m with Re m for different d cst area : d. Differences between the calculated and the<br />
2, 2.5, 3 and 3.5 mm.<br />
measured m .<br />
Figure 8: Reliability <strong>of</strong> ettas and m for d th = 1.0 mm.<br />
9. EFFECT OF d cst area<br />
The 1D model is adapted by including ettas and m . These efficiencies are expressed as a function <strong>of</strong><br />
the <strong>ejector</strong> geometrical parameters: d cst area and d th , and the flow thermodynamic parameters.<br />
For T ev = 2 °C, and T gc = 35 °C, the variation <strong>of</strong> the constant area diameter shows the existence <strong>of</strong> a<br />
critical diameter d cr (Figure 9):<br />
- when d cst area < d cr , the surface efficiency ettas is 1, and the <strong>ejector</strong> does not operate correctly.<br />
- when d cst area > d cr , the <strong>ejector</strong> operates with constant performances.<br />
%COP<br />
10%<br />
5%<br />
0%<br />
-5%<br />
-10%<br />
-15%<br />
-20%<br />
-25%<br />
0 1 2 3 4<br />
d const area (mm)<br />
Figure 9: Variation <strong>of</strong> COP improvement with<br />
d cst area for T ev = 2 °C, T gc = 35 °C, SH = 5 K.<br />
d eff (mm)<br />
2<br />
1.9<br />
1.8<br />
1.7<br />
1.6<br />
1.5<br />
1.4<br />
1.3<br />
1.2<br />
1.1<br />
1<br />
25 30 35 40 45<br />
T gc (°C)<br />
Figure 10: Variation <strong>of</strong> d eff with T gc for<br />
T ev = 2 °C, SH = 5 K.<br />
For T ev = 2 °C, the effective critical diameter is drawn as a function <strong>of</strong> T gc , (Figure 10). The effective<br />
critical diameter decreases with the increase <strong>of</strong> T gc .<br />
Consequently, due to the high velocity <strong>of</strong> the primary flow and the entrained secondary flow, the flow<br />
is flowing at the center <strong>of</strong> the CAC, surrounded by a dead zone in which the velocity is equal to the<br />
wall velocity, Figure 11. In the dead zone, a closed circulation loop can occur without affecting the<br />
flows.<br />
Figure 11: Ejector effective flow.<br />
10. VARIATION Of T gc And T ev<br />
Considering the <strong>ejector</strong> composed <strong>of</strong> a nozzle <strong>of</strong> 1-mm throat diameter, the <strong>ejector</strong> performance is<br />
studied as a function <strong>of</strong> the evaporating temperature, the gas cooler outlet temperature, and the<br />
evaporator outlet superheat.<br />
The effect <strong>of</strong> the gas cooler outlet temperature on the COP, the evaporating capacity, the effective<br />
diameter, and the gas cooler outlet pressure <strong>of</strong> the <strong>ejector</strong> transcritical CO 2 <strong>cycle</strong> are shown in Figure<br />
12. It can be seen that the gas cooler pressure increases with the gas cooler outlet temperature T gc , but<br />
8 th IIR Gustav Lorentzen Conference on Natural Working Fluids, Copenhagen, 2008 6
the evaporating capacity and the effective diameter d eff decrease with T gc . The COP improvement<br />
presents an optimum value for a defined T gc and T ev . The optimal T gc increases with the increase <strong>of</strong><br />
T ev . For T ev = 2 °C, the COP is improved when T gc varies between 27 and 37 °C. The maximal<br />
improvement is 10% at T gc = 30 °C.<br />
The effect <strong>of</strong> the evaporation temperature on the COP improvement, the evaporator capacity, the<br />
effective diameter, and the gas cooler outlet pressure <strong>of</strong> the <strong>ejector</strong> transcritical CO 2 <strong>cycle</strong> are shown<br />
in Figure 12.<br />
P gc (MPa)<br />
10 5 2 -1<br />
12<br />
11<br />
10<br />
9<br />
8<br />
7<br />
6<br />
25 30 35 40 45<br />
T gc (°C)<br />
Q ev (W)<br />
10000<br />
9000<br />
8000<br />
7000<br />
6000<br />
5000<br />
4000<br />
3000<br />
2000<br />
1000<br />
0<br />
10 5 2 -1<br />
25 30 35 40 45<br />
T gc (°C)<br />
a. Gas cooler outlet pressure. b. Evaporator capacity.<br />
3<br />
10 5 2 -1<br />
20%<br />
10 5 2 -1<br />
2.5<br />
10%<br />
d eff (mm)<br />
2<br />
1.5<br />
1<br />
%COP<br />
0%<br />
-10%<br />
-20%<br />
-30%<br />
0.5<br />
-40%<br />
0<br />
25 30 35 40 45<br />
T gc (°C)<br />
-50%<br />
25 30 35 40 45<br />
T gc (°C)<br />
c. Effective diameter. d. COP improvement.<br />
Figure 12: Variation <strong>of</strong> <strong>ejector</strong> parameters with the gas cooler outlet temperature T gc for different<br />
evaporation temperatures, SH = 5 K.<br />
It can be seen that the gas cooler pressure increases with the evaporation temperature T ev . Also the<br />
evaporating capacity and the effective diameter d eff increase with T gc . The COP improvement presents<br />
an optimum value for defined T ev and T gc . The optimal T ev increases with the increase <strong>of</strong> T gc . For T gc<br />
= 35 °C, the COP is improved for T ev varying from 0 to 8 °C, with maximal improvement <strong>of</strong> 10%<br />
around T ev = 4 °C.<br />
The CO 2 <strong>ejector</strong> <strong>refrigeration</strong> <strong>cycle</strong> operates in steady state and so is the mass balance. By varying the<br />
evaporation temperature T ev between –10 and 10 °C, and the gas cooler outlet temperature T gc between<br />
26 and 45 °C, and considering a superheat <strong>of</strong> 5 K, the gas cooler operating pressure is calculated using<br />
the 1D model and a correlation is elaborated to express P gc as a function <strong>of</strong> T ev and T gc .<br />
The error between the model values and the correlation is lower than 3%. The correlation is used as<br />
reference value to control the high-side pressure <strong>of</strong> the <strong>ejector</strong> <strong>refrigeration</strong> system.<br />
P gc = a + b T gc + c T ev + d T ev 2 +e T ev 3 (6)<br />
a b c d e<br />
3.70416 0.1245456 0.076715 0.01052402 0.000752<br />
11. CONCLUSION<br />
For the <strong>ejector</strong> <strong>refrigeration</strong> system, 18 <strong>ejector</strong>s have been tested. The experimental results were used<br />
to characterize the <strong>ejector</strong> operation: nozzle and body.<br />
For the tested nozzle, the expansion through the convergent nozzle has been found to be isentropic.<br />
Also it has been proven that the maximum flow passes through the orifice separating two chambers at<br />
8 th IIR Gustav Lorentzen Conference on Natural Working Fluids, Copenhagen, 2008 7
different pressures: the upstream pressure is higher than the saturation pressure and, downstream the<br />
throat, CO 2 is in two-phase flow.<br />
P gc (MPa)<br />
d eff (mm)<br />
12<br />
11<br />
10<br />
9<br />
8<br />
7<br />
28 30 35 40<br />
6<br />
-15 -10 -5 0 5 10 15<br />
3<br />
2.5<br />
2<br />
1.5<br />
1<br />
0.5<br />
T ev (°C)<br />
Q ev (W)<br />
28 30 35 40<br />
10000<br />
9000<br />
8000<br />
7000<br />
6000<br />
5000<br />
4000<br />
3000<br />
2000<br />
1000<br />
0<br />
-15 -10 -5 0 5 10 15<br />
T ev (°C)<br />
a. Gas cooler outlet pressure. b. Evaporator capacity.<br />
28 30 35 40<br />
0<br />
-15 -10 -5 0 5 10 15<br />
T ev (°C)<br />
%COP<br />
28 30 35 40<br />
20%<br />
10%<br />
0%<br />
-10%<br />
-20%<br />
-30%<br />
-40%<br />
-50%<br />
-60%<br />
-70%<br />
-15 -10 -5 0 5 10 15<br />
c. Effective diameter. d. Cop improvement.<br />
Figure 13: Variation <strong>of</strong> <strong>ejector</strong> parameters with the evaporation temperature T ev for different gas<br />
cooler outlet temperatures, SH = 5 K.<br />
For the tested bodies, it has been found that:<br />
- The CPC length does not affect the <strong>ejector</strong> performance.<br />
- The 1D model <strong>of</strong> the <strong>ejector</strong> has been adapted by introducing a surface efficiency ettas and a<br />
mixing efficiency m . These efficiencies are expressed as functions <strong>of</strong> the flow and the <strong>ejector</strong><br />
parameters.<br />
- There is a critical constant area diameter above which the <strong>ejector</strong> performance is constant. For<br />
constant area diameter lower than the critical diameter, the <strong>ejector</strong> performance will be<br />
hampered.<br />
A parametric study <strong>of</strong> the <strong>ejector</strong> <strong>refrigeration</strong> system has been performed as a function <strong>of</strong> the<br />
evaporating temperature, the gas cooler outlet temperature, and the evaporator outlet superheat. The<br />
COP improvement <strong>of</strong> the <strong>ejector</strong> <strong>refrigeration</strong> system is about 12% for T gc = 30 °C, T ev = 2 °C and<br />
SH = 5 K.<br />
REFERENCES<br />
[1]. J.P. Chen , J.P. Liu, Z.J. Chen, Y.M. Niu: “Trans-critical R744 and two-phase flow through short<br />
tube orifices”, International Journal <strong>of</strong> Thermal Sciences 43 (2004) 623–630.<br />
[2]. Somchai Wongwises, Somjin Disawas: Performance <strong>of</strong> the two-phase <strong>ejector</strong> expansion<br />
<strong>refrigeration</strong> <strong>cycle</strong>”, International Journal <strong>of</strong> Heat and Mass Transfer 48 (2005) 4282–4286.<br />
[3]. Da-Wen Sun: “Comparative study <strong>of</strong> the performance <strong>of</strong> an <strong>ejector</strong> <strong>refrigeration</strong> <strong>cycle</strong> operating<br />
with various refrigerants”, Energy Conversion & Management 40 (1999) 873 – 884.<br />
[4]. Daqing Li, Eckhard A. Groll. "Transcritical CO2 <strong>refrigeration</strong> <strong>cycle</strong> with <strong>ejector</strong>-expansion<br />
device". International Journal <strong>of</strong> Refrigeration 28 (2005) 766–773.<br />
[5]. Somjin Disawas, Somchai Wongwises. "Experimental investigation on the performance <strong>of</strong> the<br />
<strong>refrigeration</strong> <strong>cycle</strong> using a two-phase <strong>ejector</strong> as an expansion device". International Journal <strong>of</strong><br />
Refrigeration 27 (2004) 587–594.<br />
[6]. J.M. Chang, B.J. Huang : "Empirical correlation for <strong>ejector</strong> design”, International Journal <strong>of</strong><br />
Refrigeration 22 (1999) 379–388.<br />
[7]. K. Martin, R. Rieberer, J. Hager : "Modelling <strong>of</strong> Short Tube Orifices for CO 2 ”, R111,<br />
International Refrigeration and Air Conditioning Conference at Purdue, July 17-20, 2006.<br />
T ev (°C)<br />
8 th IIR Gustav Lorentzen Conference on Natural Working Fluids, Copenhagen, 2008 8