
Phylogenetic Reconstruction
Phylogeny: The history of descent from a group of taxa such as species from their common ancestors, including the order of branching and sometimes absolute ages of divergence; also applied to the genealogy of genes derived from a common ancestral gene.
-- Futuyma 1998


"Rooted" trees make a statement about the passage of time.
Nodes near the bottom of a rooted tree represent older divergences between two lineages.
Nodes near the top of the tree represent recent divergences between two closely related lineages.
The root of a tree is often determined by an "outgroup".
An outgroup is presumed to be outside of the group of interest (i.e., it diverged prior to the taxa in a phylogenetic analysis).
An unrooted tree makes no claim about which of the divergences is oldest.
Phylogenetic trees sometimes do and sometimes do not correspond to the Linnean classification system.

For instance, mammals make a good phylogenetic group (or clade), because all mammals are more closely related to each other than they are to any other taxon.
 Monophyletic group
Conversely, reptiles do not represent all the descendants of their common ancestor. Birds and mammals are also descended from the common ancestor of all reptiles (living and extinct). This means that some reptiles (e.g. crocodiles) may be more closely related to a non-reptile (e.g. birds) than they are to other reptiles.
Paraphyletic group
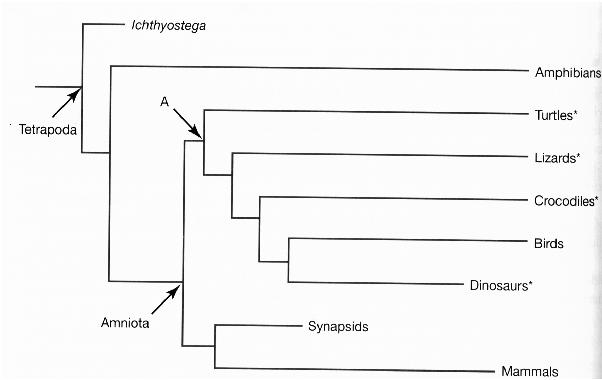
(From Freeman and Herron 1998)
Finally, some systematic groupings are completely artificial and based only on superficial resemblance and convergent evolution rather than true relatedness. For example, Linnaeus grouped together several unrelated worms into the artificial group "Vermes".
Polyphyletic group
Should the classification scheme we use be based purely on monophyletic groups?
Phylogenetic trees may be based on many different forms of data: morphological, physiological, biochemical, molecular.
For any type of character, there are four attributes that are key to a successful phylogenetic analysis:
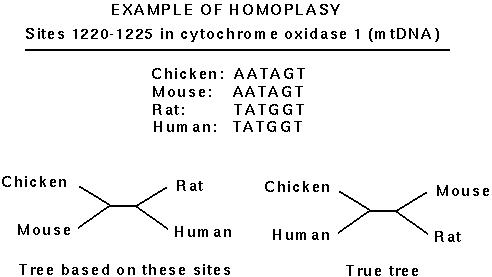
Homoplasy: Similarity in the characters found in different species that is due to convergent evolution, parallelism, or reversal -- not common descent.
-- Freeman and Herron 1998
We are going to focus on reconstructing phylogenies from molecular data, specifically from DNA sequences.
Attributes of molecular data:
The main problem with using molecular data is that there is a high risk of homoplasy.
That is, if two sequences both have an adenine at a particular site, we do not know if this is because both descended from a common ancestor that had an adenine or because adenine happened to arise independently in both lineages.
The risk of homoplasy is greatest if the DNA sequence evolves rapidly relative to the species divergences being examined.
There are several different criteria and algorithms used to reconstruct phylogenetic trees.
We'll focus on the conceptual criteria used in three different methods:
1. Parsimony analysis
"The principle of this method is to infer the amino acid or nucleotide sequences of the ancestral species and choose a tree that requires the minimum number of mutational changes".-- Nei (1987)
Parsimony's guiding principle is Occam's razor, the philosophical principle that it is preferable to choose the simplest of alternative explanations.
In practise, this means determining the tree (or trees) that require the fewest number of mutations in order to explain the data that you have.

With multiple characters, the minimum number of mutations required to explain the observed data must be determined for each possible tree.
Part A: Determining ancestral states
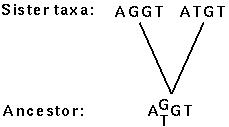
(1) Pick a pair of sister taxa.
(2) Write an inferred sequence for the most recent common ancestor of these two taxa at the node connecting them. Site by site, determine:
(3) Now ignore the original sister taxa, and treat their ancestral node as a new taxon.
(4) Repeat steps (1)-(3), with the following additional instruction for step (2). When comparing sites that have stacks of possible basepairs:
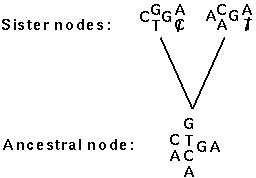
(5) Once all ancestral nodes have been determined, resolve any remaining stacks, being careful to choose the same basepair at a site on both sides of a branch whenever possible.
NOTE: There are often several different possible sets of ancestral states that would give the same minimum number of mutations.
Part B: Counting the minimum number of mutations
(1) Along each branch, make a mark for each difference between the two sequences at either end of the branch.
(2) Count the total number of marks on the tree.
(See Figure 17.13 in Ridley.)
For the following data set, which tree is most parsimonious?


Interestingly, parsimony can fail as a method, because evolution may have taken more steps than absolutely necessary bewteen the ancestral sequence and the present-day sequences.

Advantages of Parsimony Analysis
Disdvantages of Parsimony Analysis
2. Distance analyses
Species comparisons are often presented as distances between each pair of species (e.g. the number of sequence differences).
Sometimes only distance data are available, such as the strength of DNA-DNA hybridization.
Distance methods choose a tree on the basis of how well it coincides with the observed distances between every pair of species.
For any particular tree, the expected distance between two taxa can be found by summing the branch lengths separating the two taxa:

For example, the expected distance between species 1 and species 3 is d13 = b1 + b3 + b5.
Distance methods attempt to minimize the discrepancy between the observed distances (Dij) and the expected distances (dij), e.g. by minimizing:
 wij (Dij - dij)2,
where wij is a weighting term that can be used, for example, to diminish the importance of distantly related taxa.
A particularly common distance method is neighbor-joining.
Neighbor-joining is an algorithm, meaning that one follows a recipe to get the tree rather than figuring out how to mimimize functions like the one above.
Neighbor-joining: Starting from a star-like tree, the two closest taxa are placed together as neighbors. [Aside: The distances are first corrected to take into account potential differences in rates between the taxa.]
These two taxa are then represented by their common ancestral node and removed from the analysis.
The procedure is repeated until the full tree is resolved.

Advantages of Distance Analysis
Disdvantages of Distance Analysis
3. Maximum likelihood analysis
In a maximum likelihood analysis, a specific model is used to determine the probability that a given base substitution will occur along a given branch on a tree.
The maximum likelihood tree is the one that can generate the observed data with the highest probability.
For any one site, the likelihood of observing the data given a particular tree and a particular model of sequence evolution is calculated:

The likelihood for the whole sequence is then calculated as the product of the likelihoods for each site.
Advantages of Maximum Likelihood Analysis
Disdvantages of Maximum Likelihood Analysis
Frequently, many trees are optimal or near optimal on the basis of a criterion. Generating a "best" tree does not say how much better it is than other trees.
One of the most common methods used to evaluate the support in the data for the phylogenetic relationships shown on a tree is the bootstrap resampling procedure.
The bootstrap technique involves generating artificial sequences by randomly sampling sites from the original sequences with replacement.
This randomly generated data set has the same sequence length but a slightly different composition (i.e some sites will be oversampled and others not).
For example, consider a simple sequence with 6 sites.
Say that the first site chosen randomly is 3. For each species, site 3 is placed in the first position of the bootstrap sequence.
This is repeated until the bootstrap sequence is also 6 bp long.

The "best" tree is then determined from the bootstrap sequences, using the same method as used with the original data set.
This whole process is repeated at least 100 times.
The number of times that a clade is seen among the bootstrap trees is reported.
The more often a clade is present among the bootstrap trees, the more strongly the data support that clade, because the result is insensitive to which basepairs happen to be sampled.
EXAMPLE:
Cummings et al (1995) used the entire mitochondrial genomes of ten vertebrates and obtained the following tree using parsimony (P), neighbor joining (NJ), and maximum likelihood (ML) methods:

All clades were supported in 1000/1000 bootstrap data sets, with the exception of the two clades shown, which still had strong support.
We have focused on the criteria used to build trees.
The criteria have been refined to take into account several other factors including:
In practise, efficient algorithms have to be used in order to evaluate all the possible arrangements of taxa on trees.
Several computer programs are available that implement these phylogenetic methods (the commonly used, general-purpose programs are Phylip, PAUP, and MEGA).
For more information, check out this web-site of phylogenetic resources.
SOURCES:
 Back to Biology 336 home page.