File:Kennfeld Wasserturbinen.svg

From Wikimedia Commons, the free media repository
Jump to navigation Jump to search

Original file(SVG file, nominally 480 × 370 pixels, file size: 72 KB)

Captions

Captions

Add a one-line explanation of what this file represents

Summary[edit]

Description
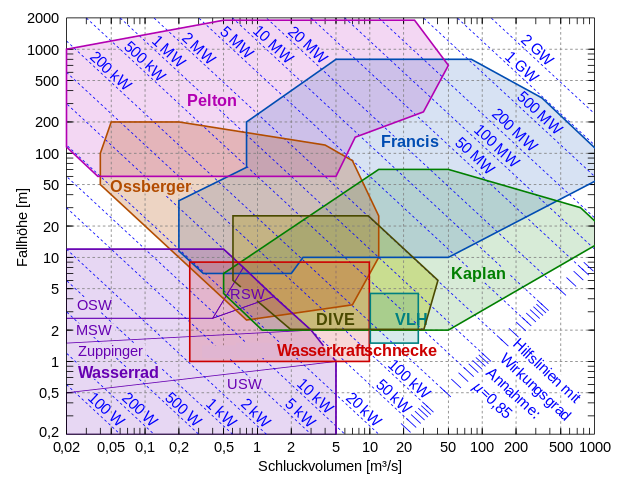
Deutsch: Kennfeld von Wasserturbinen. Enthalten sind:
 
Ossberger-Turbine auch Durchströmturbine oder Querstromturbine
 
DIVE-Turbine
 
VLH-Turbine ("Very-Low-Head" eine Kaplan-Variante)
 
Wasserrad mit der Unterteilung:
  1. OSW: Oberschlächtiges Wasserrad
  2. RSW: Rückschlächtiges Wasserrad
  3. MSW: Mittelschlächtiges Wasserrad
  4. Zuppinger: Zuppinger-Rad + Kropfrad + Poncelet-Rad
  5. USW: Unterschlächtiges Wasserrad
Date
Source

Own work
Data Sources:
Sourcing data is difficult. Most charts (even those in general literature) ultimately come from turbine suppliers and producers. The suppliers tend to mark the areas of their products. So it is never a representation of all turbines just a representation of turbines on offer. To overcome this severals charts are combined.

Author Jahobr
Other versions
Rusyn
SVG development
InfoField
 
The SVG code is valid.
 
This diagram was created with MATLAB by Jahobr.
Source code
InfoField

MATLAB code

many code lines
source code for plotting a water turbine chart
%
% The code generates only a basic image, to get the logarithmic scale right.
% The final work has to be done in inkscape.
% by Jahobr 2017-01-10

%%  Definitions

fontToUse = 'Helvetica';
set(0, 'defaultAxesFontName', fontToUse)
set(0, 'defaultTextFontName', fontToUse)

foSizeToUse = 10;
set(0, 'DefaultTextFontSize', foSizeToUse);
set(0, 'DefaultAxesFontSize', foSizeToUse);

flowRange   = [0.02 1000]; % x
XTickValues = [0.02 0.05 0.1 0.2 0.5 1 2 5 10 20 50 100 200 500 1000];
heightRange = [0.2 2000]; % y
YTickValues = [0.2 0.5 1 2 5 10 20 50 100 200 500 1000 2000];

%% ##################### Data #########################

%% Pelton Turbine
dat = struct;
dat.Pelton.name = 'Pelton'; 
%             flow  height
PelDubble =  [0.5   110 % Source Voith / Dubbel
              30    250
              50    700
              30    1000
              5     1900
              0.5   1900];
PelBieudron = [5    1900 % connect in with Dubble Area
               5    700  % connect in with Dubble Area
              50    700  % connect in with Dubble Area
              25    1900]; % 2010 Record [[:w:Bieudron_Hydroelectric_Power_Station|Bieudron_Hydroelectric_Power_Station]]
PelAndritz = [0.038 60   % Source Andritz
              5     60
              12    300
              3.5   1000
              0.02  1000
              0.02  115];
[MergeX,MergeY] = polybool('union', PelDubble(:,1), PelDubble(:,2),...
    PelBieudron(:,1), PelBieudron(:,2));
[MergeX,MergeY] = polybool('union', MergeX, MergeY,...
    PelAndritz(:,1), PelAndritz(:,2));
dat.Pelton.patch = [MergeX MergeY];   
dat.Pelton.color = [0.7 0 0.7]; 
dat.Pelton.style = 'full';

%% Kaplan Turbine
dat.Kaplan.name = 'Kaplan';
%             flow    height
KapDubbel =  [1.5     2 % Source Voith / Dubbel
              50      2
              1400    16
              750     30
              50      70 % top
              12      70 % top
              1       12
              1       3];
KapAndritz = [1.1     2 % Source Andritz
              40      2
              40      4
              10.8    30
              4       30
              0.5     7
              0.5     4.5];
                  
[MergeX,MergeY] = polybool('union', KapDubbel(:,1), KapDubbel(:,2),...
    KapAndritz(:,1), KapAndritz(:,2));
dat.Kaplan.patch = [MergeX MergeY];
dat.Kaplan.color = [0 0.5 0]; 
dat.Kaplan.style = 'full';

%% Francis Turbine
dat.Francis.name = 'Francis'; 
%             flow   height
FraDubbel =  [0.8    10 % Source Voith / Dubbel
              50     10
              1600   70
              340    340
              80     800
              5      800
              0.8    200];
FraAndritz = [0.33   7 % Source Andritz
              2      7
              8      40
              7      150
              2      150
              0.2    35
              0.2    11.5];
[MergeX,MergeY] = polybool('union', FraDubbel(:,1), FraDubbel(:,2),...
    FraAndritz(:,1), FraAndritz(:,2));
dat.Francis.patch = [MergeX MergeY];
dat.Francis.color = [0 0.3 0.7]; 
dat.Francis.style = 'full';

%% Cross-flow or Ossberger   
dat.Ossberger.name = 'Ossberger';
%                       flow  height
dat.Ossberger.patch =  [0.8   2.5  % source http://www.ossberger.de/cms/fileadmin/user_upload/1-1-02.pdf
                        7     3.5
                        12    10   % right
                        12    25   % right
                        7     85
                        4     120
                        0.2   200  % top
                        0.05  200  % top
                        0.04  100  % left
                        0.04  50]; % left
dat.Ossberger.color = [0.7 0.3 0];
dat.Ossberger.style = 'full';

%% OSW
dat.Wasserrad.name = 'Wasserrad';
%                      flow          height
dat.Wasserrad.patch = [flowRange(1)  heightRange(1) % left bottom
                       5             heightRange(1) % right bottom
                       5             1              % right
                       3             2    % corner zuppinger
                       1.4           4.2  % RSW/MWS
                       0.75          8    % OSW/RWS
                       0.5           12   % top
                       flowRange(1)  12]; % top
dat.Wasserrad.color = [0.4 0 0.7]; 
dat.Wasserrad.style = 'full'; % 'subsection' 

dat.OSW.name = 'OSW';
%                 flow           height
dat.OSW.patch =  [flowRange(1)   2.6 % left bottom
                  0.4            2.6
                  0.75           8
                  0.5            12
                  flowRange(1)   12];
dat.OSW.color = [0.4 0 0.7]; 
dat.OSW.style = 'subsection'; % 'full' 

%% RSW
dat.RSW.name = 'RSW'; %  rückenschlächtig
%                flow           height
dat.RSW.patch = [0.4            2.6 % left
                 1.4            4.2 % right
                 0.75           8]; % top
dat.RSW.color = [0.4 0 0.7]; 
dat.RSW.style = 'subsection'; % 'full' 

%% MSW
dat.MSW.name = 'MSW'; % mittelschlächtig
%                flow           height
dat.MSW.patch = [flowRange(1)   1.5
                 3              2
                 1.4            4.2
                 0.4            2.6
                 flowRange(1)   2.6];
dat.MSW.color = [0.4 0 0.7]; 
dat.MSW.style = 'subsection'; % 'full' 

%% Zulppinger
dat.Zulppinger.name = 'Zuppinger'; % Zuppinger +  Kropfrad + Poncelet-Rad
%                       flow           height
dat.Zulppinger.patch = [flowRange(1)   0.5
                        5              1
                        3              2
                        flowRange(1)   1.5];
dat.Zulppinger.color = [0.4 0 0.7]; 
dat.Zulppinger.style = 'subsection'; % 'full' 

%% USW
dat.USW.name = 'USW'; % unterschlächtig
%                flow          height
dat.USW.patch = [flowRange(1)  heightRange(1)
                 5             heightRange(1)
                 5             1
                 flowRange(1)  0.5];
dat.USW.color = [0.4 0 0.7]; 
dat.USW.style = 'subsection'; % 'full' 


%% Archimedes Screw
dat.Screw.name = 'Wasserkraftschnecke'; 
%                  flow    height
dat.Screw.patch =  [0.25   1   % left bottom
                    10     1   % right bottom
                    10     9   % right top  
                    0.25   9]; % left top
dat.Screw.color = [0.8 0 0]; 
dat.Screw.style = 'full'; % 'subsection' 

%% VLH Kaplan 
dat.VLH.name = 'VLH';
%                 flow  height
dat.VLH.patch =  [10    1.5   % left bottom %   % http://www.vlh-turbine.com/gamma
                  10    4.5   % right bottom
                  27    4.5   % right top  
                  27    1.5]; % left top  
dat.VLH.color = [0.0 0.5 0.5];
dat.VLH.style = 'full';

%% DIVE-Turbine
dat.DIVE.name = 'DIVE';
%                 flow  height
dat.DIVE.patch =  [1.95  2   % left bottom %   % http://www.dive-turbine.de/pages/de/technologie/einsatzbereich.php
                  30     2   % right bottom
                  40     6   % right
                  9.6    25  % right top  
                  0.6    25  % left top  
                  0.6    6]; % left   
dat.DIVE.color = [0.8 0.8 0.0];
dat.DIVE.style = 'full';

%% ########################### figure #######################
figH = figure(55824);
clf;
axeH  = axes;
hold on
box on
set(axeH,'XScale','log','yScale','log')
xlim(flowRange)
ylim(heightRange)
grid off % matlab grid does not work nicely


set(axeH,'XTick',XTickValues);
strrep(cellstr(num2str(YTickValues(:))),'.',',')

set(axeH,'YTick',YTickValues);
strrep(cellstr(num2str(YTickValues(:))),'.',',')

set(axeH,'YMinorTick','off'); % matlab ticks do not work nicely
set(axeH,'XMinorTick','off'); % matlab ticks do not work nicely

set(axeH,'XMinorGrid','off'); % matlab ticks do not work nicely
set(axeH,'YMinorGrid','off'); % matlab ticks do not work nicely

xlabel('Schluckvolumen [m^3/s]')
ylabel('Fallhöhe [m]')

%% plot Patches Background
% Renderer 'opengl' does not support log axes and 'painters' does not support transparency
% 'EdgeAlpha' and 'FaceAlpha' cannot be used.
% Transparency must be done in [[:File:Post-production|Post-production]] using inkscape.

for type = fieldnames(dat)'
    if strcmp(dat.(type{1}).style(1),'f') % 'full'
        patch(dat.(type{1}).patch(:,1),dat.(type{1}).patch(:,2),dat.(type{1}).color,...
            'FaceColor',dat.(type{1}).color,...
            'EdgeColor','none');
    end
end

%% Grid and Ticks

% create own grid
for nTick = XTickValues(2:end-1)
    plot([nTick nTick],[heightRange(1) heightRange(2)],':','color',[0.5 0.5 0.5]) % draw grid line
end
for nTick = YTickValues(2:end-1)
    plot([flowRange(1) flowRange(2)],[nTick nTick],':','color',[0.5 0.5 0.5]) % draw grid line
end

% create own minor ticks
baseHeightForPowerTick = heightRange(1);
for minTick = 1:9
    for orderMag = 10.^[-2:4]
        posValue = minTick*orderMag;
        if flowRange(1) < posValue && posValue < flowRange(2)
            plot([posValue posValue],[heightRange(1) heightRange(1)*1.15],'k') % draw tick line
            plot([posValue posValue],[heightRange(2) heightRange(2)/1.15],'k') % draw tick line
        end
        if heightRange(1) < posValue && posValue < heightRange(2)
            plot([flowRange(1) flowRange(1)*1.15],[posValue posValue],'k') % draw tick line
            plot([flowRange(2) flowRange(2)/1.15],[posValue posValue],'k') % draw tick line
        end
    end
end

% create power grid
textRot = -43;
Efficency = 0.85; % 0.9;
for PowerGrid = [1 2 5] % [1 3]
    for orderMag = 10.^[-1:6] 
        currentPower = PowerGrid*orderMag;%  in kW
        xPowerGrid = [flowRange(1) currentPower/9.81/Efficency/heightRange(1)];
        yPowerGrid = [currentPower/9.81/Efficency/flowRange(1) heightRange(1)];
        plot(xPowerGrid,yPowerGrid,'b:') % draw power line
        
        if currentPower >= 10^6
            powerText = [num2str(currentPower/10^6) ' GW'];
        elseif currentPower >= 1000
            powerText = [num2str(currentPower/1000) ' MW'];
        elseif currentPower >= 1
            powerText = [num2str(currentPower)      ' kW'];
        else
            powerText = [num2str(currentPower*1000) ' W'];
        end
        text(10.^mean(log10(xPowerGrid)),10.^mean(log10(yPowerGrid)),powerText,...
            'HorizontalAlignment','center','VerticalAlignment','bottom',...
            'FontName',fontToUse,'Rotation',textRot,'color','b');
        
    end
end

% create minor power ticks
for minTick = 1:9
    for orderMag = 10.^[-1:6]
        posValue = minTick*orderMag;
        xPowerTick(1) = posValue/9.81/Efficency/nthroot(posValue*0.0015,2.05);  % the factor determins the up/down position of the tick; the nth-root the angle,
        yPowerTick(1) = posValue/9.81/Efficency/xPowerTick(1);
        
        xPowerTick(2) = posValue/9.81/Efficency/nthroot(posValue*0.001,2.05); % the factor difference determins the length of the ticks
        yPowerTick(2) = posValue/9.81/Efficency/xPowerTick(2);
        
        if heightRange(1) < yPowerTick(2) && xPowerTick(2) < flowRange(2)
            plot(xPowerTick,yPowerTick,'b') % draw power tick
        end
    end
end

%% plot patch-edges
for type = fieldnames(dat)'
    if strcmp(dat.(type{1}).style(1),'f') % 'full'
        patch(dat.(type{1}).patch(:,1),dat.(type{1}).patch(:,2),dat.(type{1}).color,...
            'FaceColor','none',...
            'EdgeColor',dat.(type{1}).color,...
            'LineWidth',1);
        text(mean( dat.(type{1}).patch(:,1) ),mean( dat.(type{1}).patch(:,2) ), dat.(type{1}).name,...
            'HorizontalAlignment','center','VerticalAlignment','middle',...
            'FontName',fontToUse,'color',dat.(type{1}).color,'FontWeight','bold','FontSize', foSizeToUse+1);
    else % 'subsection';
        patch(dat.(type{1}).patch(:,1),dat.(type{1}).patch(:,2),dat.(type{1}).color,...
            'FaceColor','none',...
            'EdgeColor',dat.(type{1}).color,...
            'LineWidth',0.5);
        text(mean( dat.(type{1}).patch(:,1) ),mean( dat.(type{1}).patch(:,2) ), dat.(type{1}).name,...
            'HorizontalAlignment','center','VerticalAlignment','middle',...
            'FontName',fontToUse,'color',dat.(type{1}).color);
    end
end

%% Final
text(225,1.8,{'Hilfslinien mit'; 'Wirkungsgrad'; 'Annahme:'; ['{\it\mu}=' strrep(num2str(Efficency),'.',',')]},...
            'HorizontalAlignment','left','VerticalAlignment','top',...
            'FontName',fontToUse,'Rotation',textRot,'color','b');
        
plot2svg('Kennfeld Wasserturbinen.svg',figH) % by Juerg Schwizer, See http://www.zhinst.com/blogs/schwizer/ 
% now follows "post-production" using inkscape

Licensing[edit]

I, the copyright holder of this work, hereby publish it under the following license:
Creative Commons CC-Zero This file is made available under the Creative Commons CC0 1.0 Universal Public Domain Dedication.
The person who associated a work with this deed has dedicated the work to the public domain by waiving all of their rights to the work worldwide under copyright law, including all related and neighboring rights, to the extent allowed by law. You can copy, modify, distribute and perform the work, even for commercial purposes, all without asking permission.

File history

Click on a date/time to view the file as it appeared at that time.

(newest | oldest) View (newer 10 | ) (10 | 20 | 50 | 100 | 250 | 500)
Date/TimeThumbnailDimensionsUserComment
current19:03, 16 February 2018Thumbnail for version as of 19:03, 16 February 2018480 × 370 (72 KB)Jahobr (talk | contribs)Reverted to version as of 23:18, 28 March 2017 (UTC)
19:01, 16 February 2018Thumbnail for version as of 19:01, 16 February 2018480 × 370 (60 KB)Jahobr (talk | contribs)Text freigestellt; Text-Positionen verbessert
23:18, 28 March 2017Thumbnail for version as of 23:18, 28 March 2017480 × 370 (72 KB)Jahobr (talk | contribs)+DIVE-Turbine
17:05, 1 February 2017Thumbnail for version as of 17:05, 1 February 2017480 × 370 (71 KB)Jahobr (talk | contribs)Schnecke bis 10m³/s see: Hydropower Dommelstroom
14:28, 28 January 2017Thumbnail for version as of 14:28, 28 January 2017480 × 370 (71 KB)Jahobr (talk | contribs)screws to 9m Example: Cragside Estate
23:56, 23 January 2017Thumbnail for version as of 23:56, 23 January 2017480 × 370 (71 KB)Jahobr (talk | contribs)cosmetics
09:45, 23 January 2017Thumbnail for version as of 09:45, 23 January 2017480 × 370 (65 KB)Jahobr (talk | contribs)+VLH and cosmetics
00:48, 26 November 2016Thumbnail for version as of 00:48, 26 November 2016480 × 370 (54 KB)Jahobr (talk | contribs)brighter, minor changes
15:04, 21 November 2016Thumbnail for version as of 15:04, 21 November 2016480 × 370 (39 KB)Jahobr (talk | contribs)minor fixes
05:24, 21 November 2016Thumbnail for version as of 05:24, 21 November 2016480 × 370 (38 KB)Sameboat (talk | contribs)Mass cleanup based on the initial upload
(newest | oldest) View (newer 10 | ) (10 | 20 | 50 | 100 | 250 | 500)

File usage on other wikis

The following other wikis use this file:

Metadata