- Splunk Answers
- :
- Using Splunk
- :
- Splunk Search
- :
- How to extract specific field values from JSON for...
- Subscribe to RSS Feed
- Mark Topic as New
- Mark Topic as Read
- Float this Topic for Current User
- Bookmark Topic
- Subscribe to Topic
- Mute Topic
- Printer Friendly Page
- Mark as New
- Bookmark Message
- Subscribe to Message
- Mute Message
- Subscribe to RSS Feed
- Permalink
- Report Inappropriate Content
How to extract specific field values from JSON format events?
I am looking to extract some information from a Values field that has two values within it.
How can i specify which one of the values I need in a search as the two values is meant to be "read" and "written"?
This is my current search right now and I think it is including both values together.
index="collectd_test" plugin=disk type=disk_octets plugin_instance=$plugin_instance1$
| stats  min(value) as min max(value) as max avg(value) as avg
| eval min=round(min, 2)
| eval max=round(max, 2)
| eval avg=round(avg, 2)- Mark as New
- Bookmark Message
- Subscribe to Message
- Mute Message
- Subscribe to RSS Feed
- Permalink
- Report Inappropriate Content
instead of values, you should see a field named values{} because that's an array. Because you are only interested in numeric min, max, and avg, you only need to substitute this name
index="collectd_test" plugin=disk type=disk_octets plugin_instance=$plugin_instance1$
| stats  min(value{}) as min max(value{}) as max avg(value{}) as avg
| eval min=round(min, 2)
| eval max=round(max, 2)
| eval avg=round(avg, 2)
- Mark as New
- Bookmark Message
- Subscribe to Message
- Mute Message
- Subscribe to RSS Feed
- Permalink
- Report Inappropriate Content
So I changed the search with your suggestion and also added another array that its sorting by, but its giving me the same numbers for both read and write. I am looking to show the value of min, max, and avg for read and then the same for write and it should be different.
This is my current search.
index="collectd_test" plugin=disk type=disk_octets plugin_instance=$plugin_instance1$
| stats min(values{}) as min max(values{}) as max avg(values{}) as avg by dsnames{}
| eval min=round(min, 2)
| eval max=round(max, 2)
| eval avg=round(avg, 2)
This is the current output.
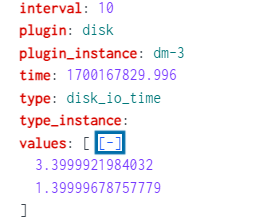
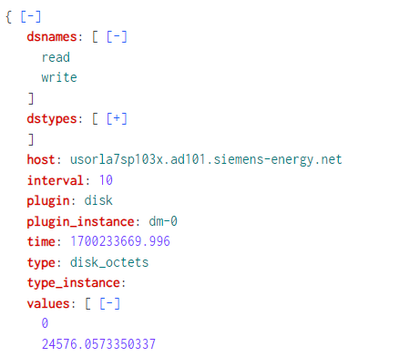
And this is the JSON format events.
- Mark as New
- Bookmark Message
- Subscribe to Message
- Mute Message
- Subscribe to RSS Feed
- Permalink
- Report Inappropriate Content
Please use raw text to post sample JSON events, not screenshot and not Splunk's contracted pretty format.
Do you mean the value{0} correspond to dsnames{0}, and value{1} to dsnames{1}? This is about as wasteful as JSON data design goes. If you have influence on developers who wrote these logs, implore them to change the structure to array of hashes instead of hash of arrays. Like this:
{"whatever":
 [
  {"dsname":"read", "dstype":"typefoo", "value": 123},
  {"dsname":"write", "dstype":"typebar", "value": 456}
 ]
}
Before that happens, you can contain the damage from your developers' crimes with some reconstruction. Traditionally, this is done with string concatenation; and usually, you need mvmap to handle indeterminant number or large number of array elements.
In this case, there are only two semantic values so I'll not be bothered with mvmap. I will also use structured JSON instead of string concatenation. (JSON function was introduced in Splunk 8.0.)
| eval data = mvappend(json_object("dsname", mvindex('dsnames{}', 0), "value", mvindex('values{}', 0)),
  json_object("dsname", mvindex('dsnames{}', 1), "value", mvindex('values{}', 1)))
| mvexpand data
| spath input=data
| stats min(value) as min max(value) as max avg(value) as avg by dsname
| eval min=round(min, 2)
| eval max=round(max, 2)
| eval avg=round(avg, 2)
Here is some mock data that I use to test the above
| _raw | dsnames{} | values{} |
| {"dsnames": ["read", "write"], "values": [123, 234]} | read write | 123 234 |
| {"dsnames": ["read", "write"], "values": [456, 567]} | read write | 456 567 |
This is an emulation to get the above
| makeresults
| eval data=mvappend("{\"dsnames\": [\"read\", \"write\"], \"values\": [123, 234]}", "{\"dsnames\": [\"read\", \"write\"], \"values\": [456, 567]}")
| mvexpand data
| rename data as _raw
| spath
``` data emulation above ```
You can play with this and compare with real data. This mock data gives
| dsname | min | max | avg |
| read | 123.00 | 456.00 | 289.50 |
| write | 234.00 | 567.00 | 400.50 |
- Mark as New
- Bookmark Message
- Subscribe to Message
- Mute Message
- Subscribe to RSS Feed
- Permalink
- Report Inappropriate Content
The solution given does work and it is exactly what I am looking for. The value{0} does correspond to dsnames{0}, and value{1} to dsnames{1}. I am unfortunately not able to change the logs.
{"values":[0,35225.165651947],"dstypes":["derive","derive"],"dsnames":["read","write"],"time":1700320094.109,"interval":10.000,"host":"usorla7sw101x.ad101.siemens-energy.net","plugin":"disk","plugin_instance":"dm-0","type":"disk_octets","type_instance":"","meta":{"network:received":true,"network:ip_address":"129.73.170.204"}}
This is the current output.
dsname min max avg| read | 0.00 | 192626230.85 | 53306.64 |
| write | 0.00 | 192626230.85 | 65185.22 |
- Mark as New
- Bookmark Message
- Subscribe to Message
- Mute Message
- Subscribe to RSS Feed
- Permalink
- Report Inappropriate Content
Given that min, max, avg operated on the same field, unless all three give the same value for both groupby values, the only conclusion is that max for both is the same. You can examine actual data.
| eval data = mvappend(json_object("dsname", mvindex('dsnames{}', 0), "value", mvindex('values{}', 0)),
  json_object("dsname", mvindex('dsnames{}', 1), "value", mvindex('values{}', 1)))
| mvexpand data
| spath input=data
| eventstats min(value) as min max(value) as max avg(value) as avg by dsname
| where value == max
This will show you events that matches max.
- Mark as New
- Bookmark Message
- Subscribe to Message
- Mute Message
- Subscribe to RSS Feed
- Permalink
- Report Inappropriate Content
I tried to input your search to examine actual data and the results are coming back as 0 events matched and i tried it for min and avg as well, changing "| where value == max" to "| where value == min" or "| where value == avg".
- Mark as New
- Bookmark Message
- Subscribe to Message
- Mute Message
- Subscribe to RSS Feed
- Permalink
- Report Inappropriate Content
That's impossible. Mathematically, it is extremely improbable for any real event to have avg value. But min and max must be there. Are you sure you didn't round the max after eventstats as in your initial code? Can you post stats without rounding?
index="collectd_test" plugin=disk type=disk_octets plugin_instance=dm-0
| eval data = mvappend(json_object("dsname", mvindex('dsnames{}', 0), "value", mvindex('values{}', 0)), json_object("dsname", mvindex('dsnames{}', 1), "value", mvindex('values{}', 1)))
| mvexpand data
| spath input=data
| stats min(value) as min max(value) as max avg(value) as avg by dsnameAnother way to examine data is to sort and compare with max.
index="collectd_test" plugin=disk type=disk_octets plugin_instance=dm-0
| eval data = mvappend(json_object("dsname", mvindex('dsnames{}', 0), "value", mvindex('values{}', 0)), json_object("dsname", mvindex('dsnames{}', 1), "value", mvindex('values{}', 1)))
| mvexpand data
| spath input=data
| table data _raw
| sort - value
| eventstats min(value) as min max(value) as max avg(value) as avg by dsname
The first row should match one of max. You can also make a comparison of values in data with those in _raw directly.
- Mark as New
- Bookmark Message
- Subscribe to Message
- Mute Message
- Subscribe to RSS Feed
- Permalink
- Report Inappropriate Content
Yes I did not round the max after eventstats and I am able to post stats without rounding.
I tested the _raw data from earlier and it does work with this search, showing the min, max and avg properly.
| makeresults
| eval data=mvappend("{\"dsnames\": [\"read\", \"write\"], \"values\": [123, 234]}", "{\"dsnames\": [\"read\", \"write\"], \"values\": [456, 567]}")
| mvexpand data
| rename data as _raw
| spath
| eval data = mvappend(json_object("dsname", mvindex('dsnames{}', 0), "value", mvindex('values{}', 0)),
  json_object("dsname", mvindex('dsnames{}', 1), "value", mvindex('values{}', 1)))
| mvexpand data
| spath input=data
| stats min(value) as min max(value) as max avg(value) as avg by dsname
| eval min=round(min, 2)
| eval max=round(max, 2)
| eval avg=round(avg, 2)
The other way to sort and compare with max does give me results.
{"dsname":"read","value":"0"}{"values":[0,23347.1366453364],"dstypes":["derive","derive"],"dsnames":["read","write"],"time":1700387069.996,"interval":10.000,"host":"usorla7sp103x.ad101.siemens-energy.net","plugin":"disk","plugin_instance":"dm-0","type":"disk_octets","type_instance":""}I am still not sure why Max would still be the same as those values should be different just on the basis that the "maximum number of disk operations or disk time for operations or disk traffic" should be different for read and written data, logically speaking.


