
Manchmal kommt es vor, dass Du eine hübsche kleine Power Platform Lösung bestehend aus einer Canvas App, ein paar SharePoint-Listen und dem einen oder anderen Flow baust und Dir denkst „Mensch, das zeig doch mal meinem Kumpel!“
Nun ist das mit dem Gast-Zugriff auf PowerApps und Co so eine Sache. Ich mach es einfacher: Es geht nicht, es sei denn Du baust eine explizite Teams App mit DataVerse for Teams.
Dieser Artikel zeigt, wie Du einen neuen Benutzer anlegst, ihn mit den richtigen Lizenzen versorgst und die notwendigen Freigaben machst.
Archiv der Kategorie: O365
My personal Flow hacks
Using Files in OneDrive
The File content type

When using the „When a file is modified“ action of the OneDrive for Business Connector, you will receive a lot of cryptic stuff.
If you want to make a descition depending of the file type, you should use the File content type property.
For Excel Files it is:
application/vnd.openxmlformats-officedocument.spreadsheetml.sheet
Word looks like that:
application/vnd.openxmlformats-officedocument.wordprocessingml.document
Why do you need this information?
If you want to process the data within this documents you have to use different connectors. So after determining the File content type, you can use a condition depending to that value:

How to build a PowerApps component for calculating workdays between two dates
In an earlier Post i have shown, how to calculate workdays in PowerApps.
This post is about how to encapsulate this logic in a reusable component. This component should be used on a Canvas App Screen, where you have two datepicker controls to define the start date and an end date. These dates specify a date range (e.g. for a time off application) where you want to know the number of working days.The component should calculate the value and provide a property that can be accessed by the host app.
Creating SharePoint Search WebParts in Modern Page using PowerApp
A customer contacted me with the request to place a search box under the page header, as is possible in a classic environment with the search WebParts. Since Microsoft still does not provide a suitable WebPart,
Normally, you would create a WebPart with SPFx. But why should not it work with PowerApps? Ok, what do I need?
- A search box,
- a start button,
- and the option to display the default search results page.
And PowerApps provide all these features 🙂
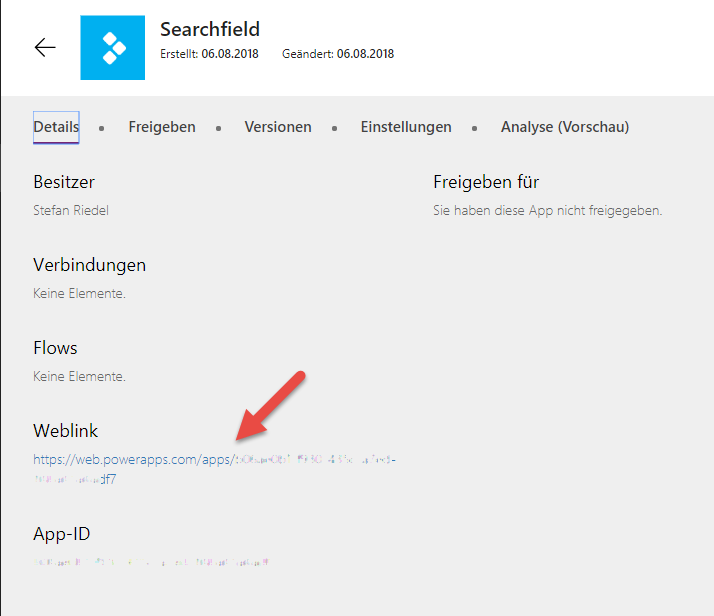
The link
First, let’s have a look at what the link should look like. For this we use the standard search and search for „test“. Now, we are redirected to the search results page. We keep this link for later.
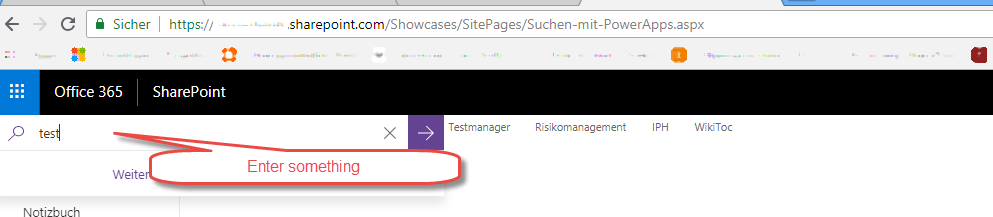
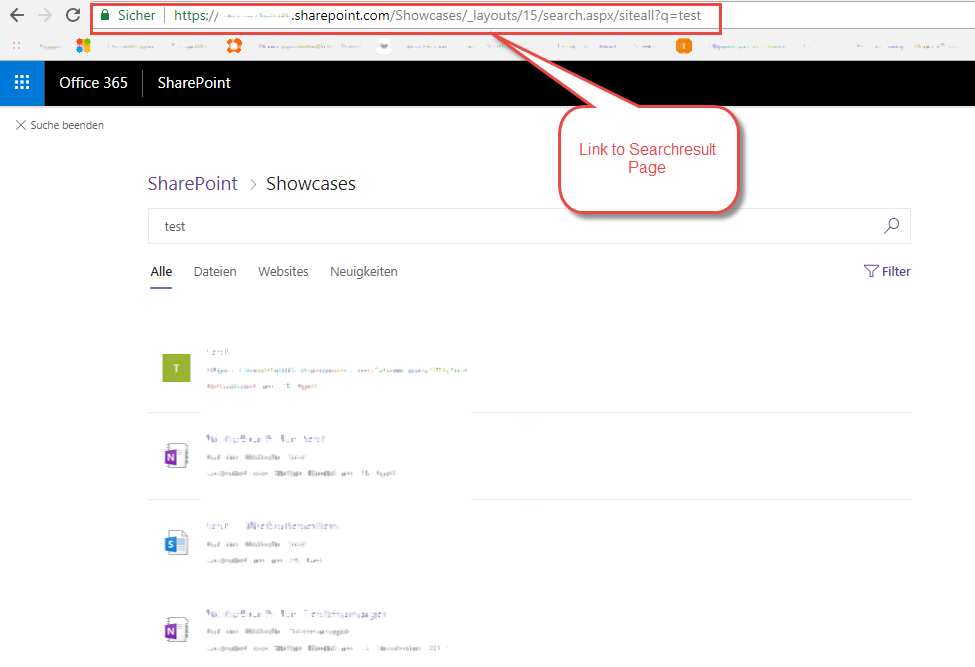
As you can see, the link consists of the URL to your WebPart, followed by the link to the search result page „/_layouts/15/search.aspx/siteall“ and the keyword „?=test„.
The App
Now, we create the PowerApp:
In a new App in landscape orientation we place a text box and an icon.
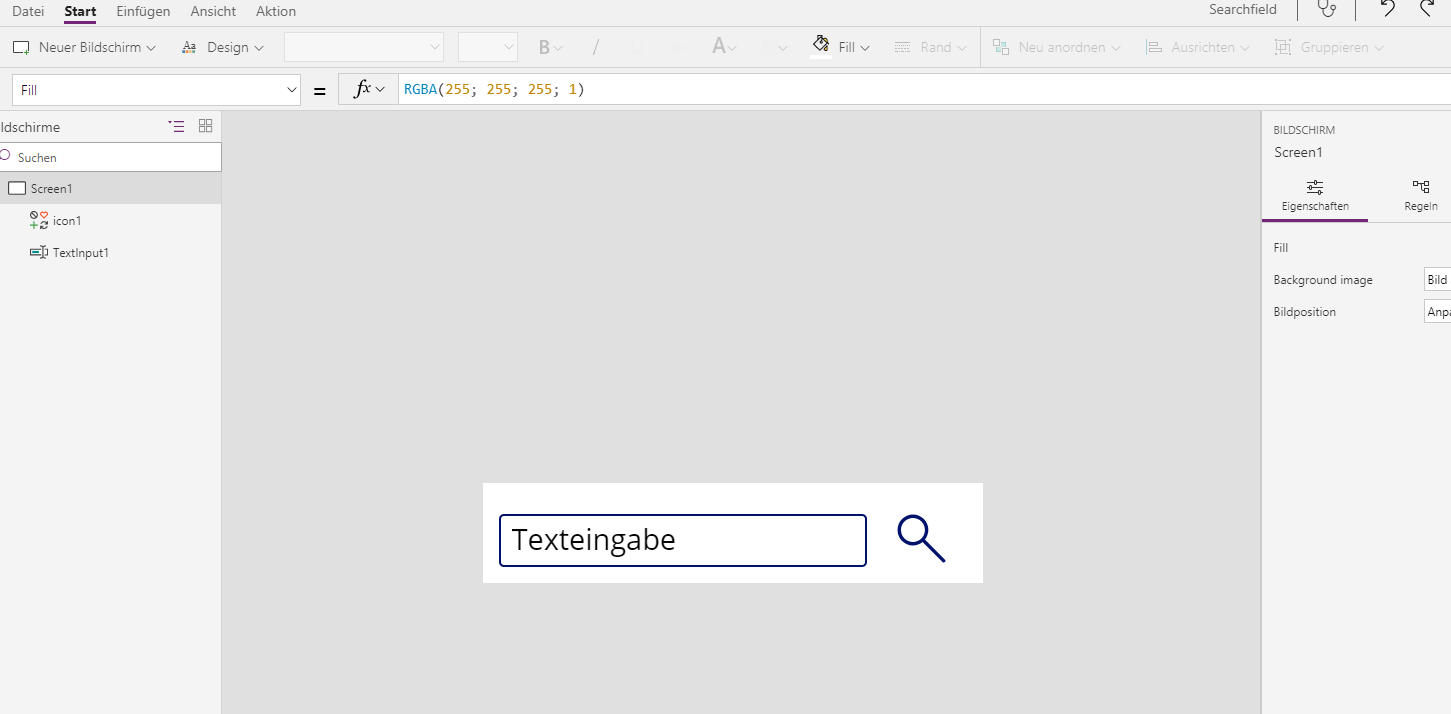
Finding the optimum size of the canvas requires some playing around. I like 500 x 150 px quite well. If you resize it after you have already placed some controls on it, you may need to adjust the size of the controls and of the font.
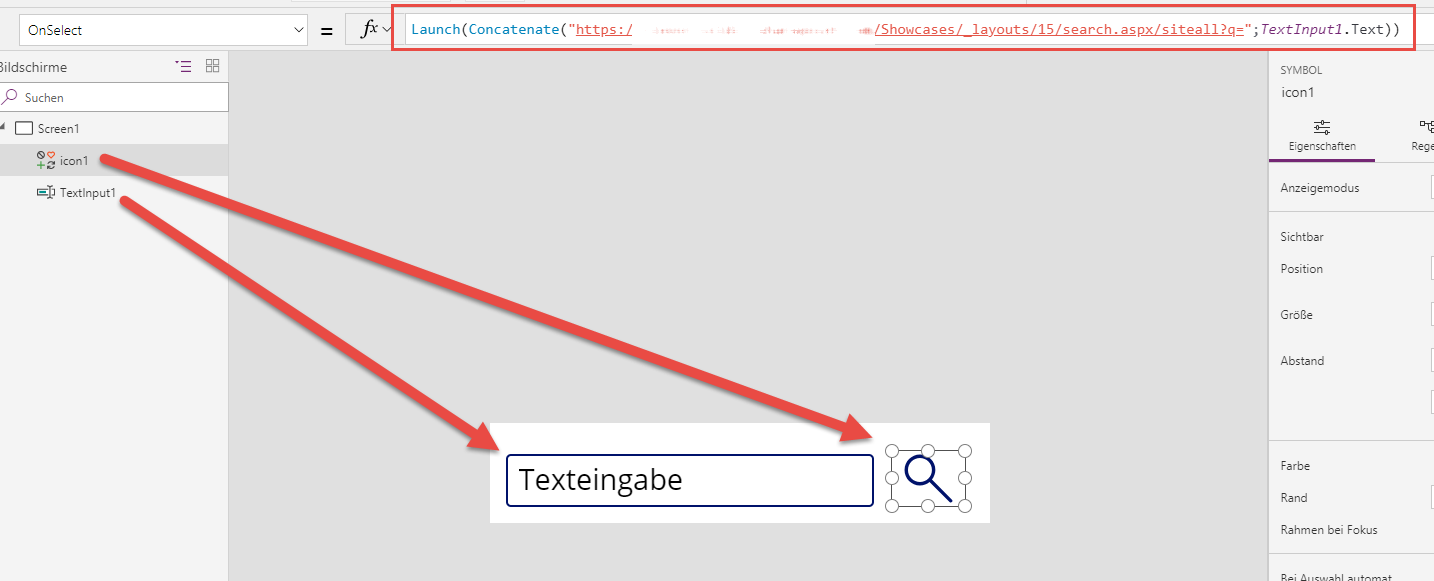
In the icon’s OnSelect event, we use the launch action to bring up the search results page. The link consists of the address of the search results page as well as of the value of the text field.
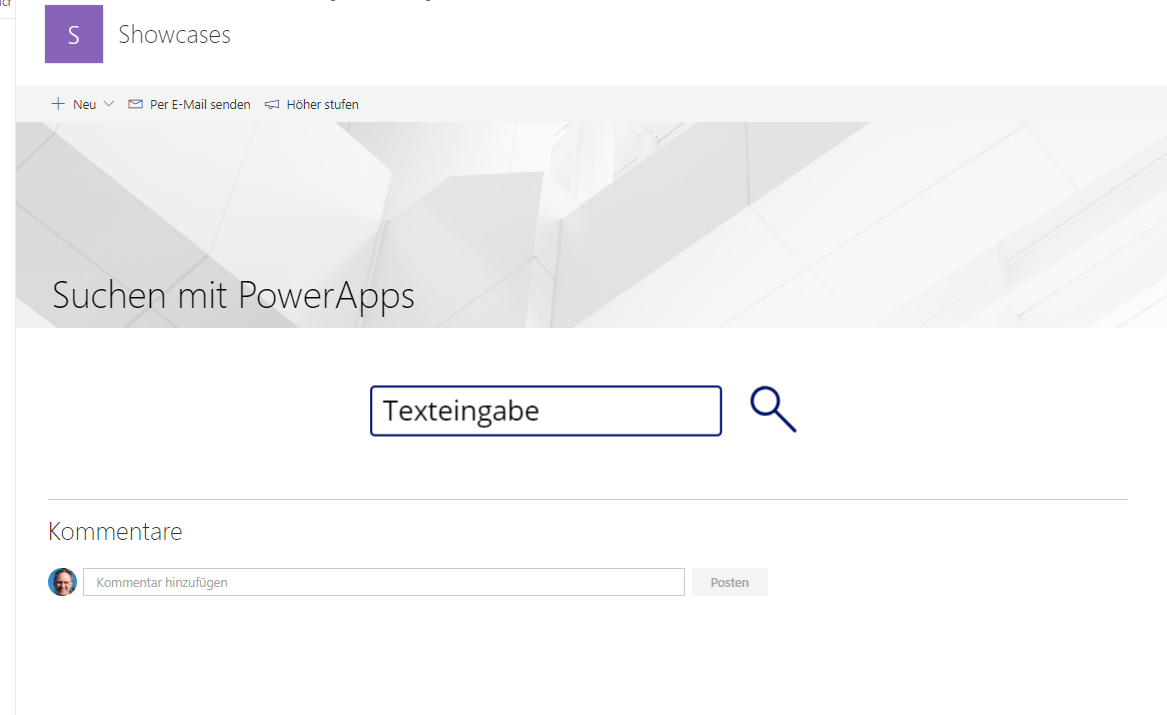
Now, the App is ready and can be shared with the whole organization.
In the last step, we only need to copy the link to the PowerApp:
The page
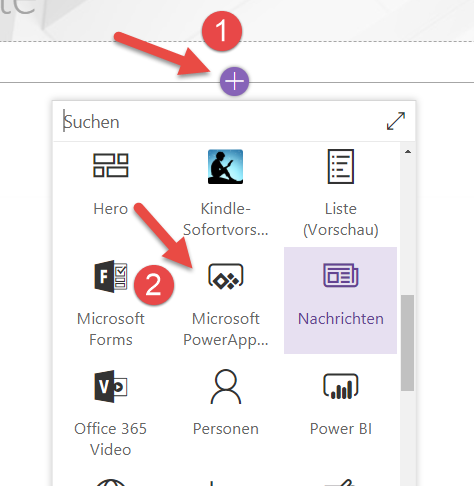
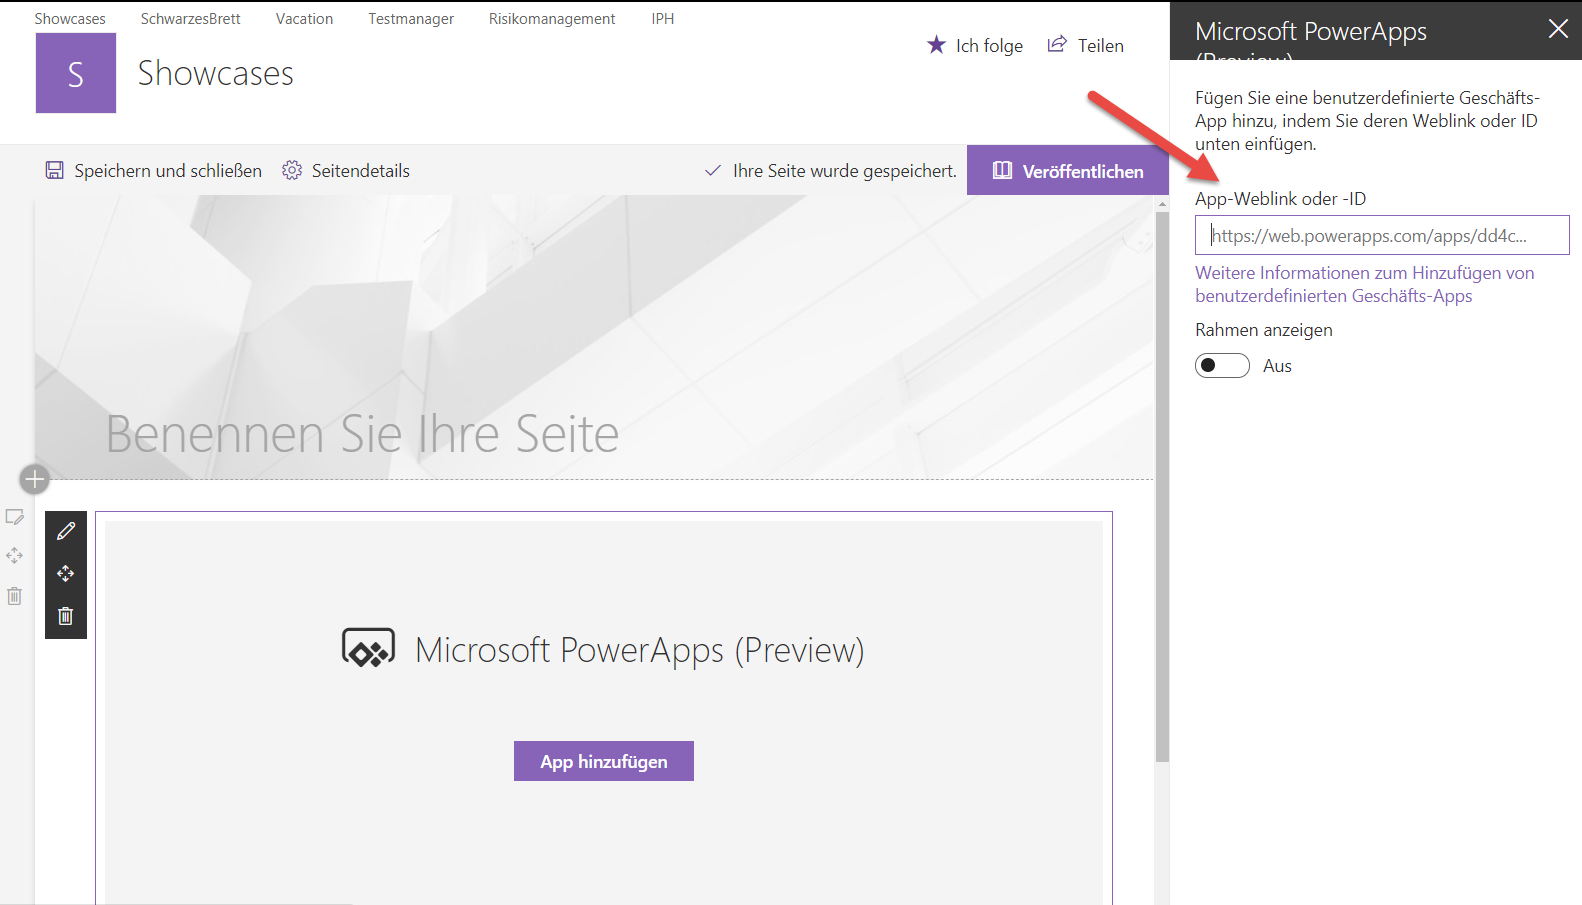
Now, we edit our Modern Page and add the PowerApp WebPart. Then we paste the link to the PowerApp into the URL field.
And that’s it 🙂
I hope you will find this useful.
For questions or comments feel free to contact me on Twitter via @PapaRiedel.
Using MS Flow to create new SharePoint List Views
One of my customers needs a Flow, running one time per year. It has to create a view to a SharePoint List that is filtered by the a column ‚Year‘ with a value of the last year.
On new years day 2019 the Flow has to create a new ListView that filters a SharePoint List to retrieve all Items with ‚Year‘ equals ‚2018‘ and so on.
I have realized a proof of concept by using a Flow Button. In production the trigger has to be replaced by a recurring trigger, running each 1st of a month, checking if the current month is January.
Because of the fact that nearly everything in SharePoint / Office 365 can be done remotely using REST, i’m not afraid to find any solution for my customer.
The solution is very simple:
First of all you need to know how to use the API. This can be found here: https://msdn.microsoft.com/en-us/library/office/dn531433.aspx#bk_ViewCollection.
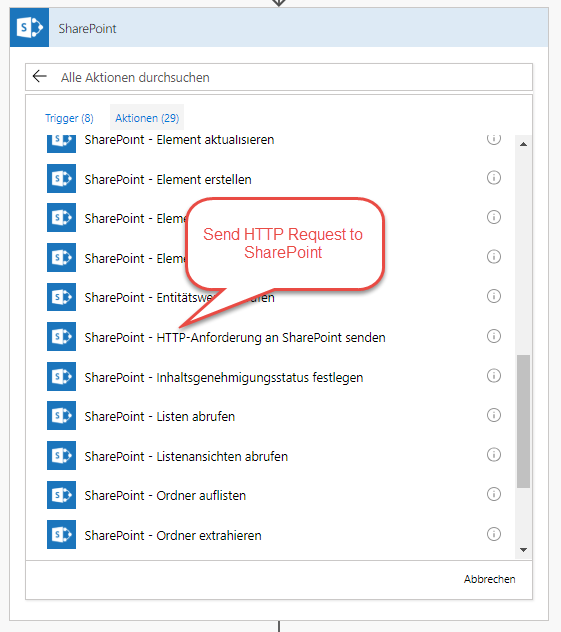
Now search for the Send HTTP request to SharePoint Action an fill out the form like the picture below:
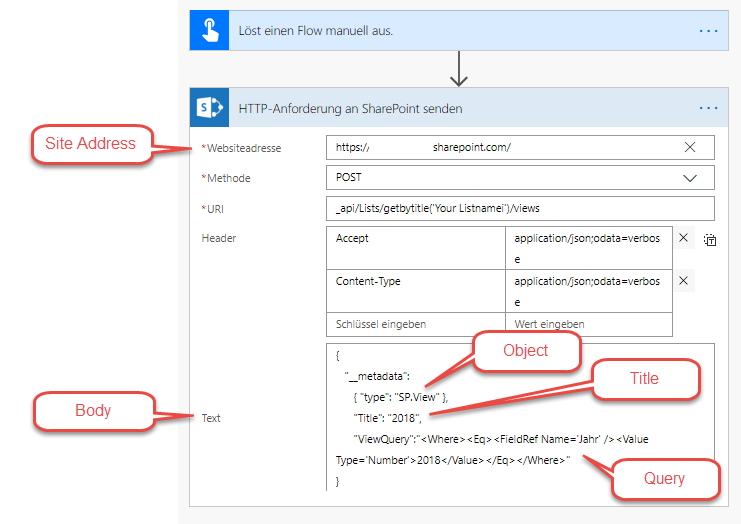
You will notice that the ‚Body‘ is static text. You are free to build a dynamic string that can be referenced in this Property.
That’s it 🙂
Do you have any questions or comments? Feel free to contact me on Twitter at @papariedel.
Microsoft Flow mittels skybow action links integrieren
(english version: https://wp.me/p3Vyfd-b3)
Das skybow solution studio stellt Aktionen (action links) zur Verfügung, um auf Ereignisse oder Benutzerinteraktionen reagieren zu können. Poweruser können damit sogar komplexe Lösungen erstellen:
Mit dem Erstellen, Löschen oder Updaten von ListItems, der Umleitung auf Formularseiten, der Ausgabe von Nachrichten oder der Ausführung von SharePoint 2013 Workflows stehen viele Werkzeuge zur Verfügung, die sich über den Action Builder zu mächtigen Prozessen kombinieren lassen. Für kompliziertere Prozesse käme die „Execute Script“-Aktion ins Spiel, die das Tor zur Office365-Welt öffnet.
Nun ist es ja das Ziel des skybow Frameworks, per Lowcode oder Nocode zum Ziel zu kommen. Deshalb lasse ich die Execute Script-Aktion hier bei Seite, denn programmieren will ich ja eigentlich nicht.
Wenn ich im Office 365-Umfeld komplexe Prozesse hinter einer Aktion ausführen möchte, liegt der Einsatz von MS Flow nahe. Glücklicherweise bietet skybow eine HTTP Request Aktion an. Und MS Flow kommt passenderweise mit einem HTTP Request Trigger daher.
Also los:
Erstellung des Flows
Als erstes melde ich mich unter https://flow.microsoft.com mit meinem Orgranisations-Account an und erstelle einen neuen Flow ohne Vorlage.
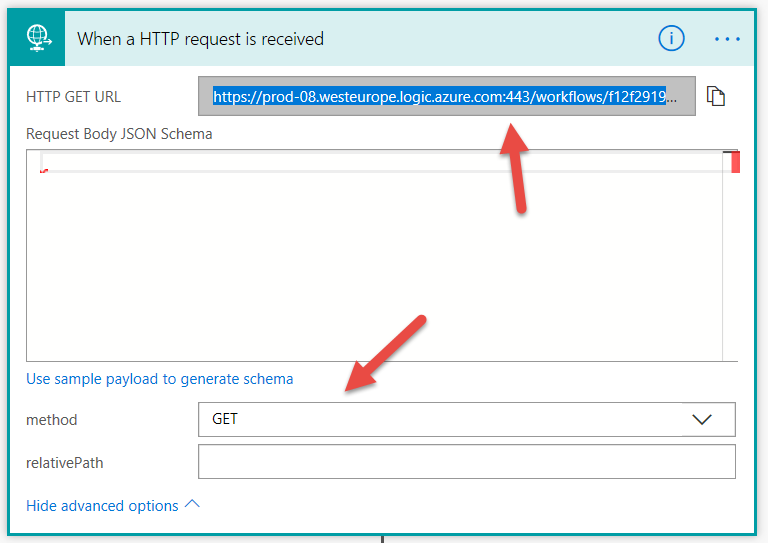
Als Trigger wähle ich wie oben erwähnt When a HTTP request is received:
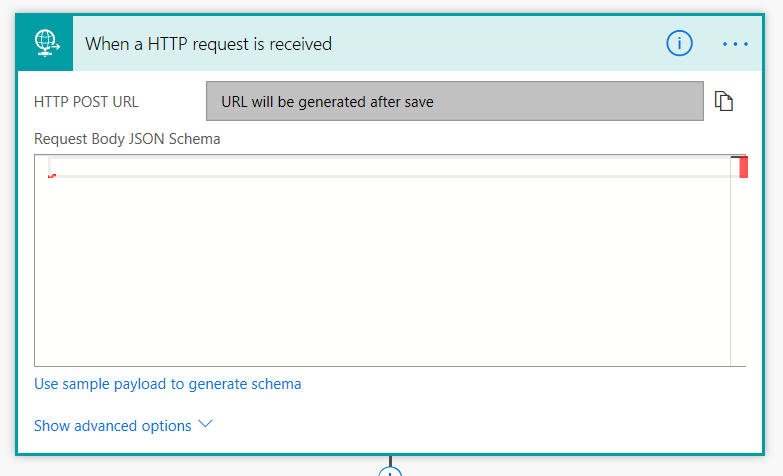
Sobald der Flow gespeichert wird, wird eine eindeutige URL für den Flow erzeugt, die per HTTP Request aufrufbar ist.
Legt man keine Methode fest, ist POST als Standard voreingestellt. Für dieses Beispiel ändern wir die Methode in GET, um gleich die Einstellungen auf der skybow-Seite zu demonstrieren:
Nun kopiere ich mir die eindeutige URL des Flows in die Zwischenablage, da ich sie gleich für den Aufruf per Action Link benötige. Damit ist auch schon das wichtigste fertig: Nämlich die Konfiguration des Endpunktes, in dem sich all die wunderbaren Funktionen einstellen lassen, die unsere skybow-Lösung aus SharePoint-Online in das große Office365-Universum heben.
Integration in skybow Action Links
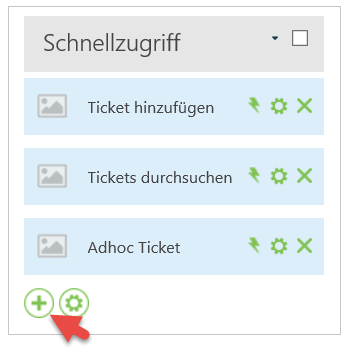
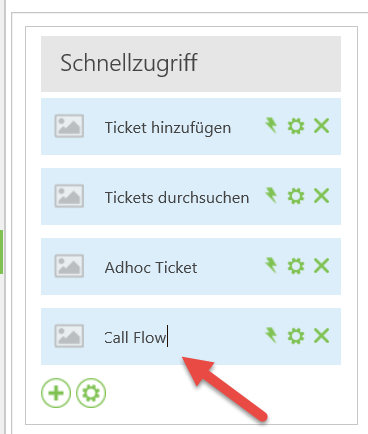
Hier erstelle ich jetzt einen Action Link und gebe ihm auch gleich einen Namen.
Über den Blitz auf der rechten Seite gelange ich zum Action Builder, mit dem ich Ausführungs-Sequenzen erstellen kann.
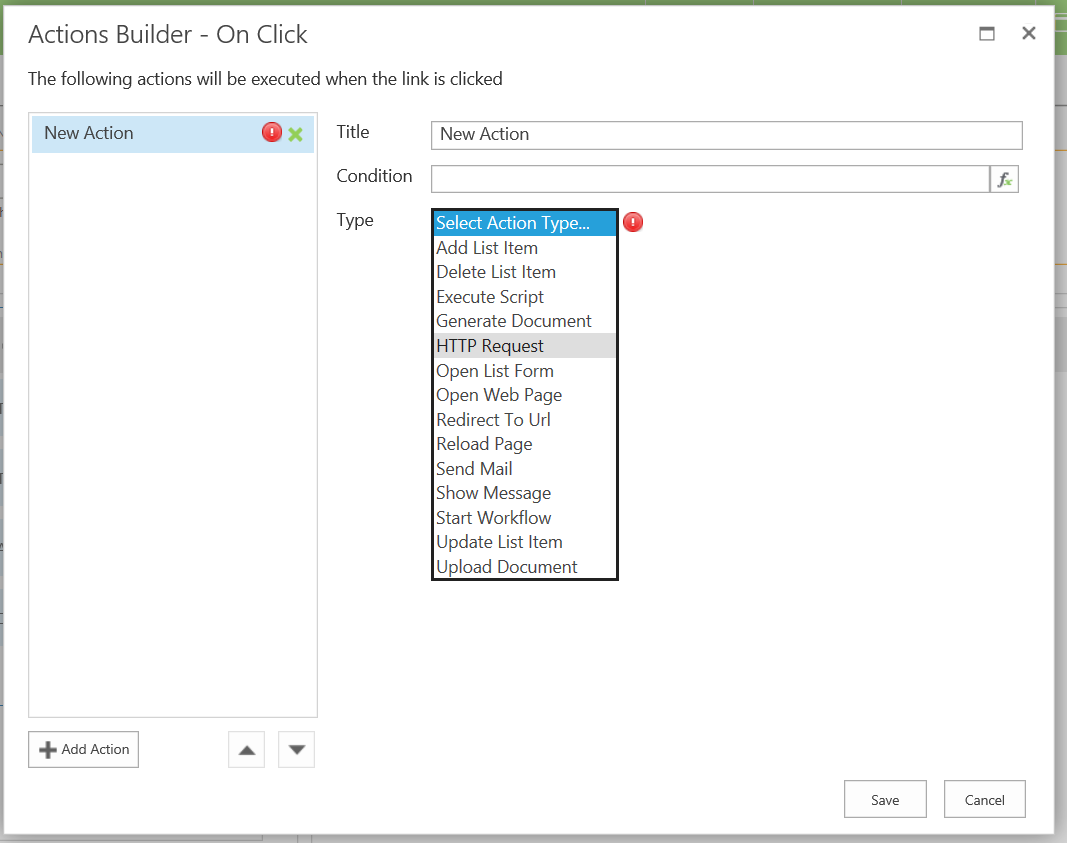
Hier wähle ich nun die HTTP Request Action, um den soeben erstellten Flow aufzurufen.
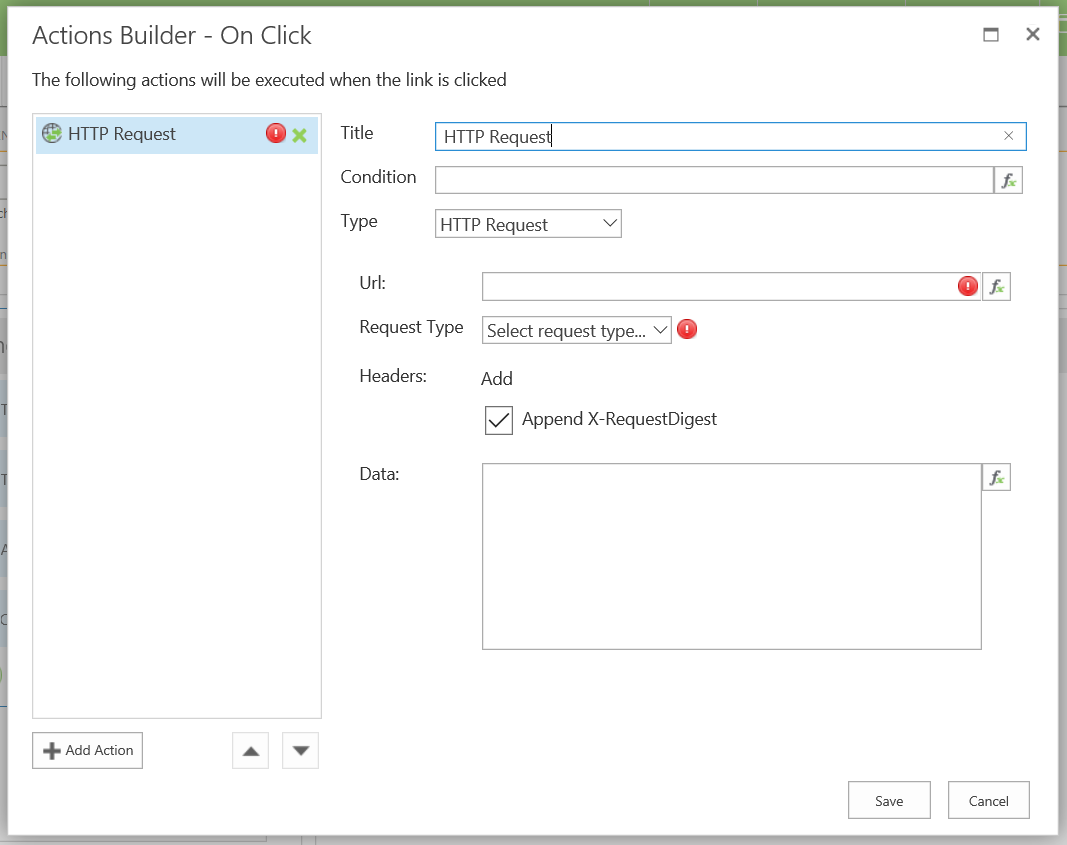
Als Methode wähle ich GET. Hätte ich den Flow nicht explizit auf GET konfiguriert, hätte ich hier als Methode POST wählen müssen, da diese die Standardmethode bei Flow ist.
In das URL-Feld füge ich nun die Flow-URL aus der Zwischenablage ein.
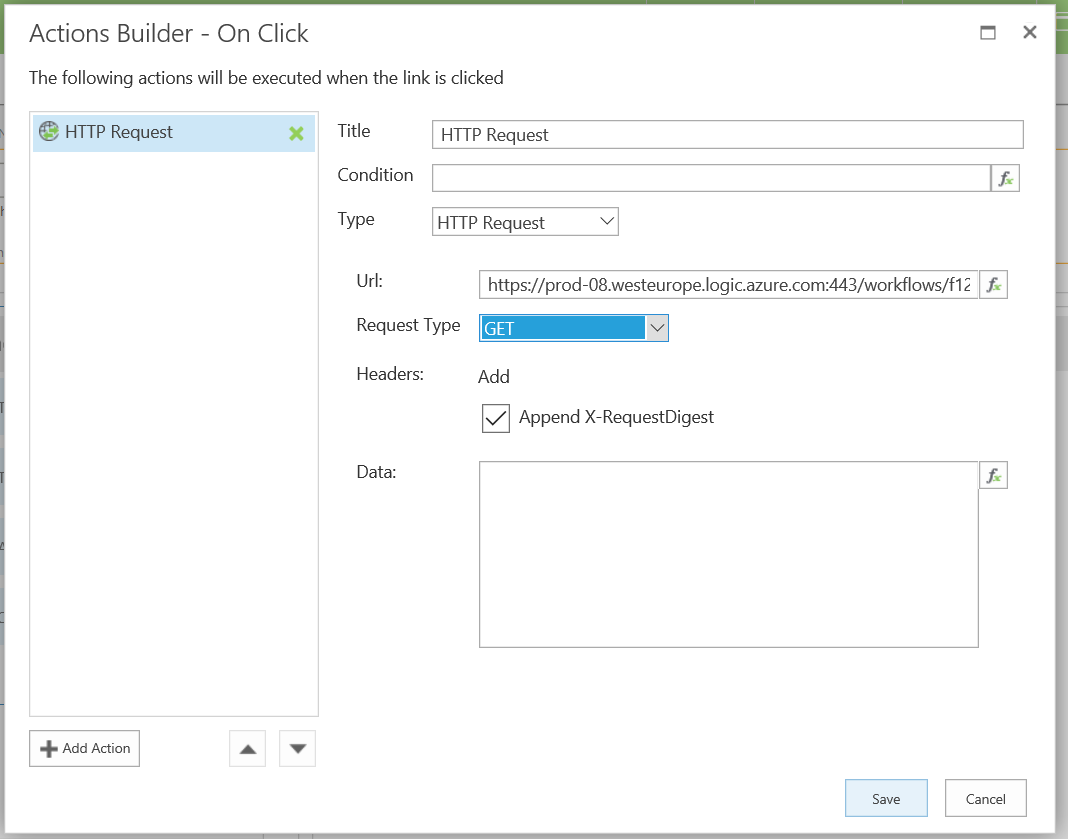
Fertig 🙂
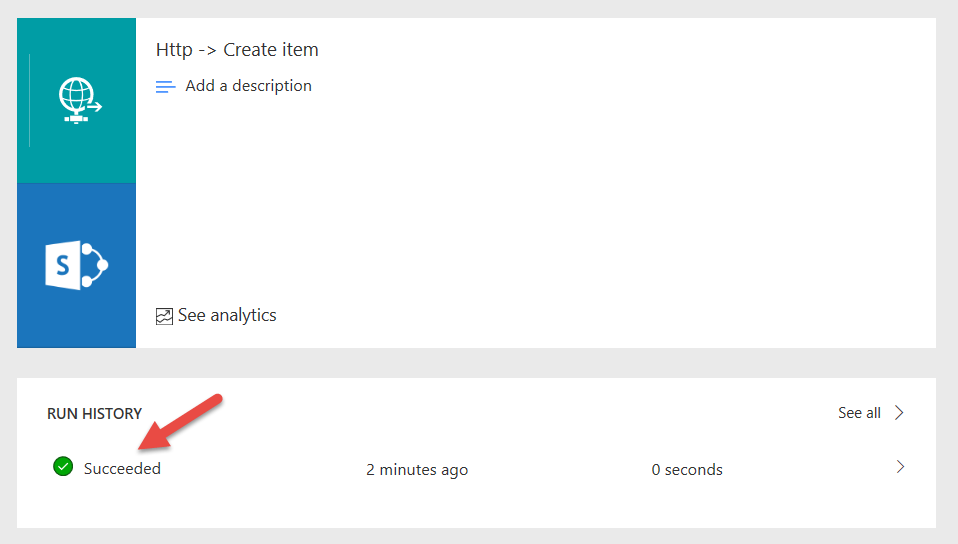
Teste ich die Applikation und betätige den Action Link, so findet der Flow-Aufruf statt. In der Run History des Flows kann ich das nachvollziehen.
In einem weiteren Post werde ich noch detailliert auf die Möglichkeiten der Parametrisierung eingehen.
Habt Ihr Fragen oder Anmerkungen? Dann kontaktiert mich gerne auf Twitter unter @papariedel.
Happy Low Coding 😊
P.S.: Diese Anforderungen lassen sich in SharePoint natürlich auch anders realisieren. Skybow ist aber mein bevorzugtes Framework.
Integrating Microsoft Flow using skybow action links
(German Version: https://wp.me/p3Vyfd-aP)
The skybow solution studio provides action links to respond to events or user interactions.
The available actions let the poweruser create comprehensive solutions:
Adding, deleting or updating list items, opening list forms, showing messages or executing SharePoint 2013 workflows: skybow offers many tools that can be combined to powerful processes using the Action Builder. For more complicated applications, however, the „Execute Script“ action comes into play, opening the door to the Office365 world.
But the aim of the skybow Framework is to get along with lowcode or nocode. Therefore, I leave the Execute Script action aside here, because I do not really want to code.
If I want to execute complex processes behind an action in the Office 365 environment, integrating MS Flow is the obvious solution.
Fortunately, skybow offers an HTTP request action. And Flow comes with an HTTP request trigger.
Let’s go:
Adding the Flow
First of all, I log in at https://flow.microsoft.com with my orgranization account and create a new Flow without a template.
As trigger I choose When a HTTP request is received, as mentioned above:
As soon as the Flow is saved, a unique URL is generated and can be addressed by an HTTP Request.
Unless you determine a particular method, POST is used a default. For this example, however, we change the method to GET, in order to demonstrate the configuration on the skybow page in the next step:
Now, I copy the unique URL of the flow to the clipboard, because I am going to need it for the Action Link request.
Thus, the most important step is done: namely the configuration of the endpoint in which all the wonderful functions can be set that lift our skybow solution from SharePoint Online into the big Office 365 universe.
Integrating skybow Action Links
Now, I create an Action Link and add a title:
A click on the flash on the right hand side opens the Action Builder that allows for creating execution sequences.
Here, I select the HTTP Request Action to address the Flow I just created.
I select GET as method. If I had not explicitly configured the flow as GET, I would have had to choose POST as this is the default method for Flow.
Now, I past the Flow URL from the clipboard into the URL field.
Done 🙂
If I test the application and activate the Action Link, the Flow request takes place. That I can check under Run History in the Flow.
I’ll describe the opportunities of parameterization in detail in a future post.
Do you have any questions or comments? Feel free to contact me on Twitter at @papariedel.
Happy Low Coding 😊
P.S.: Of course there are other ways to implement this, too. But Skybow is my favourite Framework.
Extending Skybow Solutions with MS PowerApps
Currently, I am developing a simple ticket system with the Skybow Solution Builder in Office 365 after work. With Skybow (almost) everything can be implemented as a low-code solution. But then I wanted to generate an overview of all tickets and their status.
I wanted to visualize this – analogous to Microsoft Planner – as a pie chart or donut. How many tickets are open? How many are closed or have a different status? I wanted to present this information to the user at first glance. In addition, the user should be able to quickly and easily customize the diagram according to his or her own wishes. This requirement also had to be implemented as a no-code or low-code solution.
At this point, I did not get on with development at first, as a JavaScript framework seemed to be the only solution. ChartJs (https://www.chartsJS.org) would surely be the tool of choice, though:
- After the tiring last couple weeks, I did not feel like a lot of coding after work.
- Low-code customizing was no option.
- PowerApps have a sort of control that can do the same.
But wait a minute: Can that be done with PowerApps, too?
Yes, sure 😊.
(English screenshots will come later. Hope you can do without for the time being. „Kreisdiagramm“ is a pie chart, for example…)
Pie charts should work. 😊 But can I integrate PowerApps into Skybow Solutions? Yes, of course:
- PowerApps have a web adress.
- SharePoint offers a page viewer WebPart.
- Skybow uses SharePoint.
- And I really did not want to spend more than five minutes for this issue 😉
This is how it works:
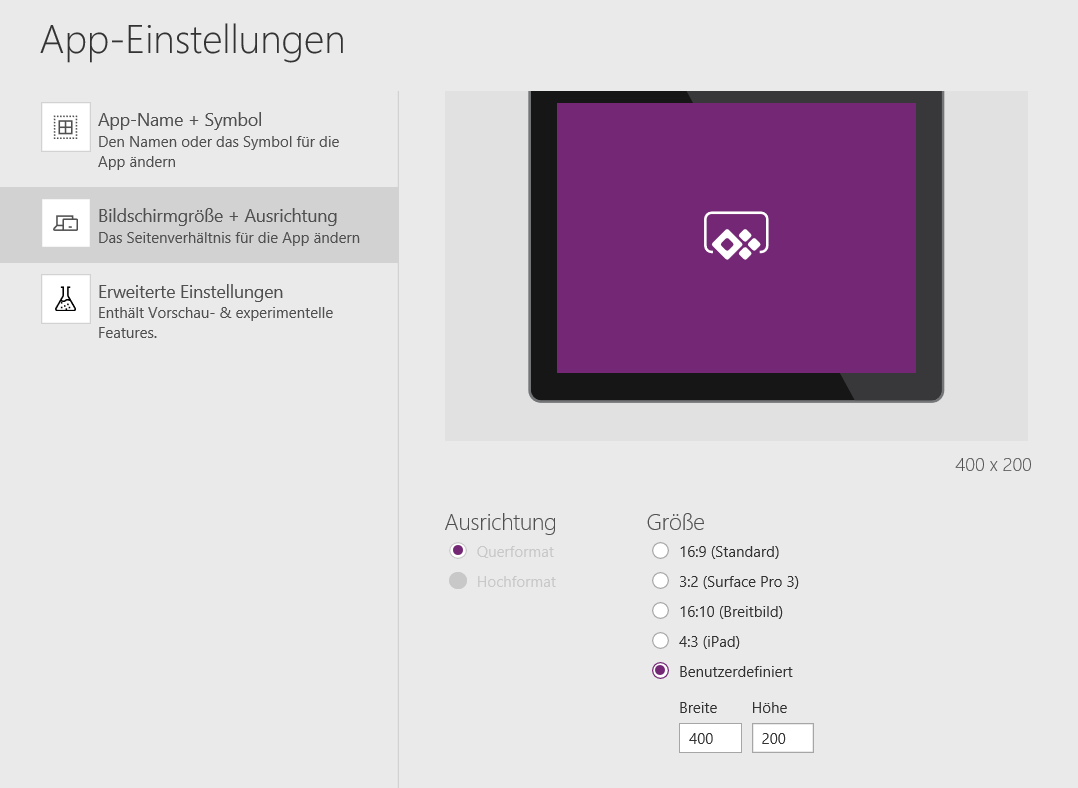
First, we create an app at https://PowerApps.microsoft.com. To make everything easy to read and to fit into the Solution layout, I opted for custom size settings: 400×200 should be fine:
Now, I paste the pie chart in the empty Screen1:
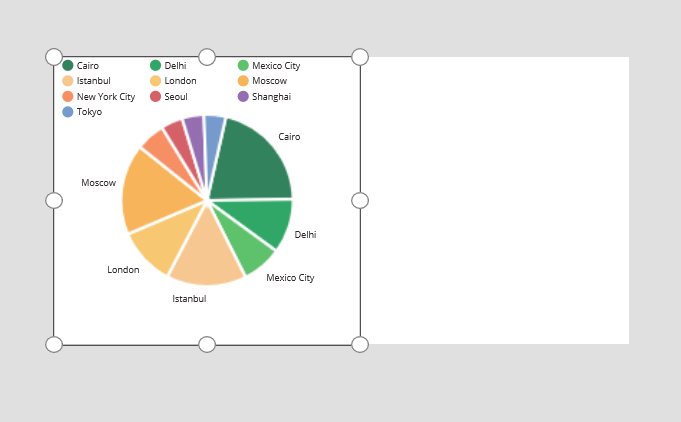
Once the size is customized, the result looks like that:
Getting data on the ticket status by low-code
And now for the data I want to display: I need an overview according to the ticket status. For this purpose, I need to know how many tickets are open, on hold or closed.
To achieve this, I create a collection in the OnVisible event that I want to link to the chart:

The code again:
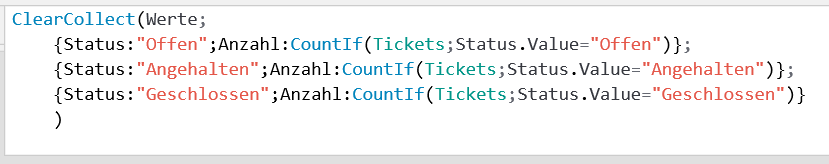
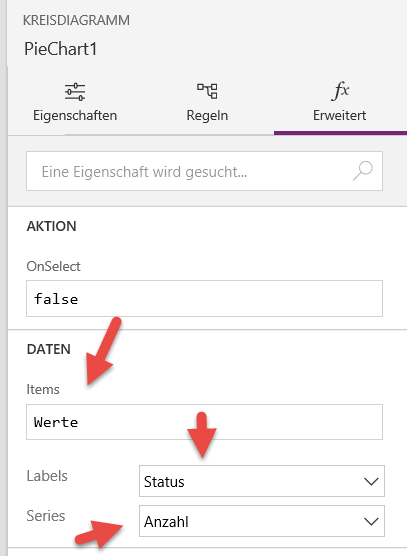
In that way, I get a collection of the numbers of tickets according to their status. And I link this collection to the chart:
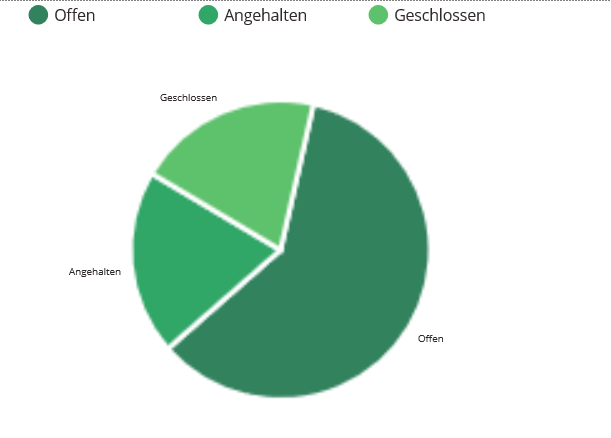
As a result, the chart displays all values:
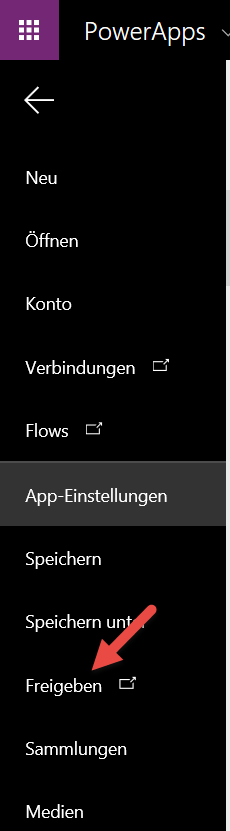
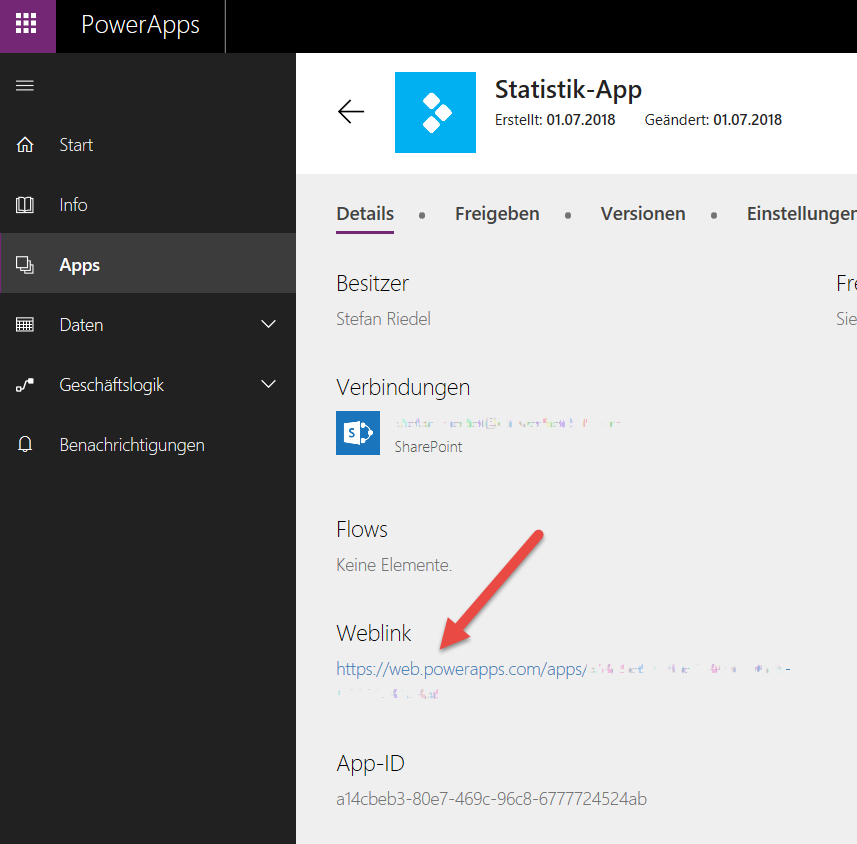
Now I save and publish everything, so that the chart can be integrated into the Skybow Solution. For this purpose, we need the web address of the PowerApp. This can be found in the details when sharing the app:
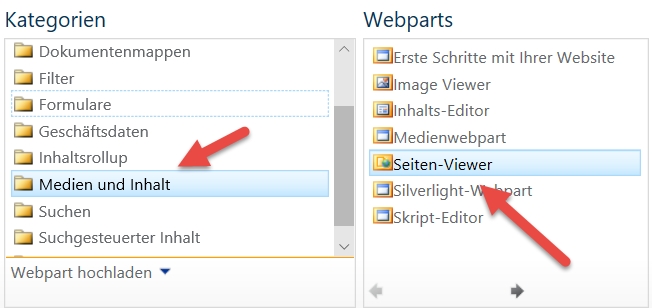
This link must be pasted in the URL field of the settings for the page viewer WebPart. But before, the WebPart needs to be pasted at the desired postiion on the page:
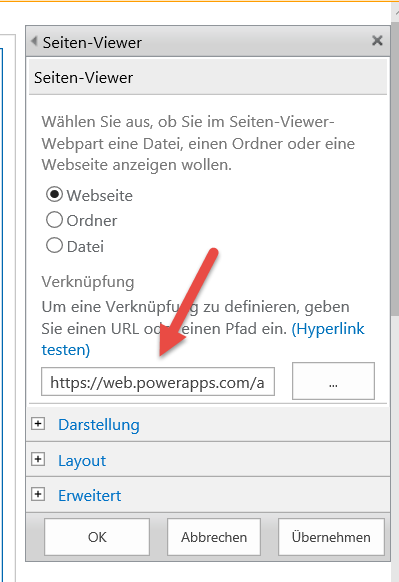
Afterwards, open the WebPart properties and enter the WebLink of the App:
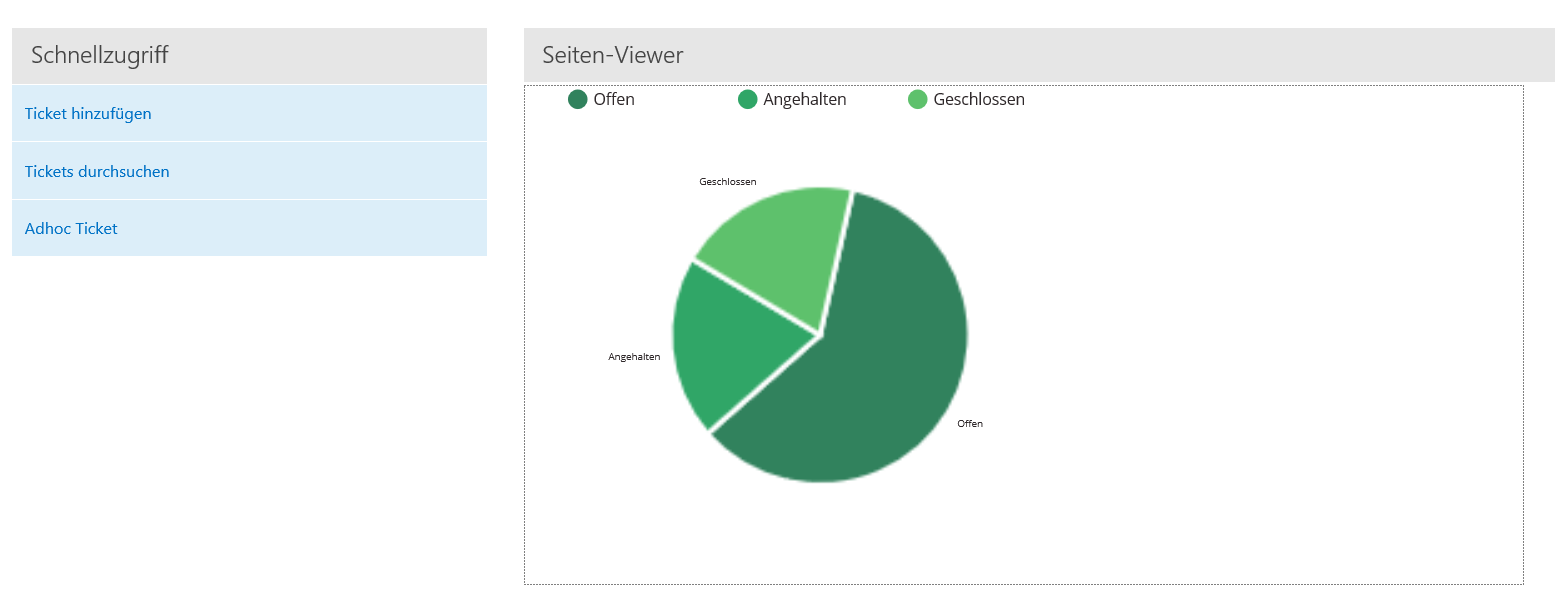
Now, the Skybow Solution is married to the PowerApp, and the desired statistics are displayed:
Other features that would be nice to have
Useful extensions for this solution would be:
- Always up-to-date usin the TimerComponent:
Normally, several users are working with a ticket system. To make sure every user sees the latest status of all tickets in his or her overview, integrating the PowerApps TimerComponent is the way to go. In that way, the chart could be updated every five minutes for example.
- Which chart do you want to see?
Offering a selection of charts would be useful for the user. This could be implemented by re-setting the items property of the chart after every selection in a drop-down or tile menu.
- The whole picture at a glance: statisticsn, burn-down charts & Co.
Darüber Moreover, in many cases the user is looking for information about the overall status of a field of work, about particular projects and team, or cross-area analyses for the leadership. For example:
- How many tickets are processed per day or week?
- How many tickets are closed per day or week?
- How many new tickets were created in a particular period?
- How long does it take before a ticket gets a new status?
- How do all these values develop during the year?
I will deliver answers in the upcoming articles.
Do you have any comments or questions? Feel free to contact me via Twitter @papariedel.
Happy low-coding 😊
P.S.: Of course, these requirements can be fulfilled in SharePoint in other ways, too. But Skybow is my favourite Framework.
Skybow Solutions mit PowerApps erweitern
(Engish version: https://wp.me/p3Vyfd-aL)
Skybow Solutions mit PowerApps erweitern
Zurzeit entwickle ich nach Feierabend mit dem Skybow Solution Builder im Office 365 ein einfaches Ticketsystem. Dabei lässt sich mit Skybow (fast) alles als Low-Code-Lösung umsetzen. Aber dann wollte ich eine Übersicht über alle Tickets und deren Status generieren.
Visualisieren wollte ich dies – analog zu Microsoft Planner – in Form eines Tortendiagramms oder Donuts. Wie viele Tickets sind offen? Wie viele sind geschlossen oder haben einen anderen Status? Diese Information wollte ich dem Nutzer auf den ersten Blick anbieten. Zudem soll der Nutzer das Diagramm schnell und einfach nach eigenen Wünschen anpassen können. Auch diese Anforderung galt es als No-Code- oder Low-Code-Lösung umzusetzen.
An dieser Stelle kam ich zunächst nicht weiter mit der Entwicklung, da ein JavaScript-Framework die einzige Lösung zu sein schien. ChartJs (https://www.chartsJS.org) wäre sicherlich das Tool der Wahl, allerdings:
- Hatte ich nach den anstrengenden letzten Wochen keine Lust mehr, nach Feierabend viel zu coden.
- Wären Anpassungen nicht mal eben per Low-Code möglich gewesen.
- Hat doch PowerApps irgendein Steuerelement, das das auch kann.
Moment mal: Geht das nicht auch mit PowerApps?
Ja, na klar 😊.
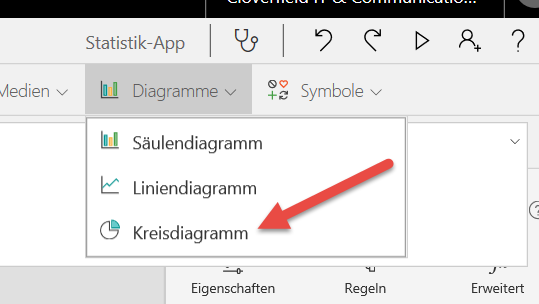
Kreisdiagramme sollten passen. 😊 Aber kann ich PowerApps überhaupt in Skybow Solutions integrieren? Ja klar:
- PowerApps haben eine Webadresse.
- SharePoint bietet ein Seitenviewer-WebPart.
- Skybow nutzt SharePoint.
- Und länger als fünf Minuten wollte ich mich gar nicht mit dem Thema aufhalten 😉
Und so geht’s:
Als erstes erstellt man unter https://PowerApps.microsoft.com eine App. Damit später alles gut lesbar ist und auch ins SharePoint-Layout passt, habe ich mich für eine benutzerdefinierte Größeneinstellung entschieden: 400×200 sollte passen:
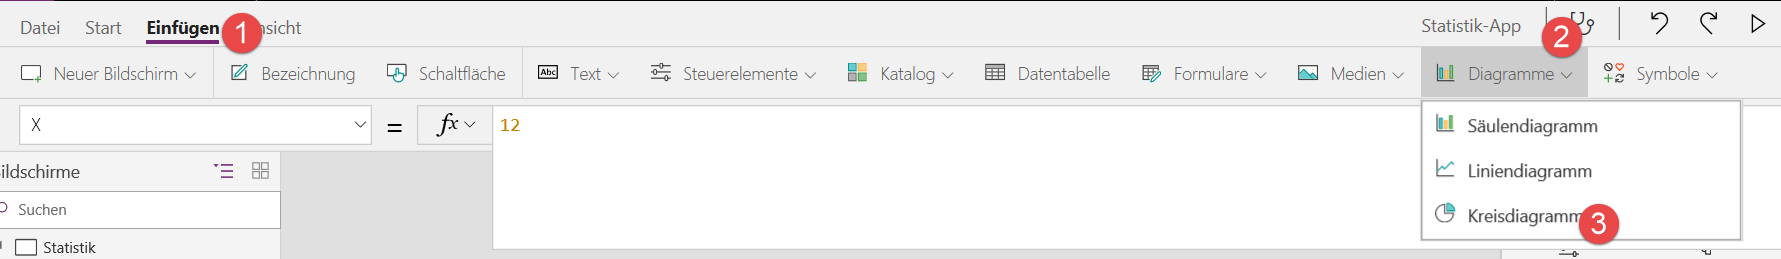
In den leeren Screen1 füge ich nun das Kreisdiagramm ein:
Hat man die Größe angepasst, sieht das Ergebnis in etwas so aus:
Per Low-Code Daten zum Ticketstatus abfragen
Und nun zu den Daten, die ich anzeigen will: Ich möchte eine Übersicht nach Ticketstatus. Dazu muss ich wissen, wie viele Tickets offen, angehalten oder geschlossen sind.
Dazu erstelle ich mir im Ereignis OnVisible eine Collection, die ich gleich an das Chart binden möchte:
Hier nochmal der Code:
Damit bekomme ich eine Collection mit den Anzahlen aller Tickets in Bezug auf ihren Status. Diese Collection binde ich nun an das Chart:
Im Ergebnis zeigt das Chart nun alle Werte an:
Jetzt noch speichern und veröffentlichen, damit sich das Chart in die Skybow Solution einbinden lässt. Dazu benötigen wir die Adresse der PowerApp. Diese findet man in den Details, bei der Freigabe der App:
Eingefügt wird dieser Link in das URL-Feld der Einstellungen für das Seitenviewer-WebPart. Zuvor fügt man jedoch das WebPart an der gewünschten Stelle auf der Seite ein:
Anschließend erfolgt der Aufruf der WebPart-Eigenschaften und der Eintrag des WebLinks der App:
Nun ist die Skybow Solution mit der PowerApp verheiratet und die gewünschte Statistik kommt zur Anzeige:
Features, die man noch wollen würde
Sinnvolle Erweiterungen für diese Lösung wären:
- Mittels TimerKomponente immer auf dem aktuellen Stand:
Mit einem Ticketsystem arbeiten in der Regel mehrere Personen. Damit jeder Nutzer in seiner Übersicht stets den aktuellen Status aller Tickets sieht, bietet sich die Integration der Timer-Komponente von PowerApps an. So ließe sich das Chart zum Beispiel alle fünf Minuten aktualisieren.
- Welches Chart hätten’s denn gern?
Benutzerfreundlich wäre zudem eine Auswahl verschiedener Charts. Dies lässt sich realisieren, indem ich nach jeder Auswahl eines Dropdowns oder eines Kachelmenüs die Items-Eigenschaft des Charts neu setze.
- Die Gesamtentwicklung im Blick: Statistiken, Burn-Down-Charts & Co.
Darüber hinaus sucht der Nutzer häufig Informationen zum Gesamtstatus eines Arbeitsbereichs, zu bestimmten Projekten und Teams oder bereichsübergreifende Analysen für die Führungsebene. Zum Beispiel:
- Wie viele Tickets werden pro Tag oder Woche bearbeitet?
- Wie viele Tickets werden pro Tag oder Woche geschlossen?
- Wie viele neue Tickets wurden in einem bestimmten Zeitraum eingestellt?
- Wie lange verbleibt ein Ticket in einem Status?
- Wie verläuft die Entwicklung dieser Werte über das Jahr?
Antworten auf diesen Fragen liefere ich in den nächsten Artikeln.
Habt Ihr Fragen oder Anmerkungen? Dann kontaktiert mich auf Twitter gerne unter @papariedel.
Happy Low Coding 😊
P.S.: Diese Anforderungen lassen sich in SharePoint natürlich auch anders realisieren. Skybow ist aber mein bevorzugtes Framework.

Du muss angemeldet sein, um einen Kommentar zu veröffentlichen.