Continuation Price Patterns vs. Reversal Price Patterns
Join our Telegram channel for daily market analysis & trading tips: t.me/synapsetrading
There are 2 categories of price patterns, mainly continuation patterns and reversal patterns.
Continuation patterns, are their name suggests, usually leads to a continuation of the prior price trend.
You are likely to see them in the middle of a trend, when the price is taking a pause, and forms a consolidation to build up the strength for the next leg of movement.
Reversal patterns, on the other hand, usually leads to a reversal or change in the existing trend.
You are likely to see them after a prolonged trend (which has a high chance of coming to an end), when the price is exhausted in one direction and is getting ready to change direction.
Do note that it is much harder to change the direction of an existing trend, hence reversal patterns tend to be larger, and take longer to form and complete.
Here is a slide which gives an overview on all the patterns and how they are classified.
Next, let’s dive straight in, and study the different types of price patterns!
Just a quick refresher, there are 2 main types of chart patterns – continuation chart patterns and reversal chart patterns.
Continuation patterns continue the existing trend,
eg. downtrend > price pattern > downtrend,
or uptrend > price pattern > uptrend;
whereas reversal patterns change the existing trend,
eg. downtrend > price pattern > uptrend,
or uptrend > price pattern > downtrend.
Table of Contents
The Trend Affects the Type of Patterns
The type of pattern that is formed generally depends on how far the trend has progressed.
If the trend is in the early stages, it tends to be stronger, so you only get small consolidation patterns, such as the bull flag, bear flag, or pennants.
If the trend is in the later stage, you start to see larger patterns, such as the rectangles and triangles (ascending triangle, descending triangle, symmetrical triangle).
The patterns highlighted in blue, such as the rectangle and symmetrical triangle, are considered neutral patterns, meaning they do not have a directional bias, and prices can break out of either side once the pattern is completed.
On the other hand, the patterns highlighted in red have a bearish bias (descending triangle, bear flag), while those highlighted in green have a bullish bias (ascending triangle, bull flag).
HOW TO TACKLE EACH CONTINUATION PATTERN
The main idea behind continuation patterns is that after the pattern is completed, the trend is expected to continue.
Hence, the best strategy involves finding continuation patterns in the middle of strong trends, and waiting for the opportunity to enter the trade once the trend resumes.
THE TREND AFFECTS THE TYPE OF PATTERNS
As we mentioned earlier in the introduction to continuation patterns, the type of pattern that is formed generally depends on how far the trend has progressed.
If the trend is in the early stages, it tends to be stronger, so you only get small consolidation patterns, while as the trend gets weaker, you start to see larger patterns.
Finally, as the trend enters the late stage, we will start to see even more trend uncertainty and volatility, which eventually leads to a reversal.
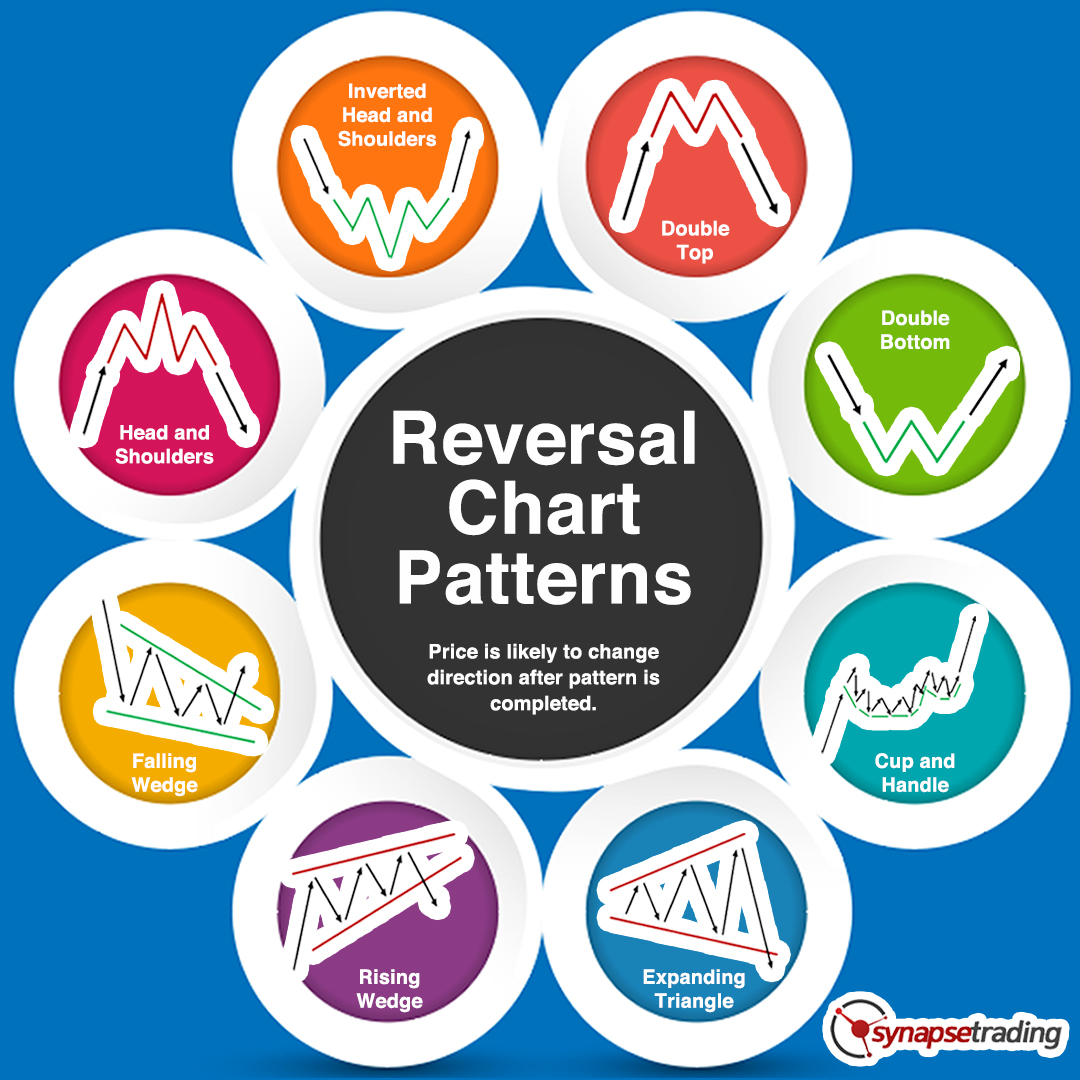
Some patterns, such as the head and shoulders pattern, will reverse and existing trend, whereas others like the cup and handle pattern kickstarts a new trend from a ranging market.
The patterns highlighted in red have a bearish bias (double top, head and shoulders, expanding triangle, rising wedge), while those highlighted in green have a bullish bias (double bottom, inverted head and shoulders, cup and handle, falling wedge).
Reversal patterns usually result in a change in the direction of the trend (bullish pattern reverses downtrend, or bearish pattern reverses uptrend), so if you see a contradicting pattern (bullish reversal pattern in an uptrend, or bearish reversal pattern in a downtrend), then the pattern you see is more likely to be a continuation pattern rather than a reversal pattern.
HOW TO TACKLE EACH REVERSAL PATTERN
The main idea behind reversal patterns is that after the pattern is completed, the trend is end, and change direction. Hence, the best strategy involves finding reversal patterns in the late stage of trends (which are exhausted), and waiting for the opportunity to enter once the current trend ends and a new one begins.

If you would like to learn all the different price chart patterns, also check out: “The Definitive Guide to Trading Price Chart Patterns”
 Our flagship mentoring program is suitable for both beginners and advanced traders, covering the 4 strategies which I used over the past 15 years to build up my 7-figure personal trading portfolio.
 If you're looking for the best trading opportunities every day across various markets, and don't want to spend hours doing the research yourself, check out our private Telegram channel!
 If you're looking for a reputable brokerage that covers all products (SG stocks, US stocks, global stocks, bonds, ETFs, REITs, forex, futures, crypto) and has one of the lowest commissions, this is what I currently use.
Spencer is an avid globetrotter who achieved financial freedom in his 20s, while trading & teaching across 70+ countries. As a former professional trader in private equity and proprietary funds, he has over 15 years of market experience, and has been featured on more than 20 occasions in the media.


Leave a Reply
Want to join the discussion?Feel free to contribute!