Imprints of Past Habitat Area Reduction on Extant Taxonomic, Functional, and Phylogenetic Composition
 Elizabeth Barthelemy
 Claire Fortunel
 Maxime Jaunatre
 François Munoz
- 1LiPhy, Université Grenoble Alpes, Grenoble, France
- 2AMAP (botAnique et Modélisation de l’Architecture des Plantes et des végétations), Université de Montpellier, Centre de Coopération Internationale en Recherche Agronomique pour le Développement (CIRAD), Centre National de la Recherche Scientifique (CNRS), Institut National de Recherche pour l’Agriculture, l’Alimentation et l’Environnement (INRAE), Institut de Recherche pour le Développement (IRD), Montpellier, France
Past environmental changes have shaped the evolutionary and ecological diversity of extant organisms. Specifically, climatic fluctuations have made environmental conditions alternatively common or rare over time. Accordingly, most taxa have undergone restriction of their distribution to local refugia during habitat contraction, from which they could expand when suitable habitat became more common. Assessing how past restrictions in refugia have shaped species distributions and genetic diversity has motivated much research in evolutionary biology and biogeography. But there is still lack of clear synthesis on whether and how the taxonomic, functional and phylogenetic composition of extant multispecies assemblages retains the imprint of past restriction in refugia. We devised an original eco-evolutionary model to investigate the temporal dynamics of a regional species pool inhabiting a given habitat today, and which have experienced habitat reduction in the past. The model includes three components: (i) a demographic component driving stochastic changes in population sizes and extinctions due to habitat availability, (ii) a mutation and speciation component representing how divergent genotypes emerge and define new species over time, and (iii) a trait evolution component representing how trait values have changed across descendants over time. We used this model to simulate dynamics of multispecies assemblages that occupied a restricted refugia in the past and could expand their distribution subsequently. We characterized the past restriction in refugia in terms of two parameters representing the ending time of past refugia, and the extent of habitat restriction in the refugia. We characterized extant patterns of taxonomic, functional and phylogenetic diversity depending on these parameters. We found that extant relative abundances reflect the lasting influence of more recent refugia on demographic dynamics, while phylogenetic composition reflects the influence of more ancient habitat change. Extant functional diversity depends on the interplay between diversification dynamics and trait evolution, offering new options to jointly infer current trait adaptation and past trait evolution dynamics.
Introduction
Alternating periods of contraction and expansion of suitable environmental conditions should affect demographic and speciation-extinction dynamics in a given habitat over time. Hence, a fundamental goal of biogeography is to better understand how changes in suitable environmental conditions due to past climatic and geomorphologic history have shaped current biodiversity patterns (Bennett, 1990). Much emphasis has been put on the impact of dramatic habitat restriction, whereby species could only persist in reduced areas called refugia (e.g., Weiss and Ferrand, 2007). Most studies so far have focused on how substantial habitat restriction in glacial refugia have shaped the genetic diversity within organisms at present (Avise, 2000). Conversely, we still poorly understand how past restrictions in refugia have influenced extant patterns for other dimensions of diversity in multi-species assemblages, a.k.a., taxonomic, phylogenetic, and functional diversity.
Here, considering the diversity of organisms making a biota in specific environmental conditions (habitat) of a given region, we examine how habitat contraction in refugia and subsequent expansion can affect these three different facets of biodiversity. Firstly, taxonomic diversity, based on the number and relative abundances of species in a local assemblage, depends on species demography (Hubbell, 2001). Changes in the area of available habitat should affect stochastic demographic dynamics, yielding greater abundance variation among species and extinction risk in smaller refugia (Figure 1). Specifically, we expect that the influence of ecological drift be greater in smaller assemblages and thus shape the relative abundances of species (Vellend, 2010; Blanchard et al., 2020). Thus, we expect demographic fluctuations to happen quickly over the timescale of habitat changes, so that extant taxonomic diversity should be more sensitive to recent than to ancient refugia. Secondly, phylogenetic diversity represents how closely related species are in a habitat according to their evolutionary history. We hypothesize that a larger biota in a larger habitat can undergo more or less frequent speciation or extinction events, respectively, and thus greater net diversification (Figure 1). Because diversification occurs at a slower pace than demographic dynamics, we expect phylogenetic diversity at present to keep a signal of ancient refugia. A greater number of old lineages could persist larger ancient refugia and have descendants in current assemblages (Bose et al., 2019). Conversely if the refuge was particularly small relative to the current assemblage size and expansion has only occurred recently, the loss of many lineages in refugia will have caused the most ancient common ancestor to be more recent (Figure 1). Indeed, the probability of sharing a common ancestor should increase in small assemblages (Patterson, 2005). Furthermore, the variation of trait attributes among extant organisms depends on how trait values have evolved across taxa in the past (Pearse et al., 2019). Specifically, assuming that species sharing greater common history have more similar phenotypes, we can account for the tempo of trait evolution to predict the functional composition of assemblages having undergone a common demographic history that shaped long-term diversification events (Revell et al., 2008). The speed of trait evolution could indeed have changed and depended on when and how adaptive radiations happened and shaped trait diversification over time in a given habitat (Bartish et al., 2016; Harmon, 2019). Therefore, extant patterns of trait diversity should differ depending on the pace and the timing of trait evolution. The extent of trait variation in descendants should depend on both trait evolution rate and the size of the biota over time (Figure 1). Specifically, if greater trait evolution occurs during strong habitat restriction, trait diversity among descendant lineages would be reduced.
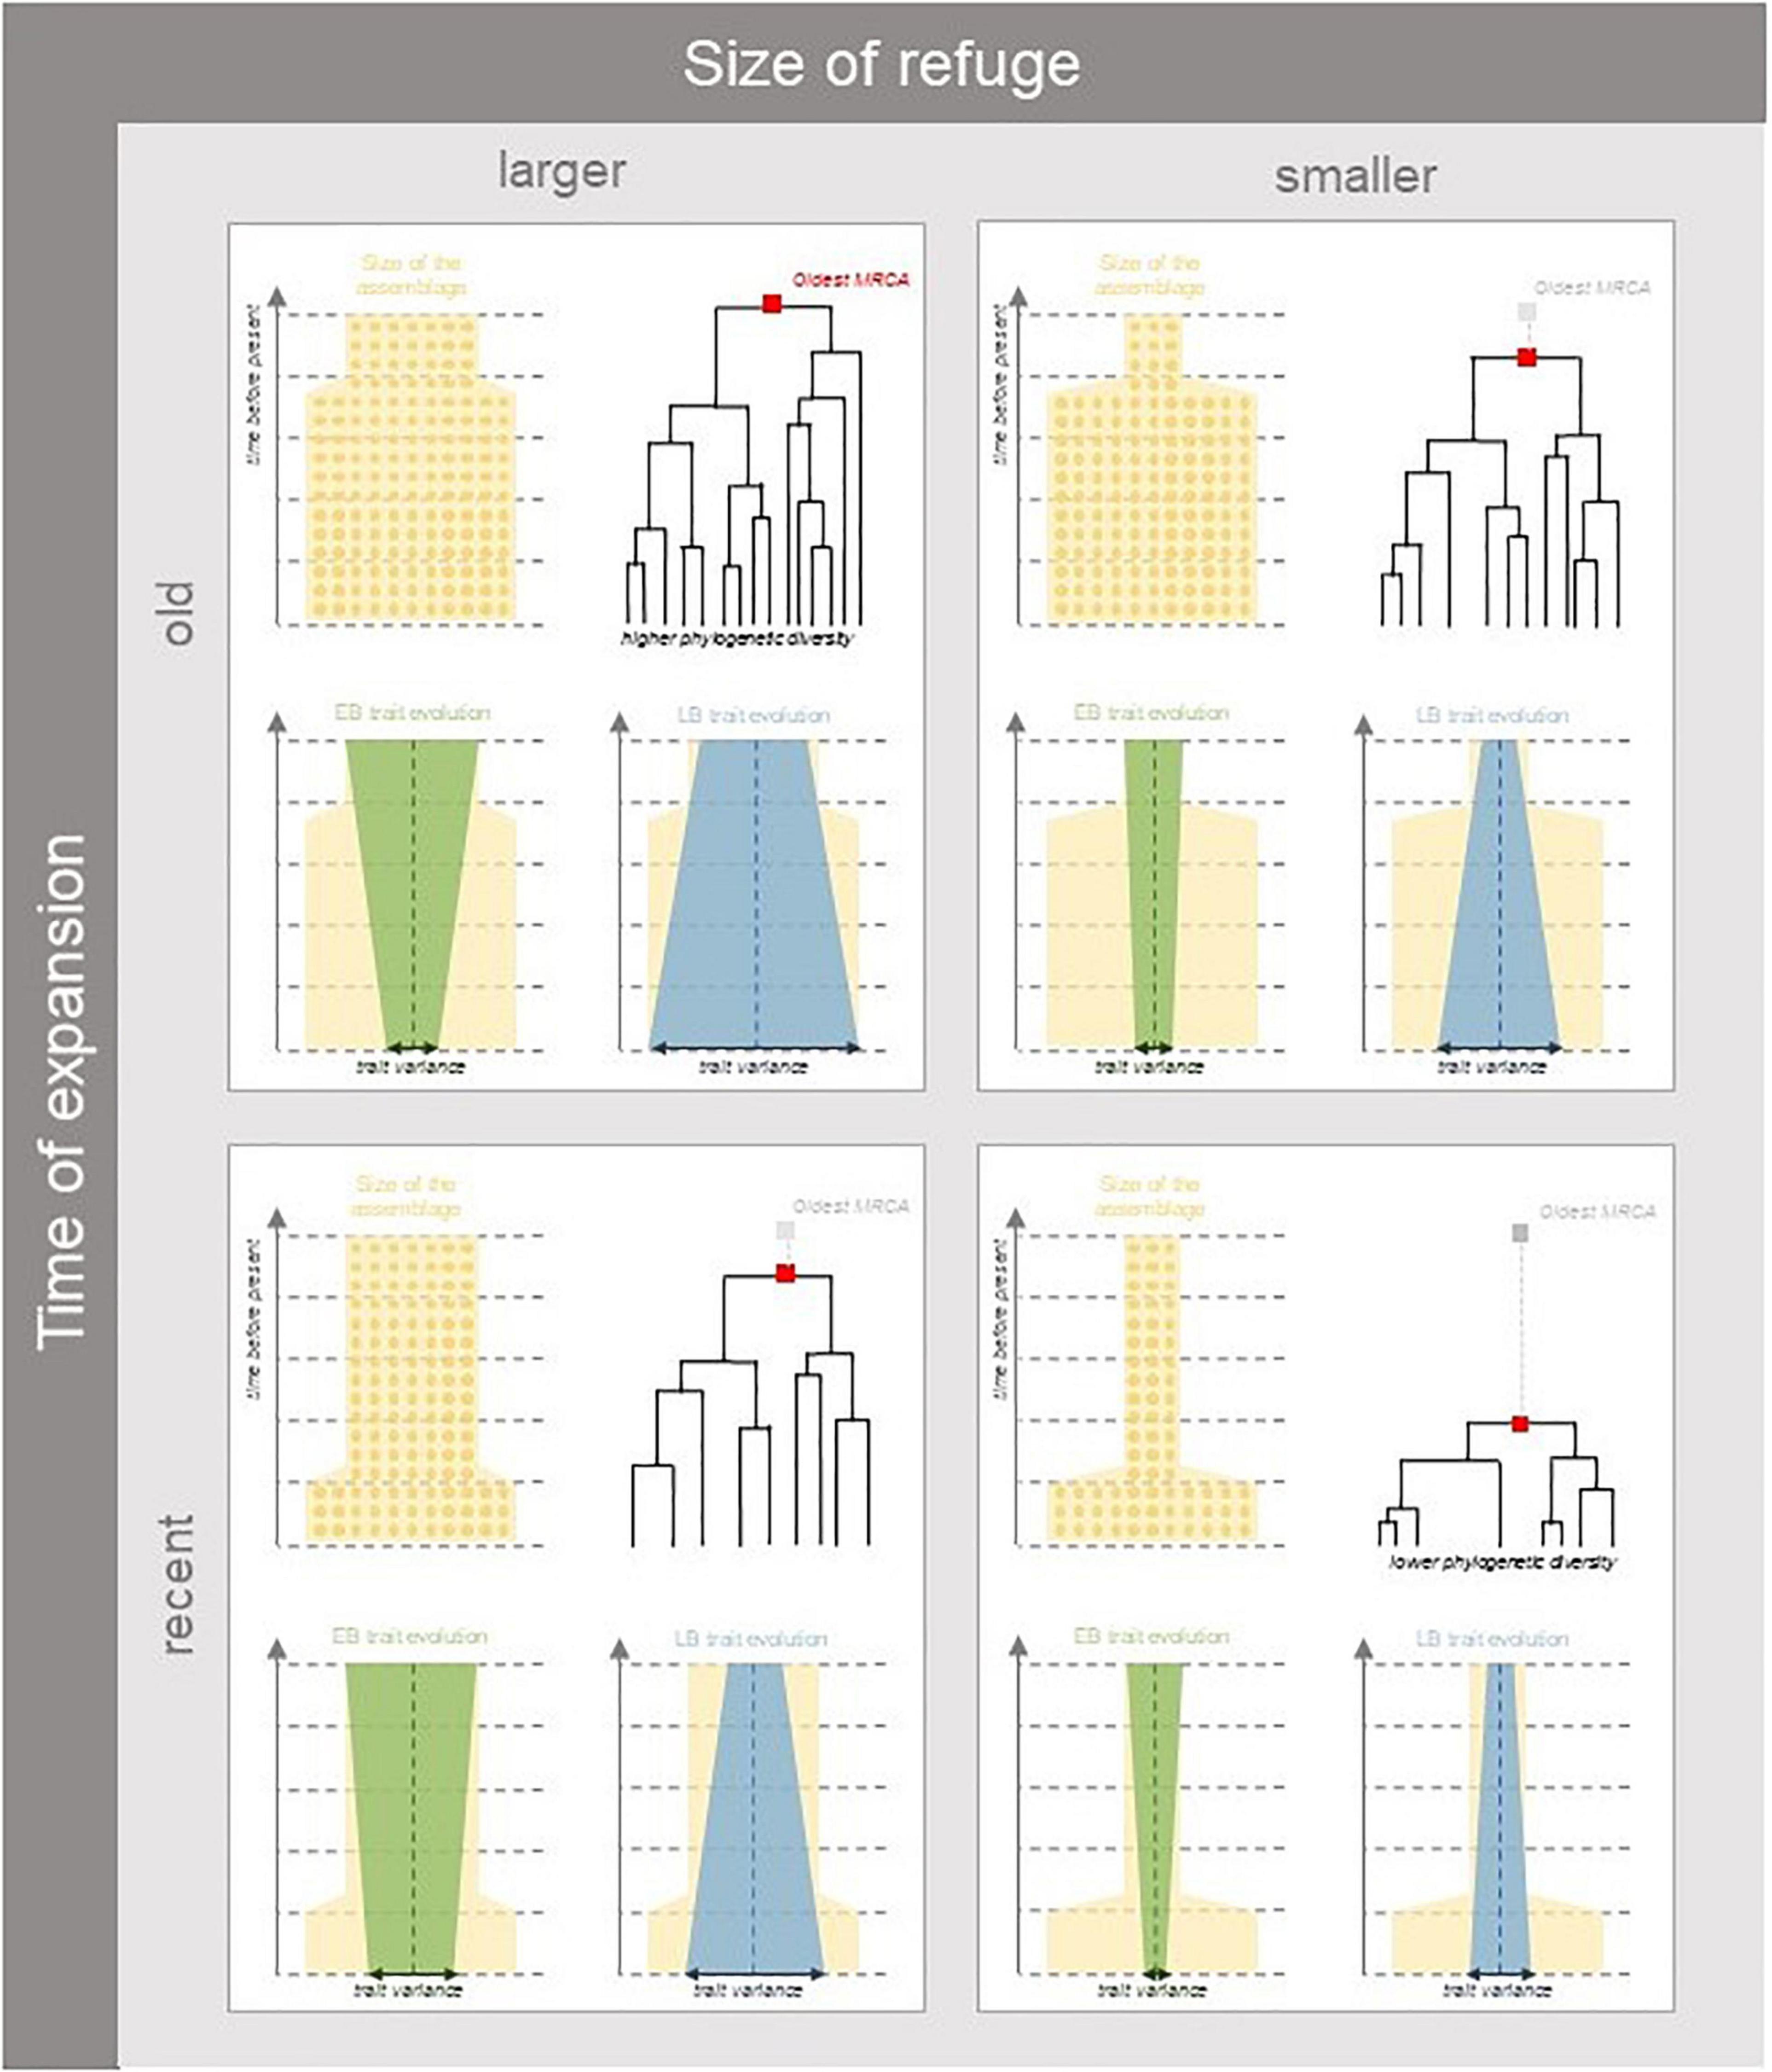
Figure 1. Expected patterns of taxonomic, phylogenetic, and trait diversity under different scenarios of habitat expansion following a period with restricted refugia. Yellow shaded areas represent the size of suitable habitat conditioning the number of individuals over time (represented as circles). The size of the assemblage instantaneously increases at a given time (parameter tc) so as to represent habitat expansion (parameter A). Current patterns of diversity will depend on how restrictive past habitat sizes were relative to present (left vs. right panels) and how long assemblages have spent in refugia (top vs. bottom panels). In larger refugia lower extinction rates allow more species in older lineages to persist in extant assemblages, while in smaller refugia more species will be lost to the increased influence of drift. Functional diversity will depend on the pace and timing of trait evolution in relation to diversification events. Trait evolution can deviate from the ancestral trait values (vertical dashed lines), and can experience exponential deceleration (Early Burst—EB represented in green) or acceleration (Late Burst—LB represented in blue), the resulting patterns of functional diversity will depend of whether acceleration or deceleration of trait evolution happens in or out of refugia. For example, if greater trait evolution occurs during strong habitat restriction, trait diversity among descendant lineages would be reduced.
The taxonomic, phylogenetic and functional facets of biodiversity are thus influenced by the interplay of historical variation in habitat area and past evolutionary dynamics. These three facets thereby convey complementary insights into population dynamics, evolutionary diversification, and trait evolution. To understand how past contraction in refugia and subsequent expansion of a habitat can affect taxonomic, phylogenetic and functional diversity, we propose an eco-evolutionary model explicitly representing the basic processes at play. First, we devise a genealogical model of population dynamics depending on the temporal variation in habitat area (Figure 2A). The model reconstructs past co-ancestry in the genealogy of extant individuals, using coalescent theory (Wakeley, 2009). We represent habitat restriction in past refugia with two parameters: one representing the ending time of refugia with subsequent and instantaneous expansion until present, and the other the extent of habitat restriction in the refugia (ratio of refugial area compared to present). Second, we model evolutionary diversification and phylogenetic relationships based on the genealogical structure. We group extant individuals into distinct species under a model of point mutations and protracted speciation of monophyletic genetic groups (Manceau et al., 2015; Figures 2B,C). Third, we model alternative scenarios of trait evolutions in the phylogeny, yielding extant trait composition. To represent different historical trajectories in trait evolution, we define the rate of trait variation in descendants along the phylogeny as either constant (Brownian motion), greater in older time (early burst), or greater in recent time (late burst). Different paces of trait evolution can be considered to reflect evolutive radiations concurring or not with lineages diversification brought about by demographic expansions (Figure 2C).
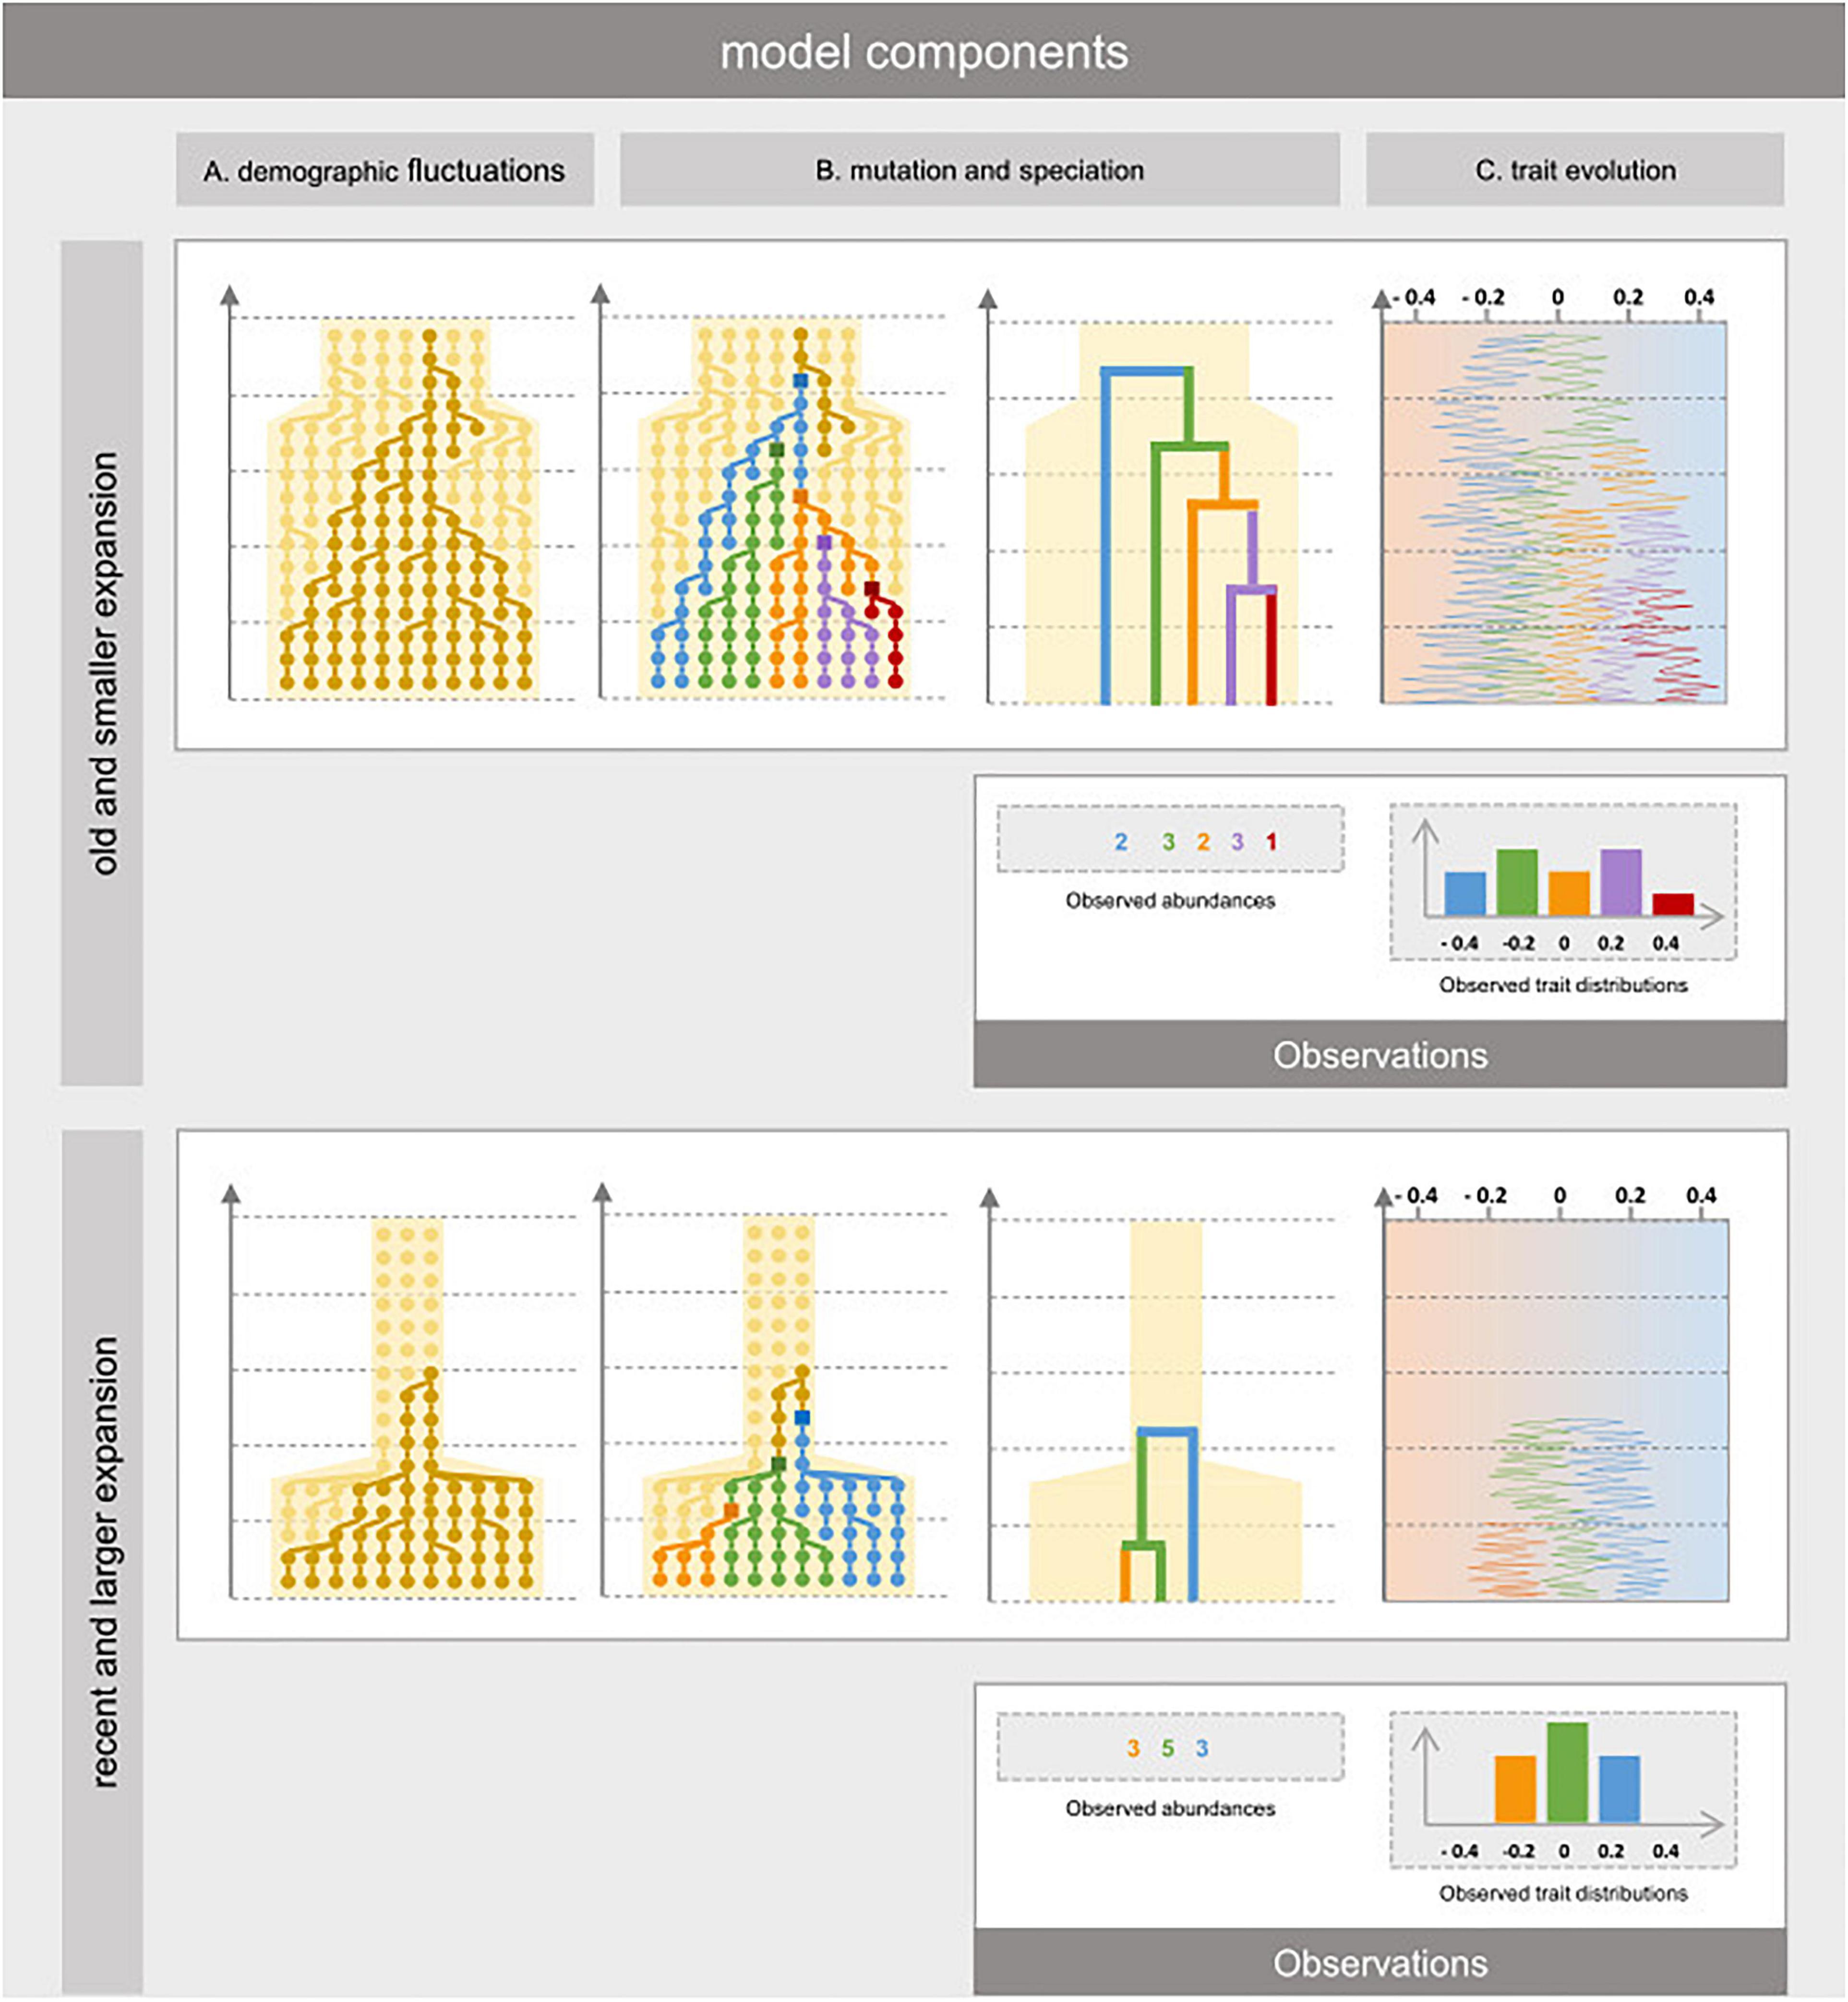
Figure 2. Eco-evolutionary dynamics of individual organisms in a habitat that experienced reduction in the past. The model relies on three components. (A) The population component reconstructs the effect of habitat expansion on the past co-ancestry in the genealogy of extant individuals, using coalescent theory without assuming to which species they belong to. (B) The evolutionary component represents how divergent genotypes have made new species over time. It is modeled by first sprinkling mutation events over the simulated genealogy conditionally its branch lengths. Then, the phylogenetic relationships amongst individuals and their abundances are obtained by merging paraphyletic clades into single species depending on the topology of the genealogy. (C) The trait evolution component is modeled using Brownian motion (BM), Early Burst (EB) of Late Burst (LB) along the simulated phylogeny and represents how species niches may have changed over time and at which pace. We represent two extreme scenarios: small demographic expansion (relative to refugia) that occurred long ago (top) and important habitat expansion that occurred recently (bottom) and how these have led to different patterns of taxonomic, phylogenetic, and functional diversity.
Here, we design a virtual experiment to examine how increases in favorable habitats following refugia influence taxonomic, phylogenetic and functional diversity. To this end, we explicitly simulate the demography of assemblages, the emergence of new species, their phylogenetic relationships and associated trait values.
Materials and Methods
Simulating Phylogenies and Trait Values in Extant Assemblages
In our model, fluctuations in the relative species abundances in a given habitat are driven by neutral drift dynamics, depending on the global size of the assemblage (Hubbell, 2001). Regardless of which species these individuals belong to, the dynamics of the assemblage they form can be represented by coalescence, i.e., by tracing the shared co-ancestry of extant individuals backwards in time until a single common ancestor is found (Kingman, 1982). Only the ancestry of individuals observed at present is traced back, so that coalescent methods do not require simulating lineages with no extant descendants and are thereby much faster than their forward-in-time alternatives (Munoz et al., 2018). Thus, without assuming to which species each individual belongs, we simulated the genealogies of individuals in an assemblage with constant size, and modeled the effect of habitat expansion on coalescence events following a period with restricted refugia (Figure 2A; Hudson, 2002; Kelleher and Lohse, 2020). We modulated both the amplitude of habitat expansion (A) and the time elapsed since expansion began (tc), so as to simulate genealogies covering a wide range of refugia age and habitat expansion scenarios (Table 1).
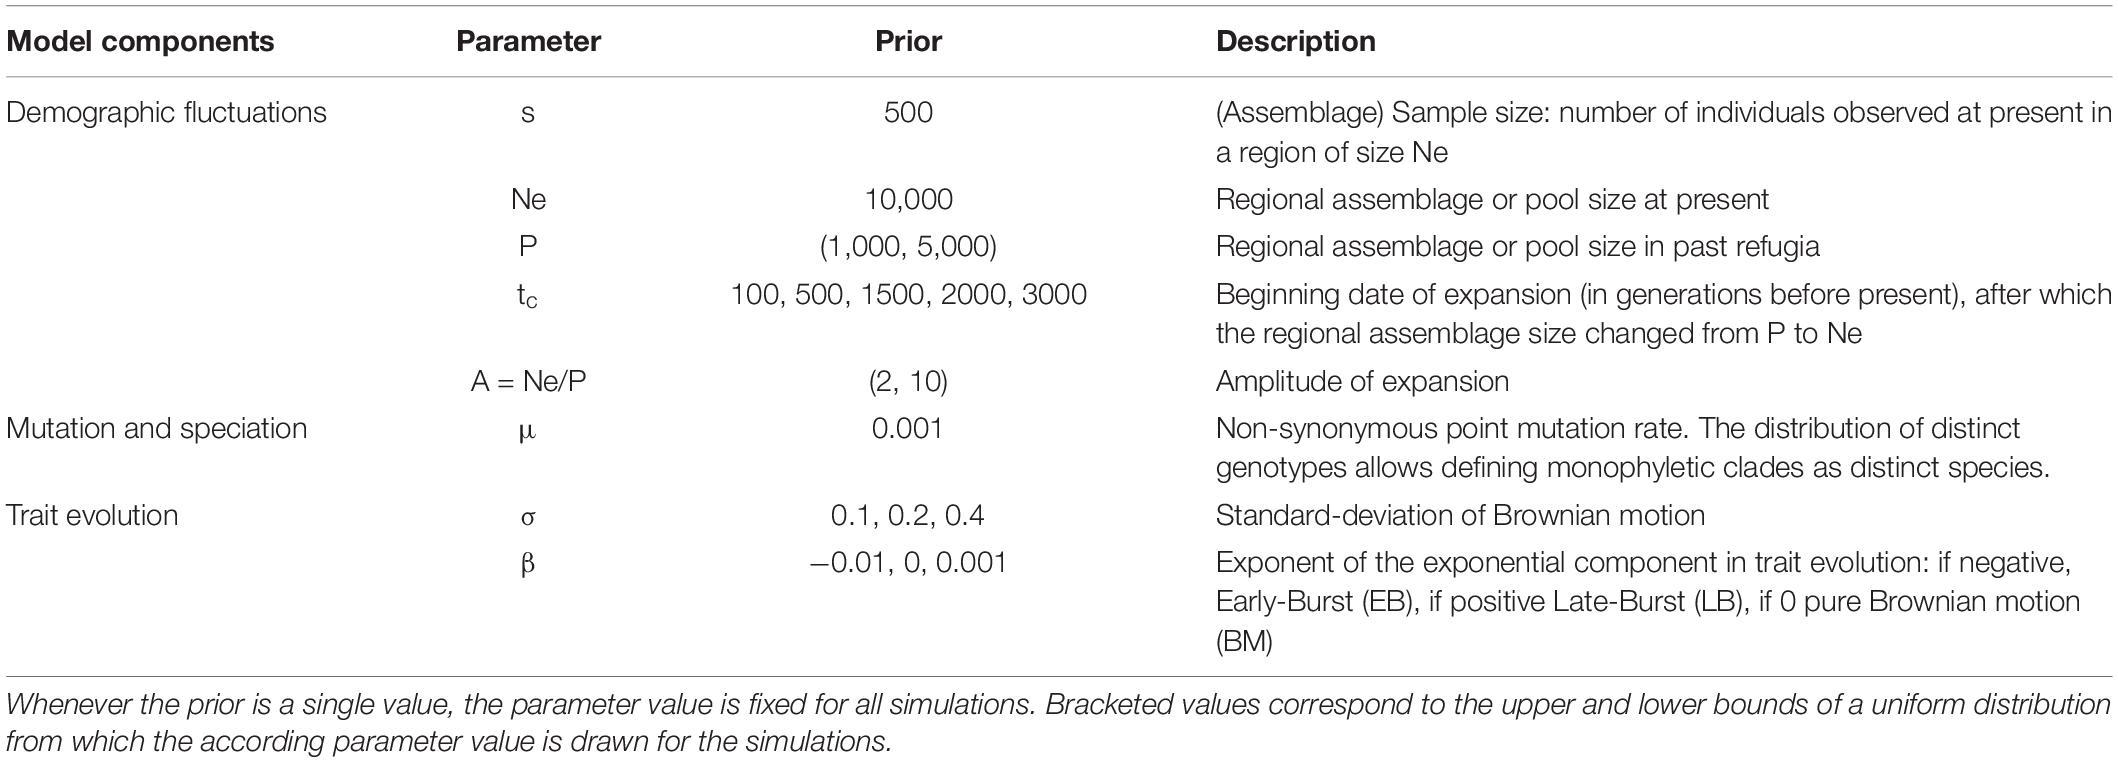
Table 1. Model parameters and their prior distributions used to simulate species assemblages, the phylogenetic relationships, and trait values.
We sprinkled speciation events over the simulated genealogies (Figure 2B). The probability that a mutation occurred on a specific branch, leading to a new variant individual, followed a Poisson distribution with parameter μ∗B, where μ is the point mutation rate (Table 1) and B the length of the branch. Descendant lineages of mutated individuals formed new clades that, if paraphyletic, were merged to form species (Manceau et al., 2015), thus monophyletic lineages with distinct genotypes and older than two generations were considered a new species (Figure 2C). We derived the number of individuals descending from a speciation event which gave us both the relative abundances of species and their phylogenetic relations to one another. Note that the point mutation rate is fixed for all simulations and thus the time scale (in generations before present) should be considered relative to μ. Additionally, any effect of expansions following periods with restricted refugia will depend on how parameter μ and the date of expansion are related. Indeed, if too few diversification events should happen during later expansion phases, as they may if μ is particularly small, we expect there to be little if not any signature in extant functional and phylogenetic diversity.
We simulated alternative models of trait evolution on the simulated phylogenies (Figure 2C), using the mvMORPH package in R (Clavel et al., 2015). We considered three models of trait evolution from an ancestral value set to 0 (Table 1). In the first model, traits evolved from their ancestral state following a pure Brownian motion (BM), with a variance parameter σ set either to 0.1, 0.2, or 0.4 to represent varying speed of trait evolution. In the second model, trait evolution exponentially decelerated with time (β = -0.01) following an Early Burst (EB). The third model represented Late Burst (LB) trait evolution, with exponential acceleration (β = 0.001).
We simulated 1,000 phylogenies for every past change date (5,000 in total), in which the model parameter values varied uniformly within above-mentioned limits (Table 1). We summarized the amplitude of the demographic expansion by parameter A, which reflects how much smaller the refuge was in the past before the favorable habitat expanded to its current and fixed size. Then, trait evolution was simulated with 100 replicates along each phylogeny according to the 9 parameter combinations given in Table 1.
Characterizing Extant Taxonomic, Functional, and Phylogenetic Diversity
We investigated the influence of the parameters of past expansion (A, tc) on three different facets of extant biodiversity. We characterized taxonomic diversity by means of (i) species richness, and (ii) species frequencies spectra (SFS). The SFS represented the number of species by octaves of abundance class, and we performed a principal components analysis (PCA) (Lê et al., 2008) to summarize the variation of SFS across simulations. Similarly to using allelic frequency spectra in population genetics to infer population history (Marth et al., 2004), we expected the SFS to retain the signature of past demographic fluctuations (here, periods of habitat restriction) that caused more important drift dynamics affecting species relative abundances in smaller assemblages.
We used complementary metrics of phylogenetic diversity to characterize the evolutionary history of extant species of the assemblage. We quantified (i) Phylogenetic Diversity (PD), (ii) Mean pairwise distance (MPD), and (iii) Mean Nearest Taxon Distance (MNTD) using the picante package (Kembel et al., 2010). MPD is expected to be more sensitive to ancient and MNTD to recent diversification events (Mazel et al., 2016). Additionally, we used the approach described in Lewitus and Morlon (2016) implemented in the RPANDA package (Morlon et al., 2016) to derive the ln-transformed principal eigenvalue (λ∗) and skewness (ψ) of the Laplacian spectral density profiles of phylogenies. These summary statistics quantified phylogenetic expansion and stem-to-tip distribution of branching events, respectively. Taxonomic and phylogenetic metrics of diversity were related to parameters of demographic expansion (parameters A and tc) using linear regression models. To evaluate the relative effect of species richness from those of the parameters used to simulated demographic expansions, we used linear models between (i) the residuals of a linear model relating phylogenetic metrics to species richness and (ii) the parameters of demographic expansion. Linear models were fitted using the generalized least squares (GLS) method from the nlme package in R. In the case of PD and the MRCA, allowing the variance to increase with species richness yielded better AIC values when compared to simple linear regressions.
Finally, functional diversity was characterized by the first two moments of the simulated trait distributions (mean and variance) (Fortunel et al., 2014) given each phylogeny and given each trait evolution model parameter combination σ and β.
All simulations were conducted using Python version 3.7.4 (Python Software Foundation) and subsequent analyses performed using the R (3.6.3) statistical platform (R Core Team, 2020).
Results
Taxonomic Diversity
Simulated species richness decreased when the refugia was more restricted compared to current assemblage size, and it did so even faster for more recent changes (Figure 3). We obtained maximum species richness for oldest demographic expansion (i.e., 3,000 generations ago). When the refugia was more ancient, the restrictedness of the refugia did no longer influence extant species richness.
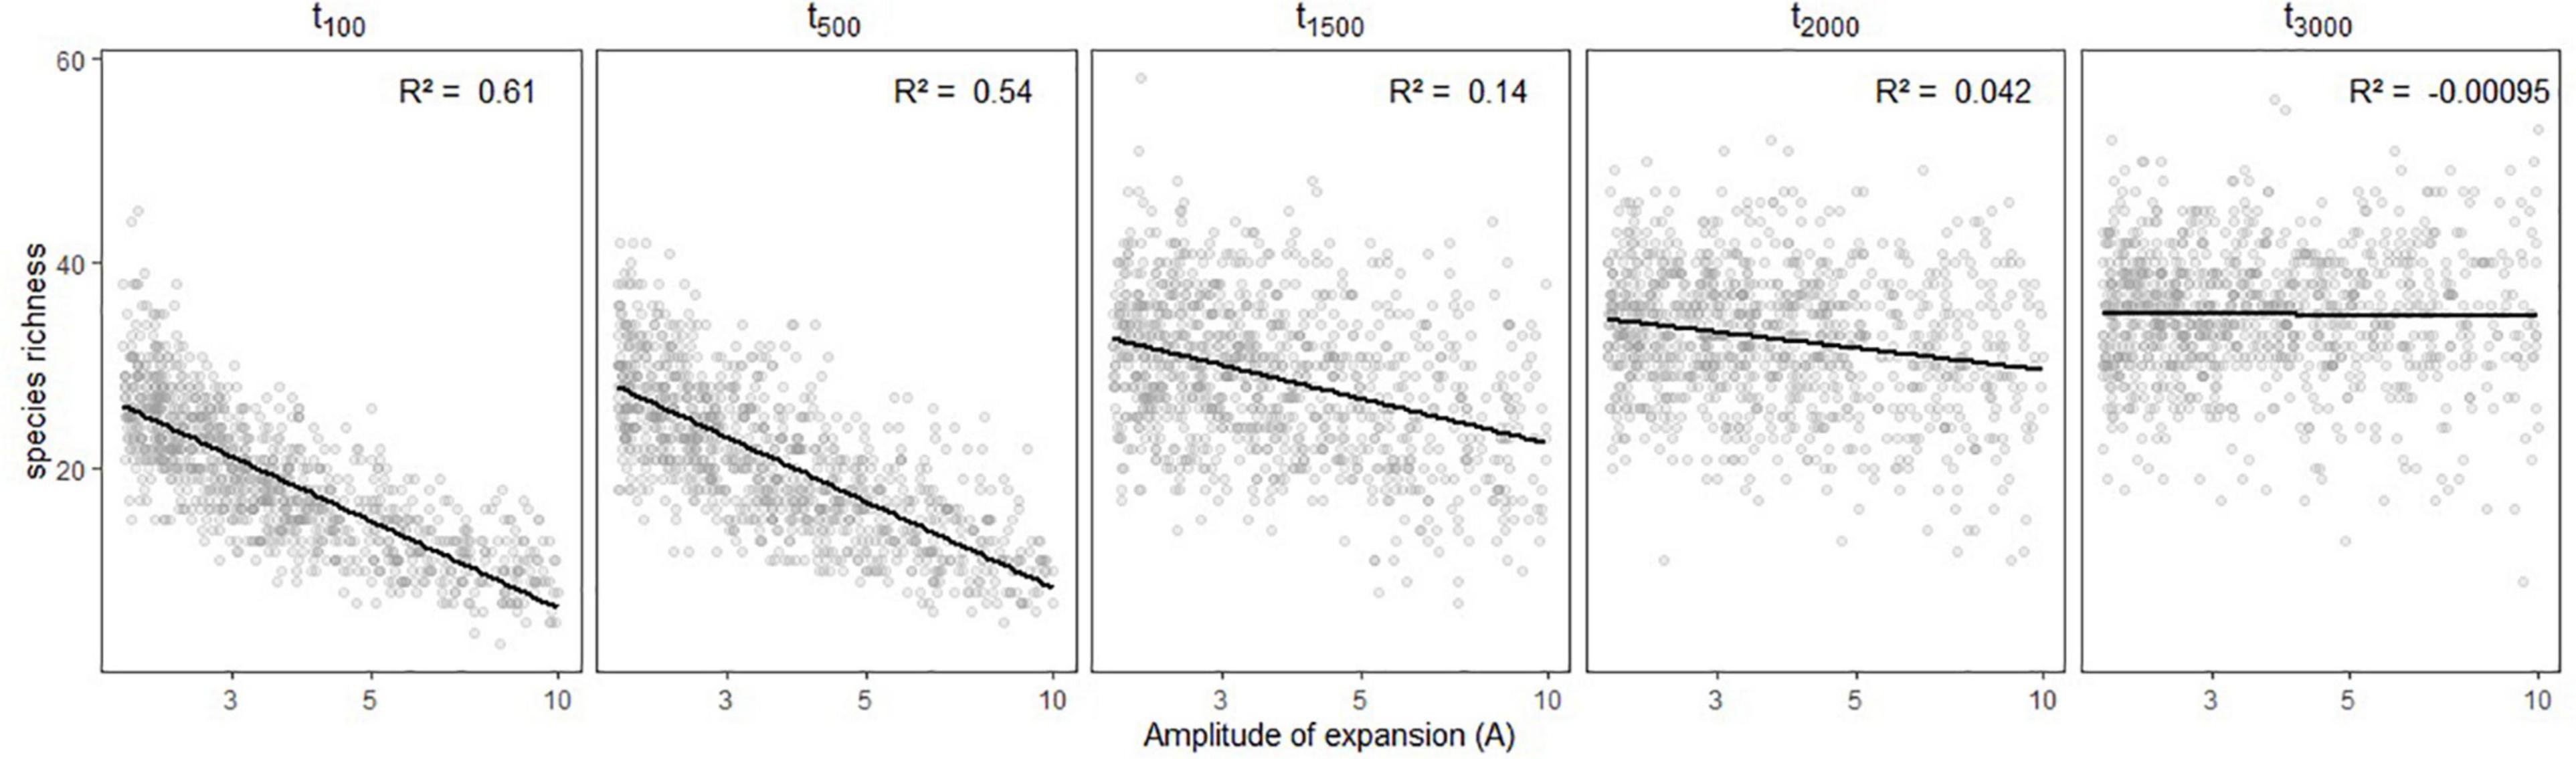
Figure 3. Variation in simulated species richness depending on the amplitude of expansion (A) and the time (in generations) at which it occurred (tc). Linear regressions are shown in black with the associated R2 statistic in the upper-right side of each panel.
The first PCA axis captured 44% of SFS variation and opposed the classes of lowest abundance to classes of intermediate abundance. PCA scores along the first axis were strongly related to species richness (R2 = 0.88), and likewise decreased with the amplitude of expansion (Figure 4D). Yet, depending on how ancient the end of refugia was, the amplitude of subsequent expansion did not affect the abundance classes equivalently. Positive PCA scores along the first axis indicated assemblages with many rare species (Figure 4A). Such assemblages were mostly simulated when expansions occurred more than 1,500 generations ago (Figure 4D). Negative PCA scores along the first axis indicated assemblages with greater frequency of common species which, conversely, happened mostly when expansions occurred more recently (less than 500 generations ago). The second axis captured 17.2% of SFS variance and was mostly carried by the largest abundance class, representing assemblages with 0, 1, or 2 hyperabundant species (Figures 4B,C). For changes predating 2,000 generations, the number of abundant species increased with the amplitude of expansion and was maximal for 1,500 generations (Figure 4E).
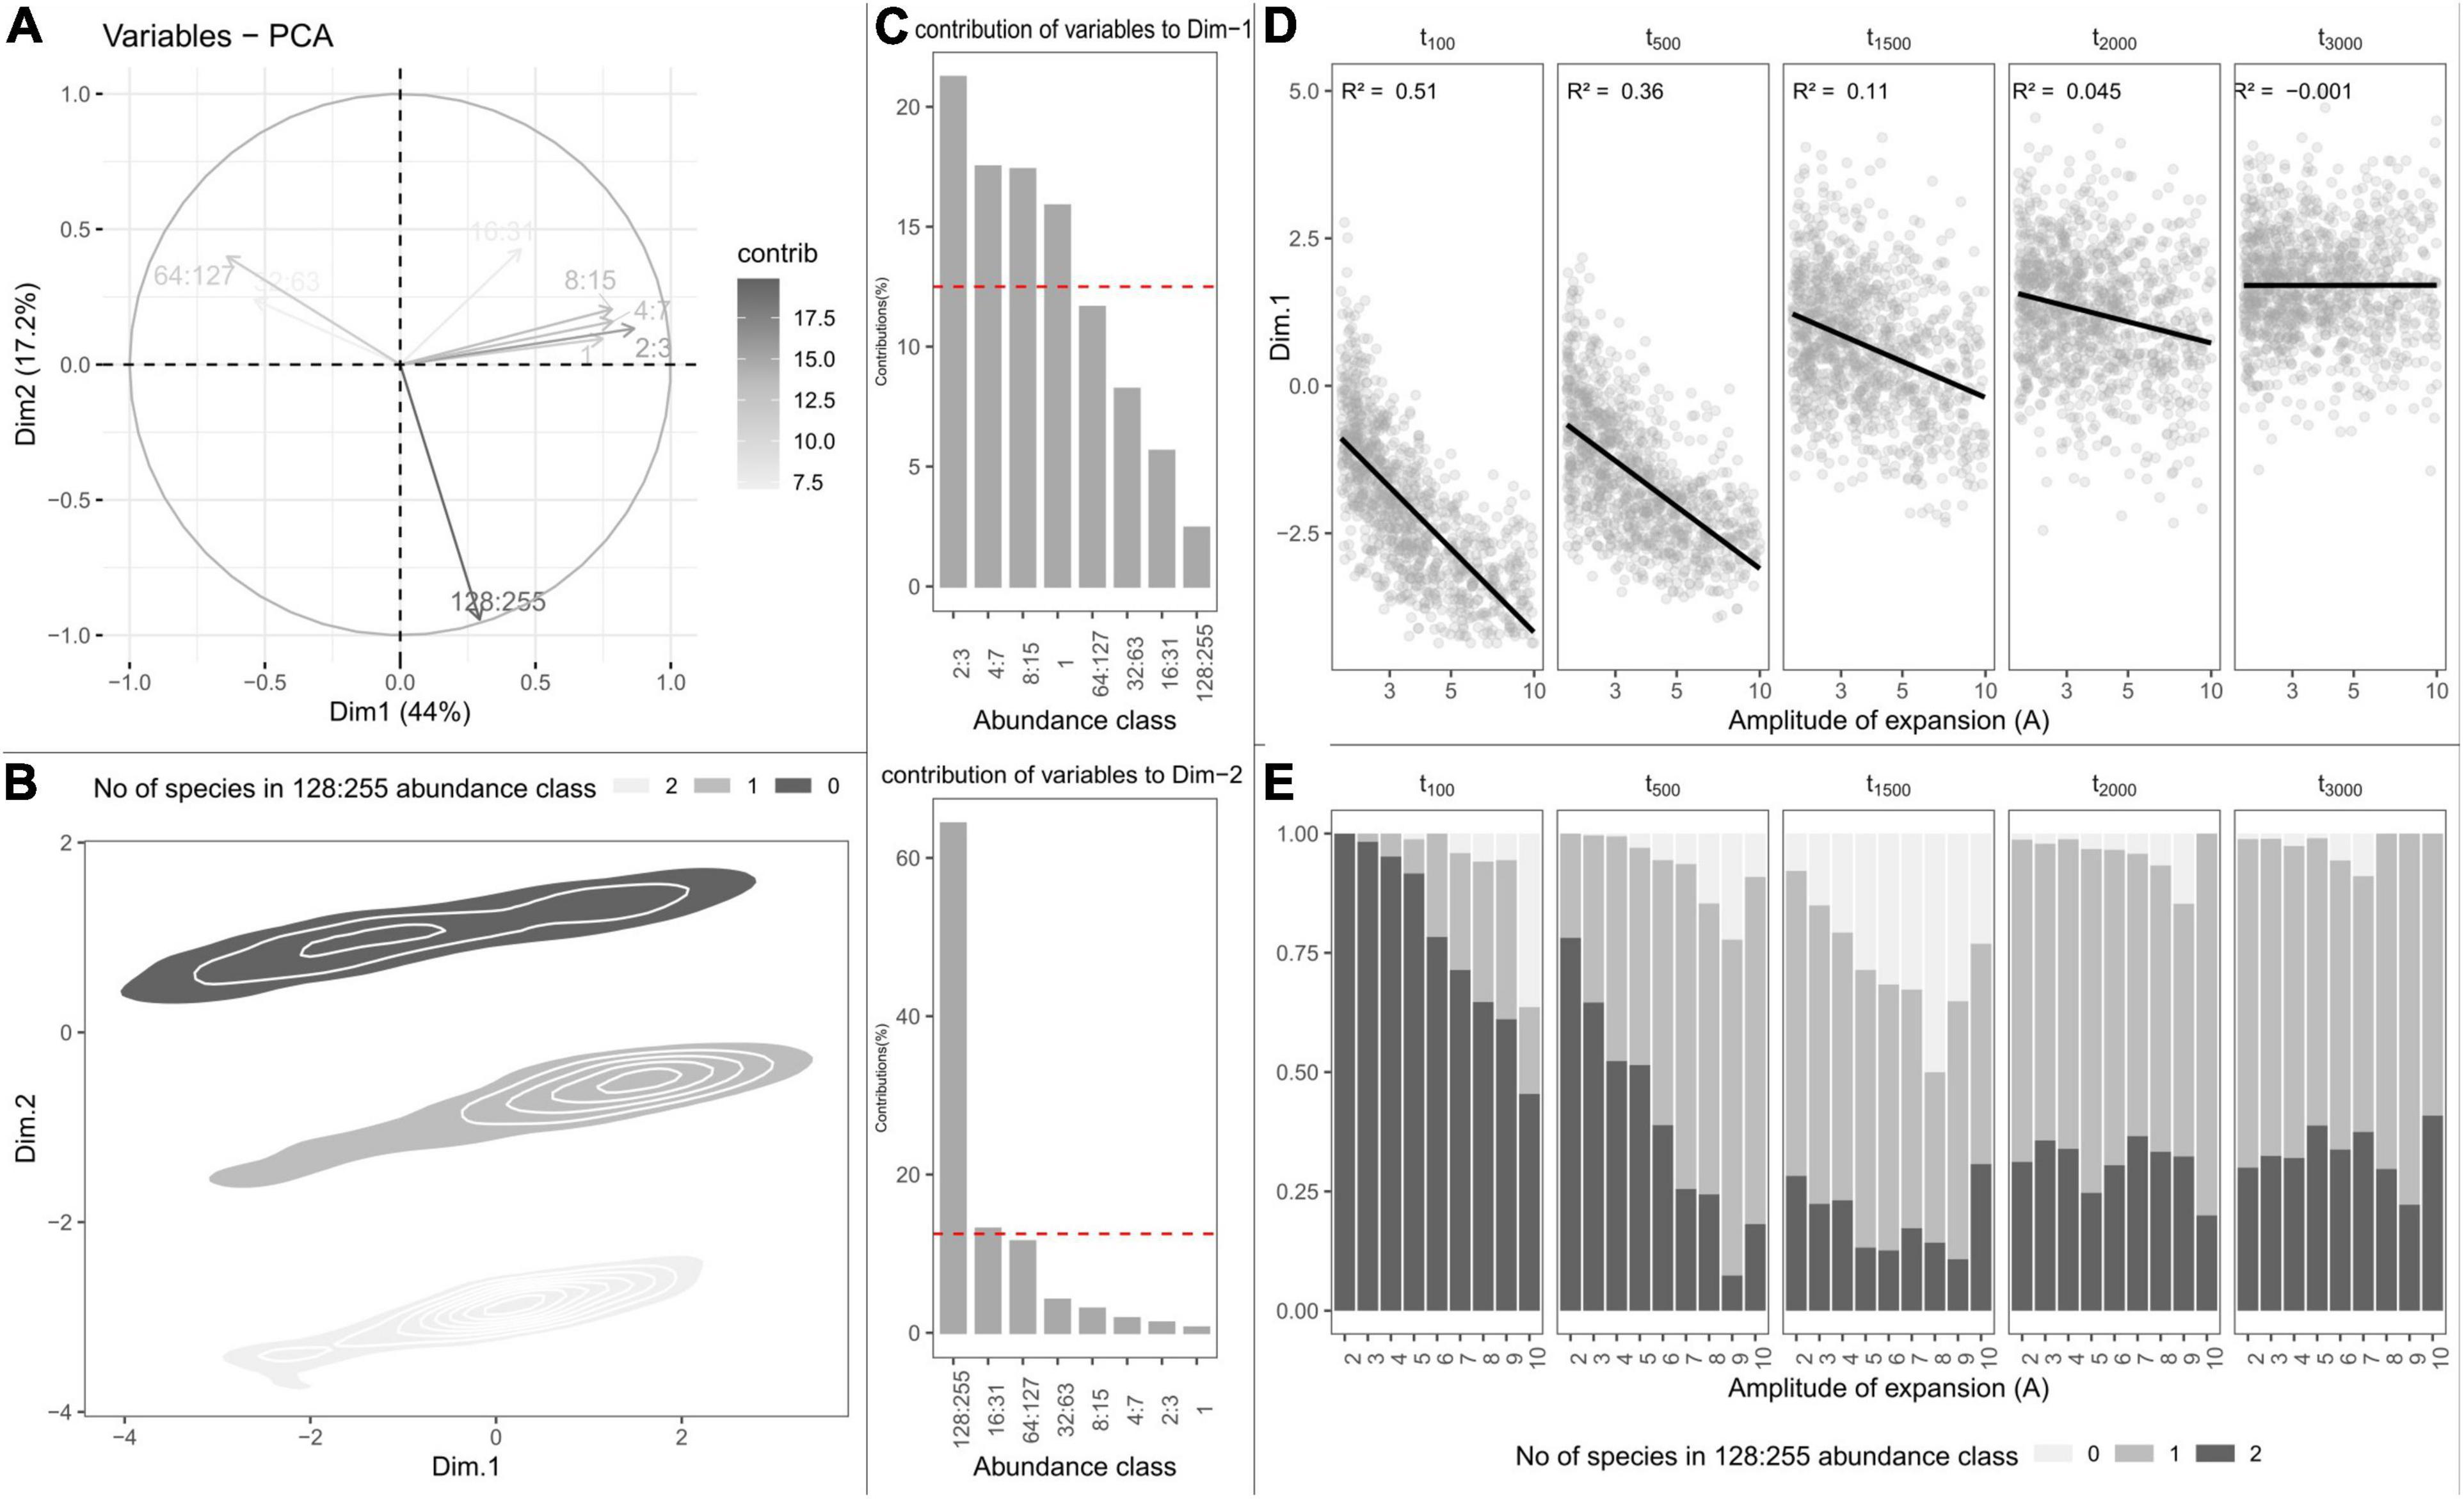
Figure 4. Principal component analysis (PCA) on the simulated species frequency spectra (SFS). (A) Correlation circle showing the contributions of SFS abundance classes to the two first PCA axes. (B) Individual PCA scores projected onto the two first dimensions of the PCA and clustered according to the number of species in the most abundant abundance class. (C) Contributions of SFS abundances classes to the first (top) and second (bottom) axes of the PCA. (D) Variation in PCA-scores along the first dimension depending on the amplitude of expansion (parameter A) and the time (in generations) at which expansion occurred (parameter tc). Linear regressions are shown in black with the associated R2 statistic in the upper-left side of each panel. (E) Variation in the number of points with, respectively, none, one, or two hyperabundant species depending on the amplitude of expansion (parameter A) and the time (in generations) at which expansion occurred (parameter tc).
Phylogenetic Diversity
We found that phylogenetic diversity (λ∗, Faith’s PD, MPD, and the age of the MRCA) decreased overall with the amplitude of expansion—i.e., when the refuge relative to present was smaller, and did so more rapidly for recent change (see Figures 5A–C, 6). The ln-transformed principal eigenvalue λ∗ correlated positively to PD, MRCA, MPD, and species richness (Supplementary Figure 2), and thus larger λ∗ values were indicative of lengthy older rooted phylogenies with many lineages and greater overall phylogenetic diversity (Lewitus and Morlon, 2016). We found strong linear relationships between (i) the residuals of the regressions between phylogenetic metrics and species richness and (ii) the parameters of demographic expansions (all R2 greater than 0.68; Supplementary Figure 1). This suggests that despite the influence of species richness on phylogenetic metrics of diversity, the latter still carried the signature of past demographic expansions. On the other hand, MNTD did not significantly vary along parameters of demographic change (Figure 5D), even when accounting for the influence of species richness. The density profile skewness ψ was always positive, which indicated stem-to-tip asymmetry favoring terminal branching events. ψ values increased with the amplitude of expansion (i.e, when the size of refugia decreased relative to present) and reached higher values when expansions occurred long ago (Figure 6B).
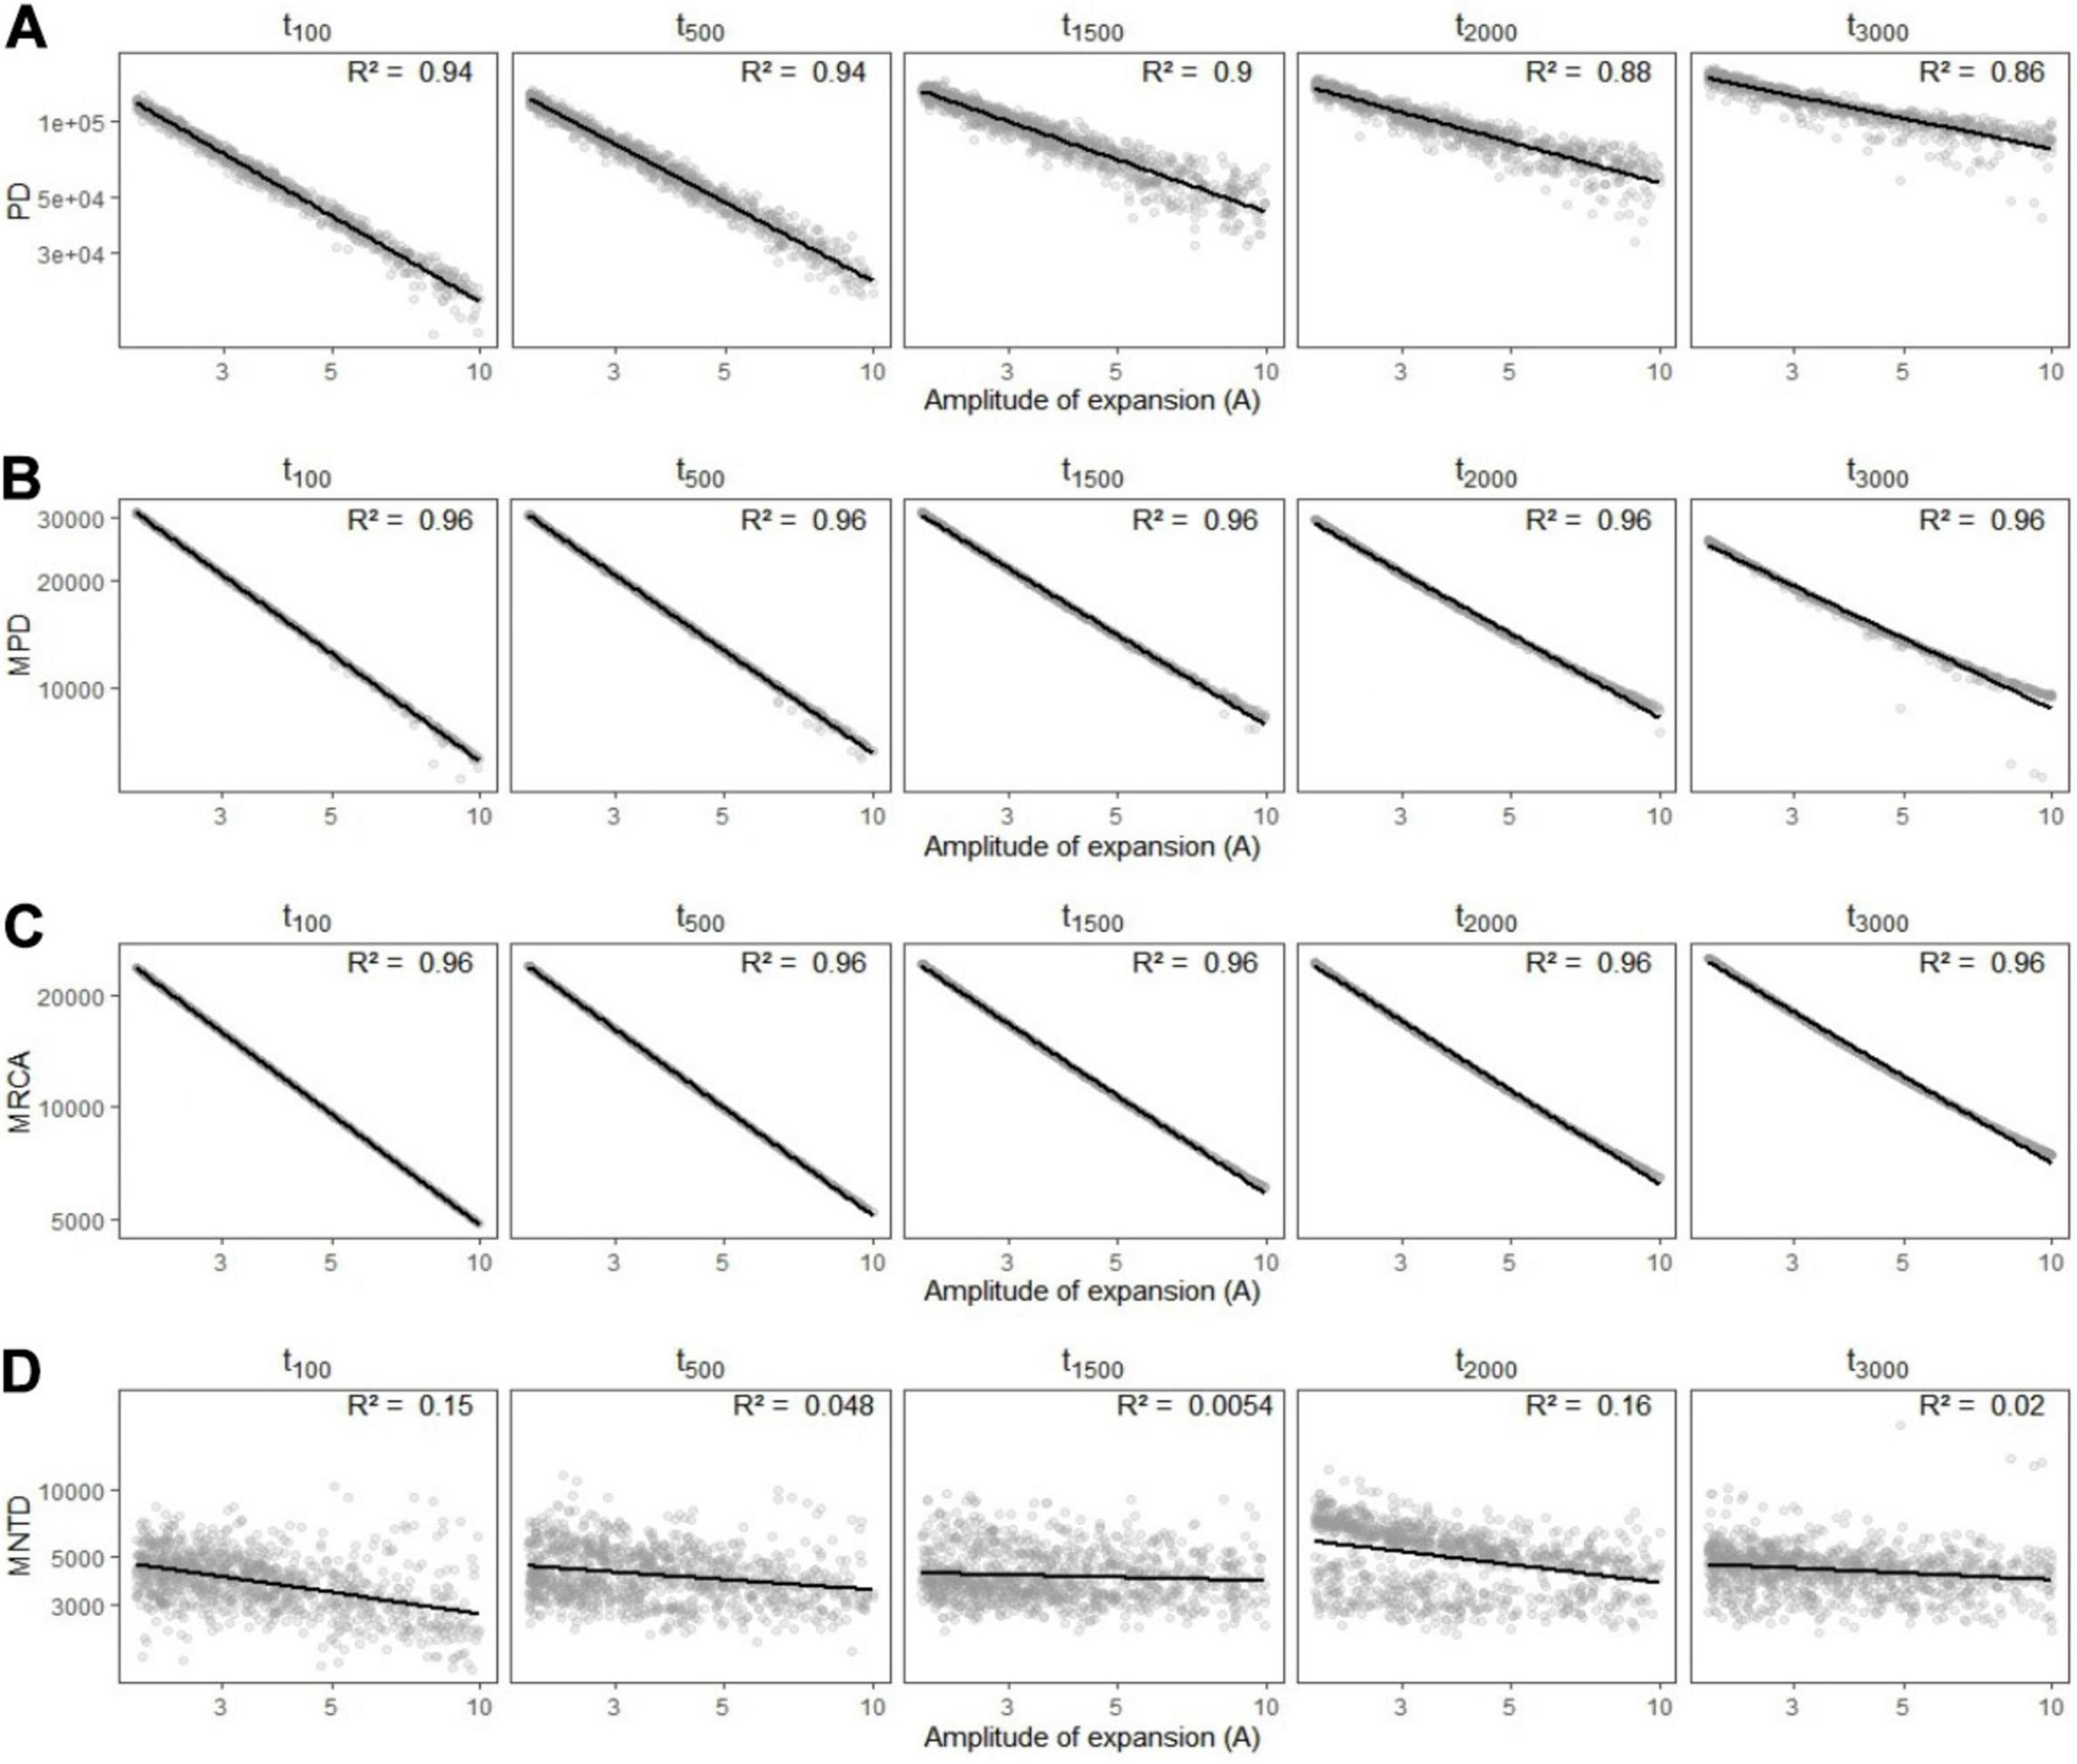
Figure 5. Variation in simulated metrics of phylogenetic diversity (A) Faith’s phylogenetic diversity (PD), (B) mean pairwise distance (MPD), (C) most recent common ancestor (MRCA), and (D) mean nearest taxon distance (MNTD) depending on the amplitude of expansion (A) and the time (in generations) at which it occurred (tc). Linear regressions are shown in black with the associated R2 statistic in the upper-right side of each panel.
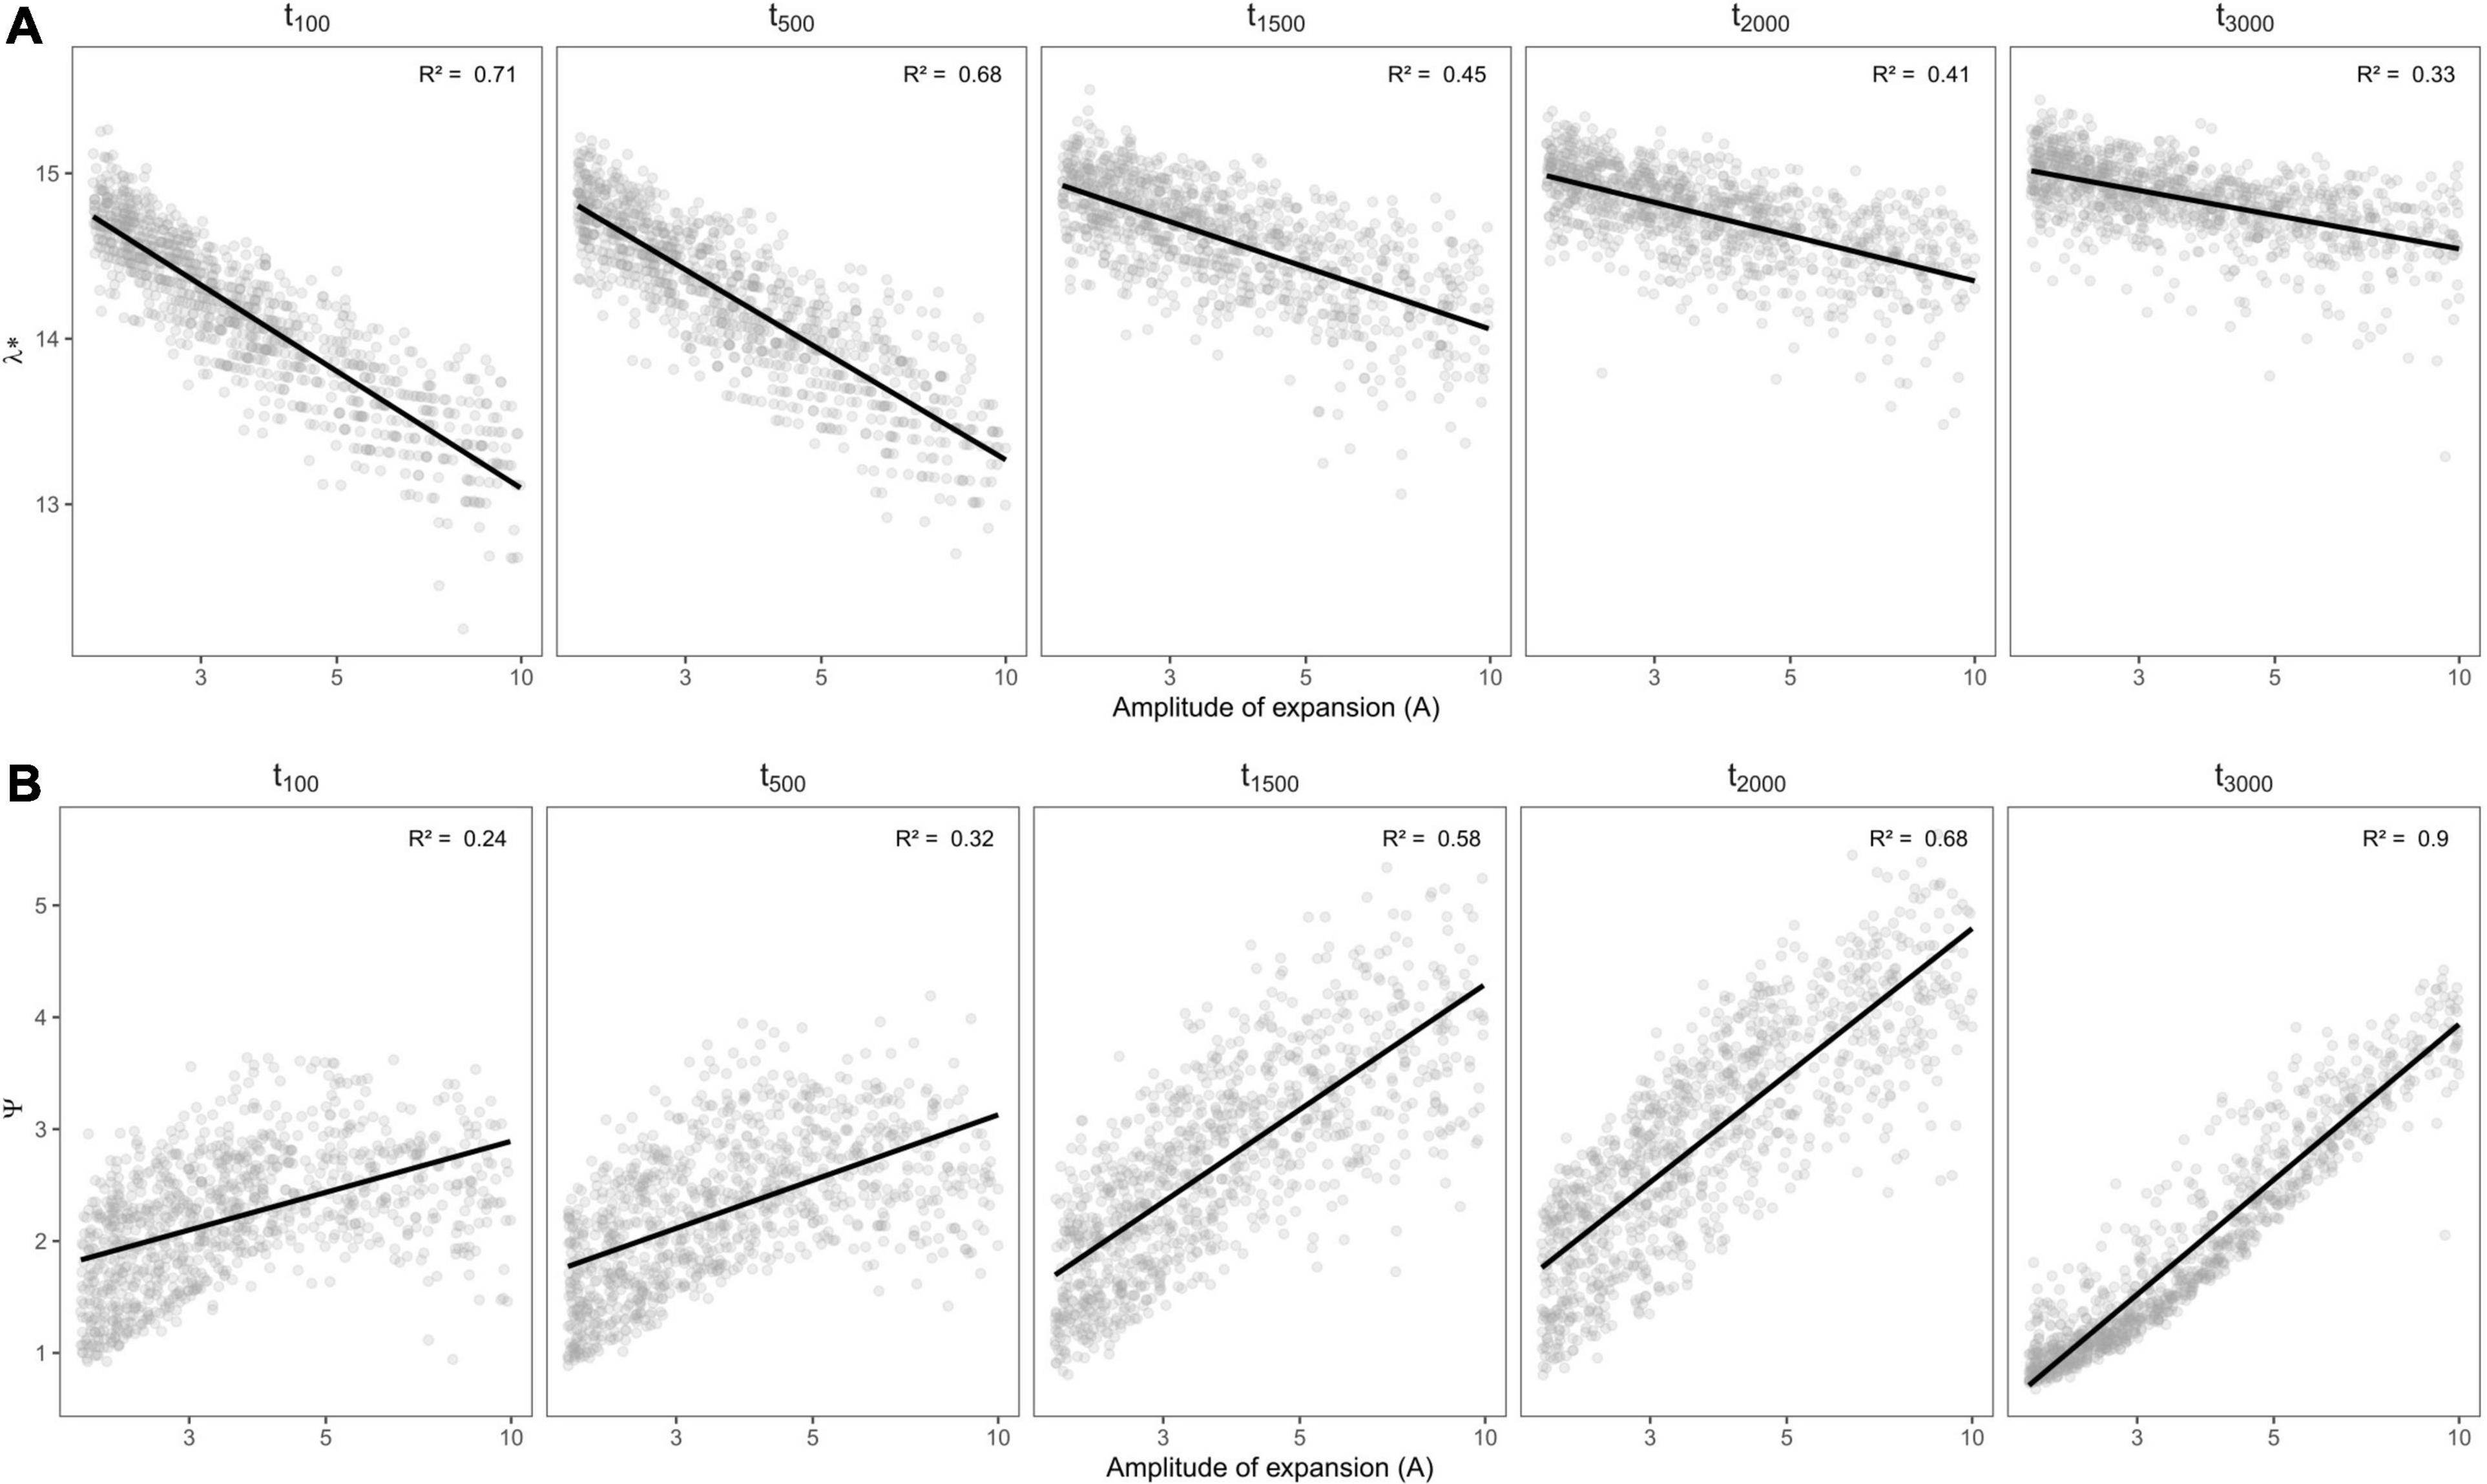
Figure 6. Variation in spectral density profile summary statistics: (A) ln-transformed principal eigenvalue (λ*) and (B) skewness (ψ), of rerooted phylogenies (vis a vis oldest simulated MRCA) depending on the amplitude of expansion and the time (in generations) at which it occurred. Linear regressions are shown in black with the associated R2 statistic in the upper-left side of each panel.
Functional Composition
Trait mean—as expected—averaged around the ancestral trait value and trait variance increased with σ (Figures 7, 8). Yet, depending on the trait evolution model (here, EB, BM, or LB, based on the sign of β) simulated trait values deviated more or less importantly from the ancestral value from one simulation to the next (larger IQR) and their variance decreased depending on the amplitude of expansion (Figure 7). More interestingly, the trait IQRs and variance increased depending on λ∗ (Figure 8A), for the BM or LB trait evolution models. In the case of an EB trait evolution model, the IQR and trait variance did not depend on phylogenies’ spectral density metrics, but instead increased depending on σ. For the BM and LB trait evolution models, the IQR and trait variance increased both depending on σ and λ∗, more so in the case of a LB. Simulated trait IQRs and variance also increased, with similar trends, for phylogenies with stem-to-tip asymmetry favoring terminal branch lengths.
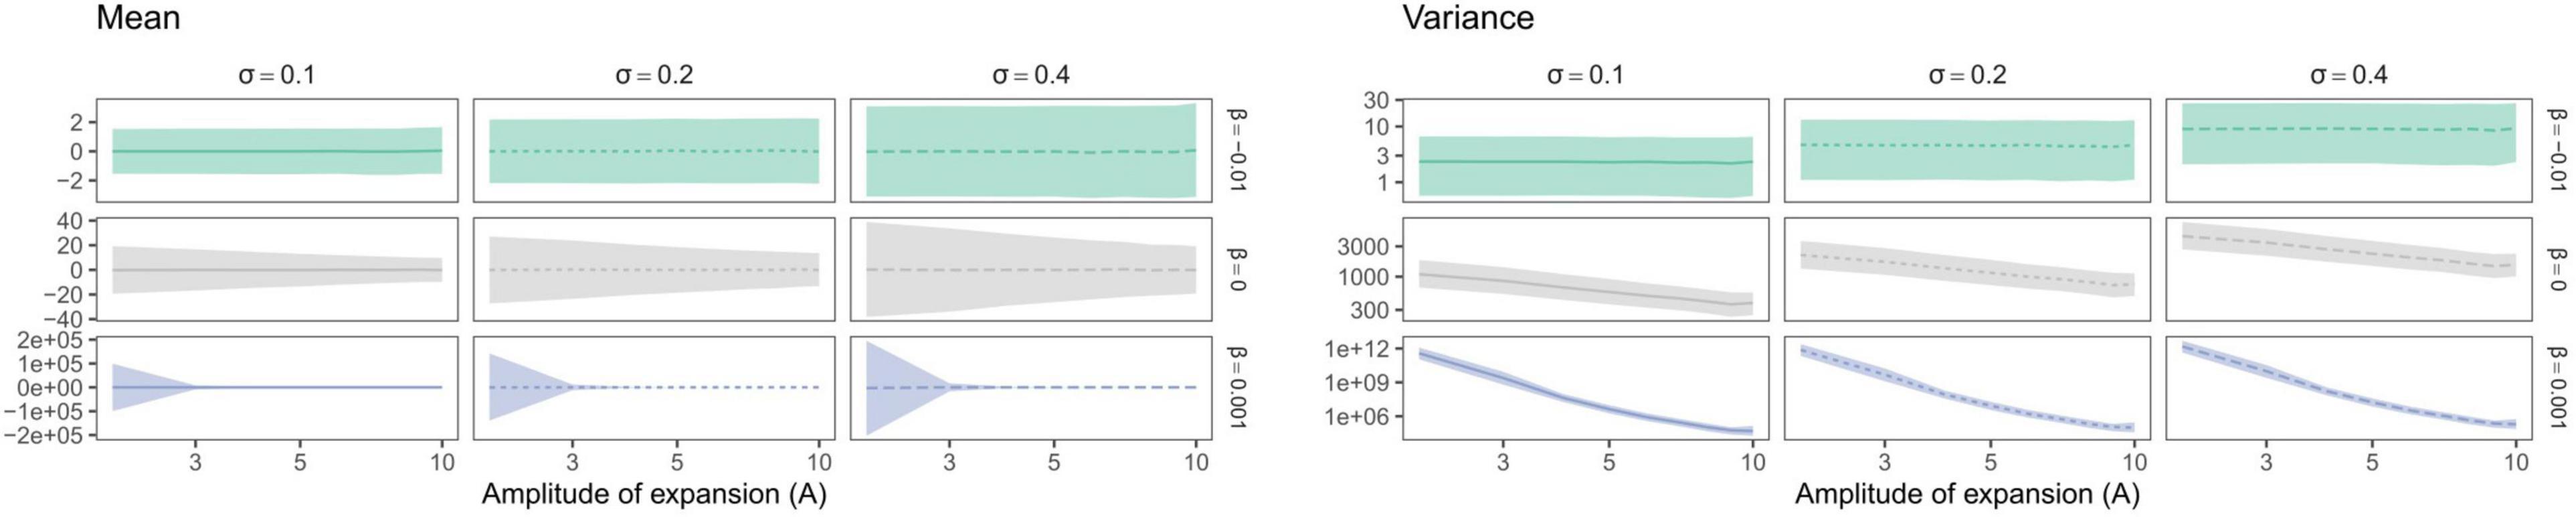
Figure 7. Variation in median trait moments (mean and variance) as well as their interquartile ranges (IQR) depending on the amplitude of expansion (A). Trait mean and variance did not vary depending on the time at which expansion occurred (not shown). Species richness is fixed for all simulations (S = 31). Brownian Motion is represented in gray, while Early and Late Burst are shown, respectively, in green or blue.
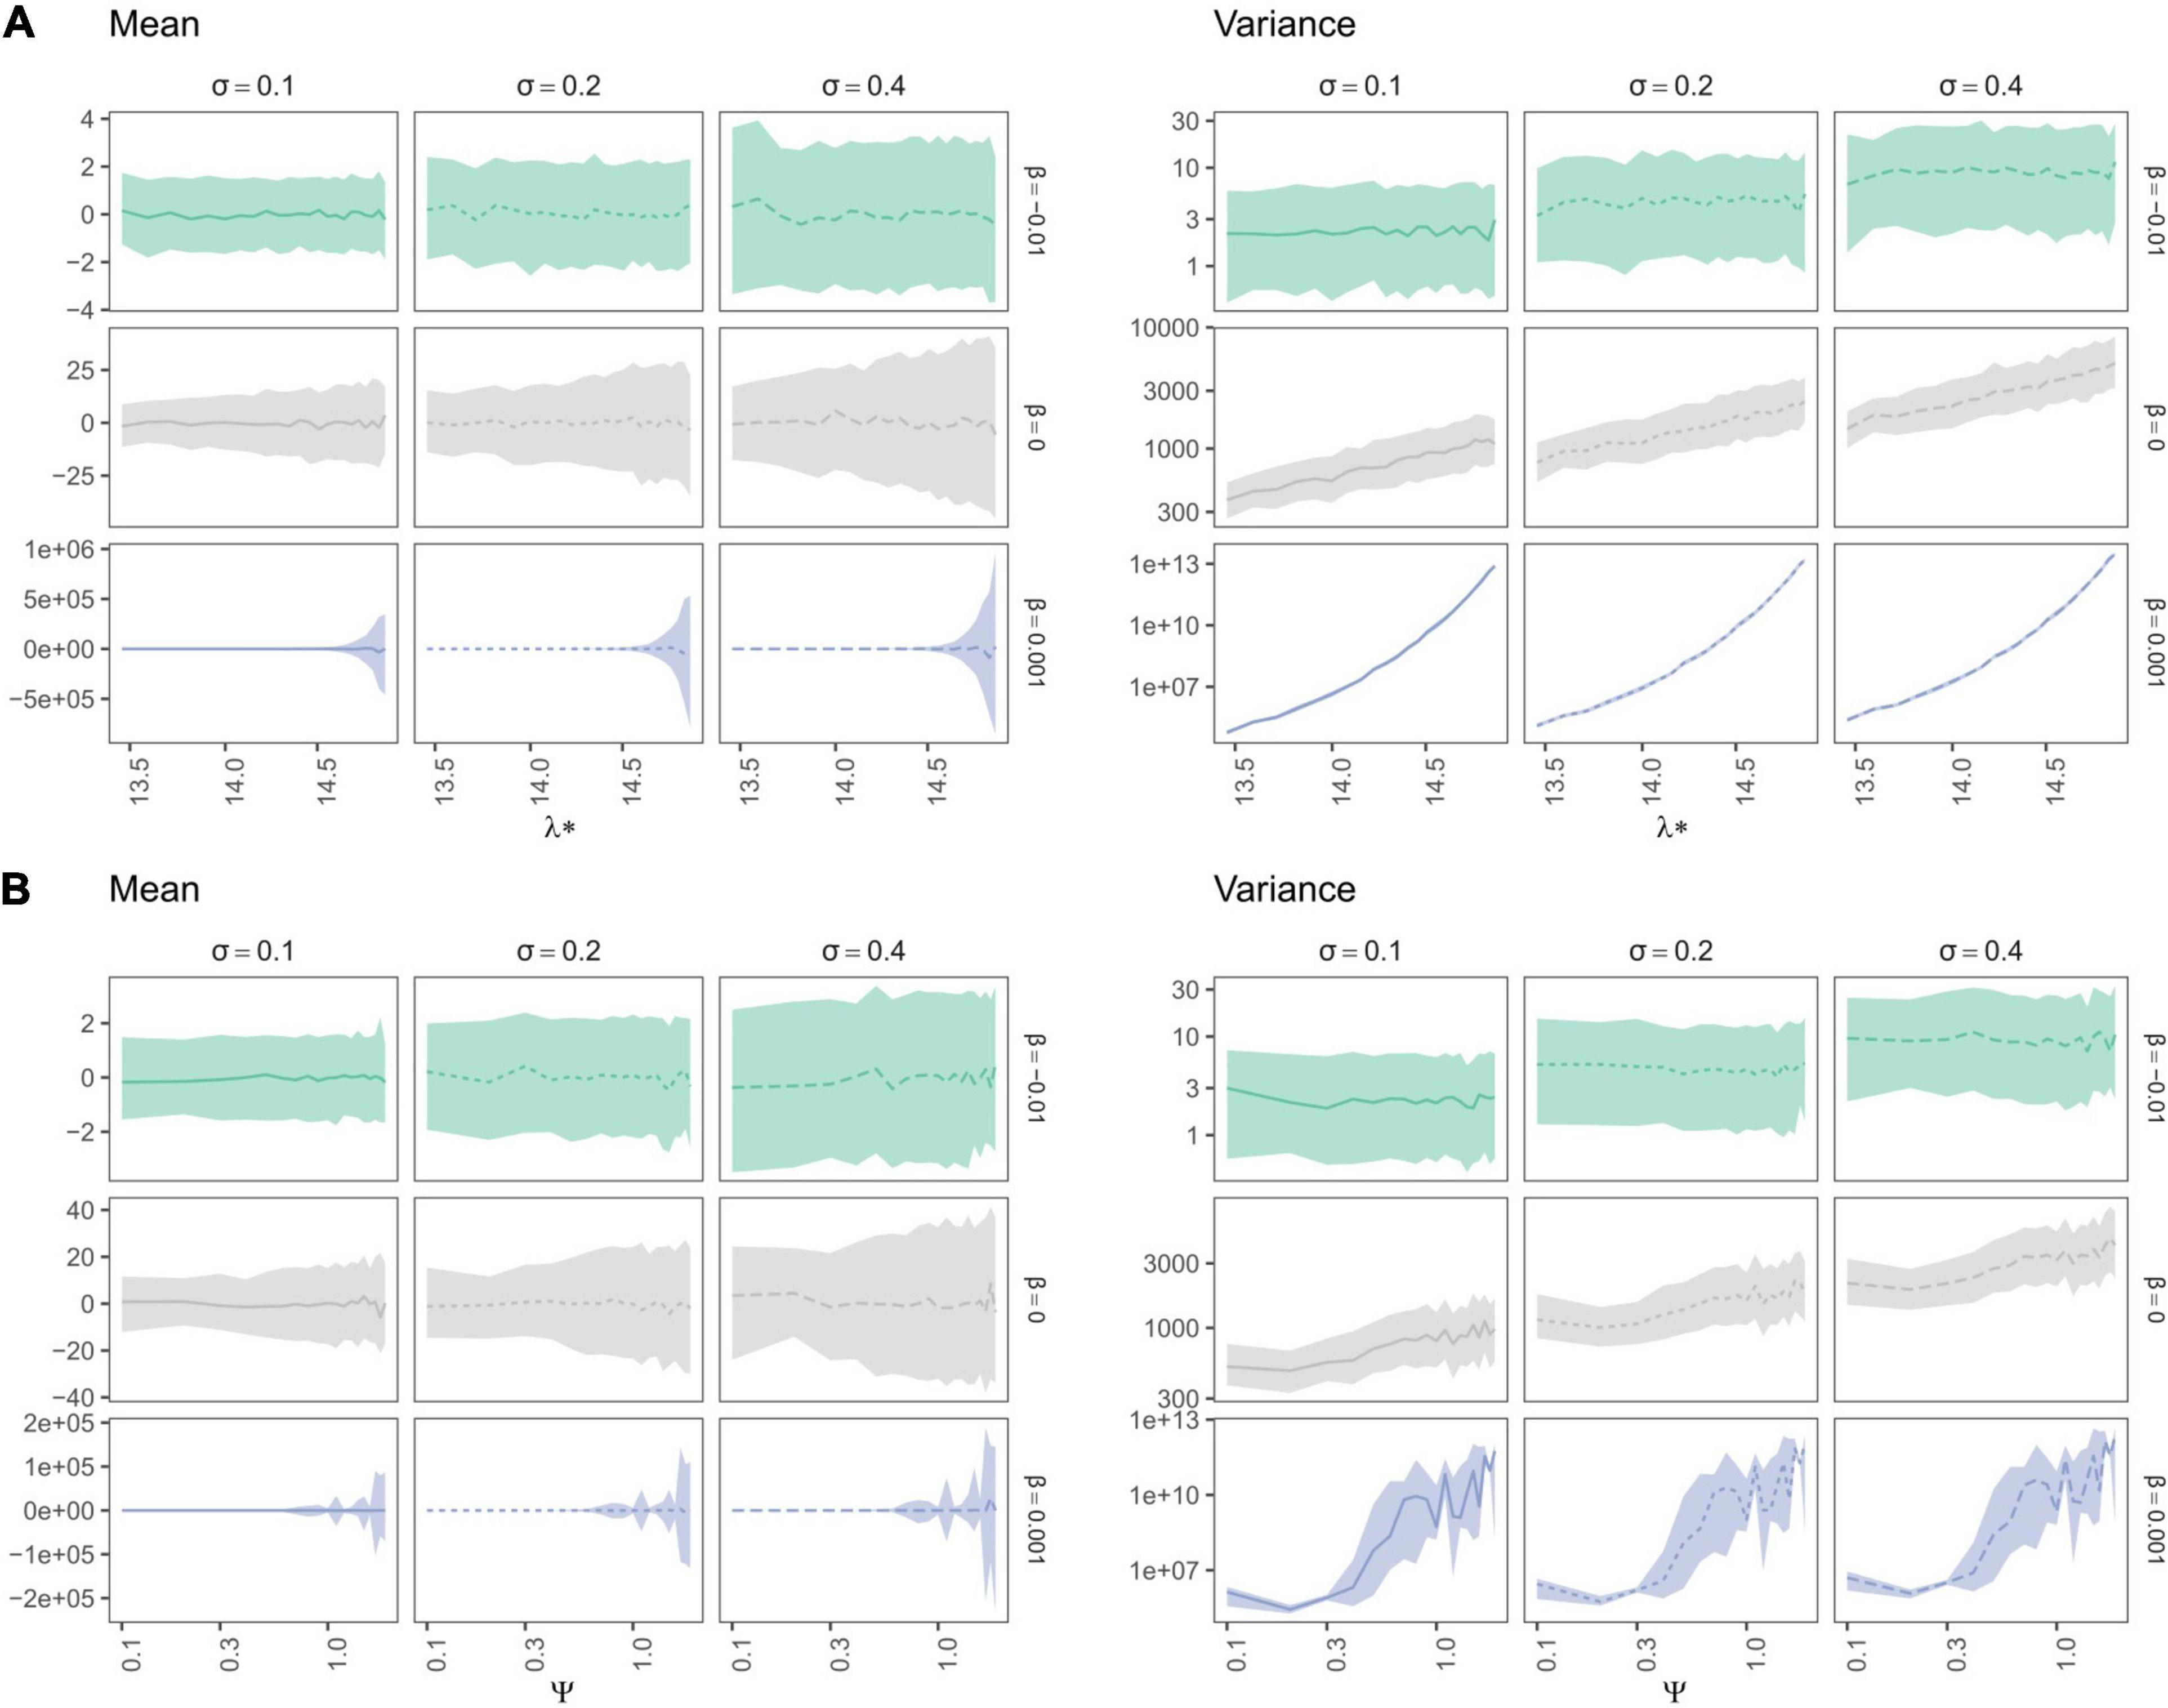
Figure 8. Variation in median trait moments (mean and variance) as well as their interquartile ranges (IQR) along the ln-transformed principal eigenvalue (λ*) (A) and skewness (ψ) (B), summarizing the variation in simulated spectral density profiles according to the parameters used to simulate trait evolution (β in rows and σ in columns in each individual panel). The lines represent the median over 100 replications of trait evolution models and are dashed according to sigma values, while the shaded area represents the replicates’ interquartile ranges (IQR). Species richness is fixed for all simulations (S = 31). Brownian Motion is represented in grey, while Early and Late Burst are shown respectively in green or blue.
Discussion
By simulating the genealogies of individuals in an extant assemblage, for a wide range of scenarios of past restriction in refugia and subsequent expansion we found that the resulting patterns of taxonomic, phylogenetic and functional diversity in extant assemblages, reflect how past refugia have influenced population dynamics, evolutionary diversification, and trait evolution until present.
Relative Species Abundances Keep Track of (More) Recent Habitat Changes
When the size of favorable habitat in refugia was smaller relative to present size (i.e., ampler habitat expansion afterward), our results suggest that more species were lost over time due to greater extinction and ecological drift in reduced assemblages (Vellend, 2010). This phenomenon amplified as the time spent in refugia increased (i.e., when the subsequent habitat expansion was recent), and mostly affected rare species. Reciprocally, species richness and the number of rare species were highest when expansion occurred long enough ago that specific diversity could subsequently reach a new equilibrium, i.e., when it no longer depended on the amplitude of expansion. Hence, our results suggest that extant taxonomic diversity, such as species richness, is influenced by past demographic events having affected whole assemblages. More specifically, for recent habitat changes, taxonomic diversity kept track of the influence of restriction in more recent refugia. Motivated by analogous uses in population genetics, the Species Frequency Spectra (SFS), a multispecies extension of allele frequency spectra used in population genetics (Fisher, 1930), was especially useful to detect the influence of more recent demographic expansions. Because SFS provide more detailed and unabridged information regarding the variation in species abundance in an assemblage, these allowed us to detect the specific signature carried by specific classes of abundance, in particular that of rare species.
Phylogenetic Diversity Keeps Track of (More) Ancient Habitat Changes
Overall, phylogenetic diversity decreased as past assemblages experienced reduced-sized refugia and subsequent habitat expansion. Metrics of phylogenetic diversity (PD, MPD, λ∗) reflected the higher extinction of lineages in smaller refugia. The effect of past habitat restriction was especially well-captured by metrics of phylogenetic diversity even when expansions were recent. MNTD failed to capture the signature of more recent expansions (Mazel et al., 2016). Nevertheless, the signature of assemblage-wide expansions was still perceptible in other phylogenetic diversity metrics (λ∗, PD, MPD) despite very ancient and small changes in the past.
There has been a growing interest in how network science can provide novel ways to characterize the shape of phylogenetic trees (Chindelevitch et al., 2019). We found that the shape of a phylogeny, and more specifically its stem-to-tip asymmetry increased—indicating more frequent terminal branching events (Lewitus and Morlon, 2016)—as the size of the refugia decreased compared to present, even more so if expansions occurred long ago. With restricted past refugia, older lineages were lost by extinction, which amounted to very few deep branching events in extant phylogeny. Once the size of favorable habitat increased, so did diversification as new lineages had a greater chance of persisting into extant assemblages. With larger expansions, the greater imbalance between the loss of old lineages in refugia and the diversification of newer lineages after the expansion amounted to more terminal branching events. Thus stem-to-tip asymmetry increased. With recent expansions, there was not as much time for diversification to amount to as many new lineages (for a same rate of speciation for our simulations). Yet, demographic expansions affected both the number of terminal branching events and age of the MRCA. The simulated phylogenies should be all rooted to the oldest MRCA to capture the relative signature of expansions on stem-to-tip asymmetry (Pennell et al., 2012).
Hence, using different metrics of phylogenetic diversity and tree shape provide insights into how past habitat restrictions have impacted the diversification of species. Phylogenetic diversity provided a complementary insight to taxonomic diversity as taxonomic metrics mostly reflected the effect of past assemblage-wide demographic expansions while phylogenetic metrics reflect the effect of long-term speciation/extinction dynamics. Yet, species richness was influenced by global diversification, hence using phylogenetic diversity metrics which did not depend on species richness by capturing tree-shape such as the skewness of the spectral density profiles.
Phylogenetic diversity metrics carried the signature of assemblage-wide past demographic changes. Even if expansions occurred long ago, extant patterns of phylogenetic diversity still carried the signature of the loss of past lineages, unlike metrics of taxonomic diversity.
Functional Composition Reflects the Interplay Between Trait Evolution and Past Diversification in Phylogenies
Simulating trait evolution along phylogenies obtained for different expansion scenarios, trait values deviated from the ancestral value depending on the pace of trait evolution with regards to overall phylogenetic diversity. All replicates remained centered on the ancestral trait value. In the case of a Brownian (BM) or late burst (LB) trait evolution model, we showed that the extent by which traits deviated from the ancestral value depended on phylogenetic diversity (λ∗), which in turn depended on parameters of past demographic changes. Our results show how patterns of functional composition change with regards to parameters of demographic expansion: past refugia dynamics have driven the levels of diversification of lineages and thereby the opportunity for traits to deviate from an ancestral trait value. In larger past refugia, increased diversification amounting to higher phylogenetic diversity allowed lineages to deviate more from the ancestral trait value. However, in the case of an early burst (EB), most trait evolution happened in smaller assemblages with fewer lineages, thus trait mean and variance remained small and unaffected by subsequent habitat expansion. Thus, the shape of a phylogeny interplays with trait evolution to shape extant functional composition (Tucker et al., 2018; Pearse et al., 2019). Specifically, phylogenetic asymmetry can be related to asymmetry in evolutionary models (Kirxpatrick and Slatkin, 1993; Blum and François, 2006). In this study, using a metric of stem-to-tip asymmetry (Lewitus and Morlon, 2016), we show that a substantial increase in trait variance can be due to a combined effect of increased terminal branching events and the acceleration of trait evolution (in the case of a LB model).
Yet additional metrics capturing other aspects of phylogenetic tree shape may have interesting applications to understand how regional trait diversity emerges (Pavoine et al., 2010; Tucker et al., 2017). For instance, if a phylogeny is particularly unbalanced, i.e., if branch lengths are unevenly distributed in the phylogenetic tree—then trait evolution may introduce multi-modal trait distributions. The emergence of functional outliers should then depend on the pace of trait evolution relative to the depth of diverging branching events (Violle et al., 2017). Reciprocally, we can expect trait distributions to reflect evolutive convergence if the distributions of branch-lengths are especially regular. Thus, specific signatures in other trait distribution moments such as the skewness or kurtosis (Gross et al., 2017) may result from the interplay between trait evolution and phylogenetic tree shape (Tucker et al., 2018).
Past environmental conditions may have constrained assemblages to refugia and removed lineages with ill-adapted sets of traits in a non-random manner (i.e., natural selection) and affect extant patterns of functional diversity (Svenning, 2003; Ordonez and Svenning, 2015). Here, we focus on the patterns of functional diversity emerging from the combination of lineage diversification (under the influence of expansion dynamics) and the pace of trait evolution. These types of approaches can reflect radiations which may or may not be adaptive (Czekanski-Moir and Rundell, 2019; Harmon, 2019). Our approach does not explicitly consider differential trait diversification between species, as may occur in the case of niche differentiation for instance (Dayan and Simberloff, 2005). A promising perspective would be to add a supplementary component to our model to represent more explicitly how natural selection affects the diversification of species niches depending on their adequacy to fluctuating environments (Ewing and Hermisson, 2010; Ovaskainen et al., 2011; Karhunen et al., 2013; Manceau et al., 2016).
Process-Based Eco-Evolutionary Modeling
In this study, we devised an original modeling framework to address how past refugia size and age can affect extant patterns of taxonomic, phylogenetic and functional diversity. Typically, phylogeographic studies focus on how current patterns of genetic diversity within species can retain the influence of past fragmentation and isolation of populations in refugia on intraspecific genetic diversity at present (Avise, 2000). Conversely, comparative phylogeographic approaches aim to grasp congruent or differing influence of refugia on several co-occurring taxa (Arbogast and Kenagy, 2001; Overcast et al., 2019, 2020; Swenson, 2019). Because smaller refugia entail greater extinction risk and fewer opportunities for speciation, the diversification of taxa over time should be shaped by changes in habitat availability. Here we confirm these hypotheses, by proposing an approach in which mechanisms of assemblage-wide dynamics of species abundances and trait values are explicitly simulated depending on changing habitat availability.
By directly representing the consequences of assemblage-wide environmental fluctuations over a wide range of parameter values relating to refugia size and age, we can address the broader question of whether any set of chosen metrics carry the signature of such processes. In fact, this approach echoes a more general challenge in ecology: can a snapshot of diversity patterns unambiguously reflect the signatures of many processes acting simultaneously at different spatial and temporal scales (Levin, 1992; Pearse et al., 2019). Relating extant patterns of diversity to the processes having hypothetically shaped them is an overarching goal in many fields of ecology and evolution. Examining how patterns relate to processes in a virtual setting can allow us to evaluate to what extent we can in turn recover parameter values of refugia dynamics from the observation of extant diversity patterns (Nielsen and Beaumont, 2009; Beaumont, 2010). Approximate Bayesian Computation (ABC) approaches for instance, repeatedly compare large numbers of simulated datasets to observed data, by means of summary statistics (Csilléry et al., 2010; Sunnåker et al., 2013). Thus, it is important that the simulated diversity metrics carry the signature of underlying processes, as we have shown here, because inference is directly based on the information withheld in the derived summary statistics (Grimm et al., 2010; Hartig et al., 2011). From here, we could now compare observed patterns of taxonomic, phylogenetic and functional diversity to those simulated using our process-based eco-evolutionary model in order to infer whether and how past expansion dynamics have shaped actual observations of biodiversity.
Perspectives—From a Regional Pool to Local Communities: Integrating the Influence of Assembly Processes on Local Community Composition
In recent years, there has been a renewed interest in better integrating evolutionary history and community ecology (Overcast et al., 2019, 2020; Swenson, 2019). Yet, studies of the assembly of communities often assume that the regional species pool (and associated phenotypes) represents a snapshot of an evolutionary heritage from which species assemble through local dynamics over recent and short enough time periods that diversification events can be ignored. Such approaches consider community assembly as a top-down process, whereby species present in a regional pool go through a series of filters (dispersal limitation, environmental filtering, biotic interactions) to assemble in local communities (Lortie et al., 2004). In this perspective, the species pool is stable, ignoring how the pool species composition is shaped by biogeographic history, colonization events or the tempo of trait evolution (Tucker et al., 2018; Swenson, 2019). However, as we have highlighted above, it is possible to explicitly represent how such processes together generate species composition and traits at a regional level.
Recent studies have underlined the critical influence of the diversity of the species pool in providing immigrants (Cornell and Harrison, 2014) and called for a more mechanistic modeling approach that directly represents key processes shaping community assembly (Denelle et al., 2019). The difficulty lies in the definition of the species pool as a fixed phenomenological object (Lessard et al., 2012a, b). Depending on how it is delineated, from species’ fundamental niches and their limited dispersal abilities in a broad-scale landscape (Karger et al., 2016) to finer-scale biotic interactions in shaping community assembly (Perronne et al., 2017), our perspective on the community level can vary. Here we show how local demographic processes influence the taxonomic, phylogenetic and functional competition of the species pool under the influence of long-term environmental fluctuations. Yet we could extend our framework to consider how these same large-scale biogeographic historical processes feed back into community assembly at a local scale. This could be done for instance by integrating a subsequent step to our modeling framework in which species can potentially be filtered based on their traits (Munoz et al., 2018).
Data Availability Statement
The original contributions presented in the study are included in the article/Supplementary Material, further inquiries can be directed to the corresponding author/s.
Author Contributions
EB and MJ performed the analyses. EB wrote the first draft of the manuscript. All authors contributed to design the study, revisions to the manuscript, and gave final approval for publication.
Funding
MJ was supported by the Institut de Recherche pour le Développement. This work has benefited from an “Investissements d’Avenir” grant managed by Agence Nationale de la Recherche (CEBA, ref. ANR-10-LABX- 25-01).
Conflict of Interest
The authors declare that the research was conducted in the absence of any commercial or financial relationships that could be construed as a potential conflict of interest.
Supplementary Material
The Supplementary Material for this article can be found online at: https://www.frontiersin.org/articles/10.3389/fevo.2021.634413/full#supplementary-material
References
Arbogast, B. S., and Kenagy, G. J. (2001). Comparative phylogeography as an integrative approach to historical biogeography. J. Biogeogr. 28, 819–825. doi: 10.1046/j.1365-2699.2001.00594.x
Avise, J. C. (2000). Phylogeography: The History And Formation Of Species. Cambridge: Harvard university press.
Bartish, I. V., Ozinga, W. A., Bartish, M. I., Wamelink, G. W. W., Hennekens, S. M., and Prinzing, A. (2016). Different habitats within a region contain evolutionary heritage from different epochs depending on the abiotic environment: habitats contain evolutionary heritage from different epochs. Glob. Ecol. Biogeogr. 25, 274–285. doi: 10.1111/geb.12408
Beaumont, M. A. (2010). Approximate Bayesian Computation in Evolution and Ecology. Annu. Rev. Ecol. Evol. Syst. 41, 379–406. doi: 10.1146/annurev-ecolsys-102209-144621
Bennett, K. D. (1990). Milankovitch cycles and their effects on species in ecological and evolutionary time. Paleobiology 16, 11–21.
Blanchard, G., Philippe, B., and François, M. (2020). Extinction–Immigration Dynamics Lag Behind Environmental Filtering In Shaping The Composition Of Tropical Dry Forests Within A Changing Landscape. Hoboken: wiley online library.
Blum, M. G., and François, O. (2006). Which random processes describe the tree of life? A large-scale study of phylogenetic tree imbalance. Syst. Biol. 55, 685–691. doi: 10.1080/10635150600889625
Bose, R., Ramesh, B. R., Pélissier, R., and Munoz, F. (2019). Phylogenetic diversity in the Western Ghats biodiversity hotspot reflects environmental filtering and past niche diversification of trees. J. Biogeogr. 46, 145–157. doi: 10.1111/jbi.13464
Chindelevitch, L., Hayati, M., Poon, A. F. Y., and Colijn, C. (2019). Network science inspires novel tree shape statistics. bioRxiv 608646. [Preprint]. doi: 10.1101/608646
Clavel, J., Escarguel, G., and Merceron, G. (2015). mvMORPH: an R package for fitting multivariate evolutionary models to morphometric data. Methods Ecol. Evol. 6, 1311–1319. doi: 10.1111/2041-210x.12420
Cornell, H. V., and Harrison, S. P. (2014). What Are Species Pools and When Are They Important? Annu. Rev. Ecol. Evol. Syst. 45, 45–67. doi: 10.1146/annurev-ecolsys-120213-091759
Csilléry, K., Blum, M. G., Gaggiotti, O. E., and François, O. (2010). Approximate Bayesian computation (ABC) in practice. Trends Ecol. Evol. 25, 410–418.
Czekanski-Moir, J. E., and Rundell, R. J. (2019). The Ecology of Nonecological Speciation and Nonadaptive Radiations. Trends Ecol. Evol. 34, 400–415. doi: 10.1016/j.tree.2019.01.012
Dayan, T., and Simberloff, D. (2005). Ecological and community-wide character displacement: the next generation. Ecol. Lett. 8, 875–894. doi: 10.1111/j.1461-0248.2005.00791.x
Denelle, P., Violle, C., and Munoz, F. (2019). Distinguishing the signatures of local environmental filtering and regional trait range limits in the study of trait–environment relationships. bioRxiv [preprint]. doi: 10.1101/528836
Ewing, G., and Hermisson, J. (2010). MSMS: a coalescent simulation program including recombination, demographic structure and selection at a single locus. Bioinformatics 26, 2064–2065. doi: 10.1093/bioinformatics/btq322
Fisher, R. A. (1930). 086: The Distribution of Gene Ratios for Rare Mutations. Proc. R. Soc. Edinb. 50, 205–220.
Fortunel, C., Timothy Paine, C. E., Fine, P. V. A., Kraft, N. J. B., and Baraloto, C. (2014). Environmental factors predict community functional composition in Amazonian forests. J. Ecol. 102, 145–155. doi: 10.1111/1365-2745.12160
Grimm, V., Berger, U., DeAngelis, D. L., Gary Polhill, J., Giske, J., and Railsback, S. F. (2010). The ODD protocol: a review and first update. Ecol. Model. 221, 2760–2768. doi: 10.1016/j.ecolmodel.2010.08.019
Gross, N., Bagousse-Pinguet, Y. L., Liancourt, P., Berdugo, M., Gotelli, N. J., and Maestre, F. T. (2017). Functional trait diversity maximizes ecosystem multifunctionality. Nat. Ecol. Evol. 1:132.
Harmon, L. (2019). Phylogenetic comparative methods: learning from trees. CreateSpace Independent Publishing Platform.
Hartig, F., Calabrese, J. M., Reineking, B., Wiegand, T., and Huth, A. (2011). Statistical inference for stochastic simulation models theory and application: inference for stochastic simulation models. Ecol. Lett. 14, 816–827. doi: 10.1111/j.1461-0248.2011.01640.x
Hubbell, S. P. (2001). The Unified Neutral Theory Of Biodiversity And Biogeography. Princeton: Princeton University Press.
Hudson, R. R. (2002). Generating samples under a Wright–Fisher neutral model of genetic variation. Bioinformatics 18, 337–338. doi: 10.1093/bioinformatics/18.2.337
Karger, D. N., Cord, A. F., Kessler, M., Kreft, H., Kühn, I., Pompe, S., et al. (2016). Delineating probabilistic species pools in ecology and biogeography: probabilistic species pools. Glob. Ecol. Biogeogr. 25, 489–501. doi: 10.1111/geb.12422
Karhunen, M., Merilä, J., Leinonen, T., Cano, J. M., and Ovaskainen, O. (2013). DRIFTSEL: an R package for detecting signals of natural selection in quantitative traits. Mol. Ecol. Resour. 13, 746–754. doi: 10.1111/1755-0998.12111
Kelleher, J., and Lohse, K. (2020). Coalescent Simulation with msprime. Methods Mol. Biol. 2090, 191–230. doi: 10.1007/978-1-0716-0199-0_9
Kembel, S. W., Cowan, P. D., Helmus, M. R., Cornwell, W. K., Morlon, H., Ackerly, D. D., et al. (2010). Picante: R tools for integrating phylogenies and ecology. Bioinformatics 26, 1463–1464. doi: 10.1093/bioinformatics/btq166
Kingman, J. F. (1982). On the genealogy of large populations. J. Appl. Probab. 19, 27–43. doi: 10.2307/3213548
Kirxpatrick, M., and Slatkin, M. (1993). Searching for evolutionary patterns in the shape of a phylogenetic tree. Evolution 47, 1171–1181. doi: 10.2307/2409983
Lê, S., Josse, J., and Husson, F. (2008). FactoMineR: an R package for multivariate analysis. J. Stat. Softw. 25, 1–18.
Lessard, J.-P., Borregaard, M. K., Fordyce, J. A., Rahbek, C., Weiser, M. D., Dunn, R. R., et al. (2012b). Strong influence of regional species pools on continent-wide structuring of local communities. Proc. R. Soc. B Biol. Sci. 279, 266–274. doi: 10.1098/rspb.2011.0552
Lessard, J.-P., Belmaker, J., Myers, J. A., Chase, J. M., and Rahbek, C. (2012a). Inferring local ecological processes amid species pool influences. Trends Ecol. Evol. 27, 600–607. doi: 10.1016/j.tree.2012.07.006
Levin, S. A. (1992). The problem of pattern and scale in ecology: the Robert H. MacArthur award lecture. Ecology 73, 1943–1967. doi: 10.2307/1941447
Lewitus, E., and Morlon, H. (2016). Characterizing and comparing phylogenies from their Laplacian spectrum. Syst. Biol. 65, 495–507. doi: 10.1093/sysbio/syv116
Lortie, C. J., Brooker, R. W., Choler, P., Kikvidze, Z., Michalet, R., Pugnaire, F. I., et al. (2004). Rethinking plant community theory. Oikos 107, 433–438. doi: 10.1111/j.0030-1299.2004.13250.x
Manceau, M., Lambert, A., and Morlon, H. (2015). Phylogenies support out-of-equilibrium models of biodiversity. Ecol. Lett. 18, 347–356. doi: 10.1111/ele.12415
Manceau, M., Lambert, A., and Morlon, H. (2016). A unifying comparative phylogenetic framework including traits coevolving across interacting lineages. Syst. Biol. 66, 551–568.
Marth, G. T., Czabarka, E., Murvai, J., and Sherry, S. T. (2004). The Allele Frequency Spectrum in Genome-Wide Human Variation Data Reveals Signals of Differential Demographic History in Three Large World Populations. Genetics 166, 351–372. doi: 10.1534/genetics.166.1.351
Mazel, F., Davies, T. J., Gallien, L., Renaud, J., Groussin, M., Münkemüller, T., et al. (2016). Influence of tree shape and evolutionary time−scale on phylogenetic diversity metrics. Ecography 39, 913–920. doi: 10.1111/ecog.01694
Morlon, H., Lewitus, E., Condamine, F. L., Clavel, J., and Drury, J. (2016). RPANDA: an R package for macroevolutionary analyses on phylogenetic trees. Methods Ecol. Evol. 7, 589–597. doi: 10.1111/2041-210x.12526
Munoz, F., Grenié, M., Denelle, P., Taudiere, A., Laroche, F., Tucker, C., et al. (2018). ecolottery: simulating and assessing community assembly with environmental filtering and neutral dynamics in R. Methods Ecol. Evol. 9, 693–703. doi: 10.1111/2041-210x.12918
Nielsen, R., and Beaumont, M. A. (2009). Statistical inferences in phylogeography. Mol. Ecol. 18, 1034–1047. doi: 10.1111/j.1365-294x.2008.04059.x
Ordonez, A., and Svenning, J.-C. (2015). Geographic patterns in functional diversity deficits are linked to glacial−interglacial climate stability and accessibility. Glob. Ecol. Biogeogr. 24, 826–837. doi: 10.1111/geb.12324
Ovaskainen, O., Karhunen, M., Zheng, C., Arias, J. M., and Merilä, J. (2011). A New Method to Uncover Signatures of Divergent and Stabilizing Selection in Quantitative Traits. Genetics 189, 621–632. doi: 10.1534/genetics.111.129387
Overcast, I., Emerson, B. C., and Hickerson, M. (2019). An integrated model of population genetics and community ecology. J. Biogeogr. 46, 816–829. doi: 10.1111/jbi.13541
Overcast, I., Ruffley, M., Rosindell, J., Harmon, L., Borges, P. A. V., Emerson, B. C., et al. (2020). A unified model of species abundance, genetic diversity, and functional diversity reveals the mechanisms structuring ecological communities. bioRxiv [Preprint]. doi: 10.1101/2020.01.30.927236
Patterson, N. J. (2005). How Old Is the Most Recent Ancestor of Two Copies of an Allele? Genetics 169, 1093–1104. doi: 10.1534/genetics.103.015768
Pavoine, S., Baguette, M., and Bonsall, M. B. (2010). Decomposition of trait diversity among the nodes of a phylogenetic tree. Ecol. Monogr. 80:23.
Pearse, W. D., Legendre, P., Peres-Neto, P. R., and Davies, J. (2019). The interaction of phylogeny and community structure: linking the community composition and trait evolution of clades. Glob. Ecol. Biogeogr. 28, 1499–1511. doi: 10.1111/geb.12938
Pennell, M. W., Sarver, B. A., and Harmon, L. J. (2012). Trees of Unusual Size: biased Inference of Early Bursts from Large Molecular Phylogenies. PLoS One 7:e43348. doi: 10.1371/journal.pone.0043348
Perronne, R., Munoz, F., Borgy, B., Reboud, X., and Gaba, S. (2017). How to design trait-based analyses of community assembly mechanisms: insights and guidelines from a literature review. Perspect. Plant Ecol. Evol. Syst. 25, 29–44. doi: 10.1016/j.ppees.2017.01.004
R Core Team (2020). R: A Language and Environment for Statistical Computing. Vienna: R Foundation for Statistical Computing. Available online at: https://www.R-project.org/.
Revell, L. J., Harmon, L. J., and Collar, D. C. (2008). Phylogenetic Signal. Evolutionary Process, and Rate. Syst. Biol. 57, 591–601. doi: 10.1080/10635150802302427
Sunnåker, M., Busetto, A. G., Numminen, E., Corander, J., Foll, M., and Dessimoz, M. (2013). Approximate Bayesian Computation. PLoS Comput. Biol. 9:e1002803. doi: 10.1371/journal.pcbi.1002803
Svenning, J.-C. (2003). Deterministic Plio−Pleistocene extinctions in the European cool−temperate tree flora. Ecol. Lett. 6, 646–653. doi: 10.1046/j.1461-0248.2003.00477.x
Swenson, N. G. (2019). Phylogenetic Ecology: A History, Critique, and Remodeling. Chicago: University of Chicago Press.
Tucker, C. M., Cadotte, M. W., Carvalho, S. B., Davies, T. J., Ferrier, S., Fritz, S. A., et al. (2017). A guide to phylogenetic metrics for conservation, community ecology and macroecology: a guide to phylogenetic metrics for ecology. Biol. Rev.Camb. Philos. Soc. 92, 698–715. doi: 10.1111/brv.12252
Tucker, C. M., Davies, T. J., Cadotte, M. W., and Pearse, W. D. (2018). On the relationship between phylogenetic diversity and trait diversity. Ecology 99, 1473–1479. doi: 10.1002/ecy.2349
Vellend, M. (2010). Conceptual synthesis in community ecology. Q. Rev. Biol. 85, 183–206. doi: 10.1086/652373
Violle, C., Thuiller, W., Mouquet, N., Munoz, F., Kraft, N. J. B., Cadotte, M. W., et al. (2017). Functional Rarity: the Ecology of Outliers. Trends Ecol. Evol. 32, 356–367. doi: 10.1016/j.tree.2017.02.002
Keywords: demographic stochasticity, extinction-speciation dynamics, species abundance spectrum, Brownian trait evolution, Early-Burst trait evolution, Late-Burst trait evolution, assemblage-weighted trait values, ecological drift
Citation: Barthelemy E, Fortunel C, Jaunatre M and Munoz F (2021) Imprints of Past Habitat Area Reduction on Extant Taxonomic, Functional, and Phylogenetic Composition. Front. Ecol. Evol. 9:634413. doi: 10.3389/fevo.2021.634413
Received: 27 November 2020; Accepted: 04 May 2021;
Published: 07 June 2021.
Edited by:
Fernando Augusto Oliveira Silveira, Federal University of Minas Gerais, BrazilReviewed by:
Gabriel Nakamura, Federal University of Rio Grande do Sul, BrazilAurele Toussaint, University of Tartu, Estonia
Copyright © 2021 Barthelemy, Fortunel, Jaunatre and Munoz. This is an open-access article distributed under the terms of the Creative Commons Attribution License (CC BY). The use, distribution or reproduction in other forums is permitted, provided the original author(s) and the copyright owner(s) are credited and that the original publication in this journal is cited, in accordance with accepted academic practice. No use, distribution or reproduction is permitted which does not comply with these terms.
*Correspondence: Elizabeth Barthelemy, elizabeth.barthelemy@univ-grenoble-alpes.fr