
Monitoring Ground Displacement in Mining Areas with Time-Series Interferometric Synthetic Aperture Radar by Integrating Persistent Scatterer/Slowly Decoherent Filtering Phase/Distributed Scatterer Approaches Based on Signal-to-Noise Ratio
Abstract
:1. Introduction
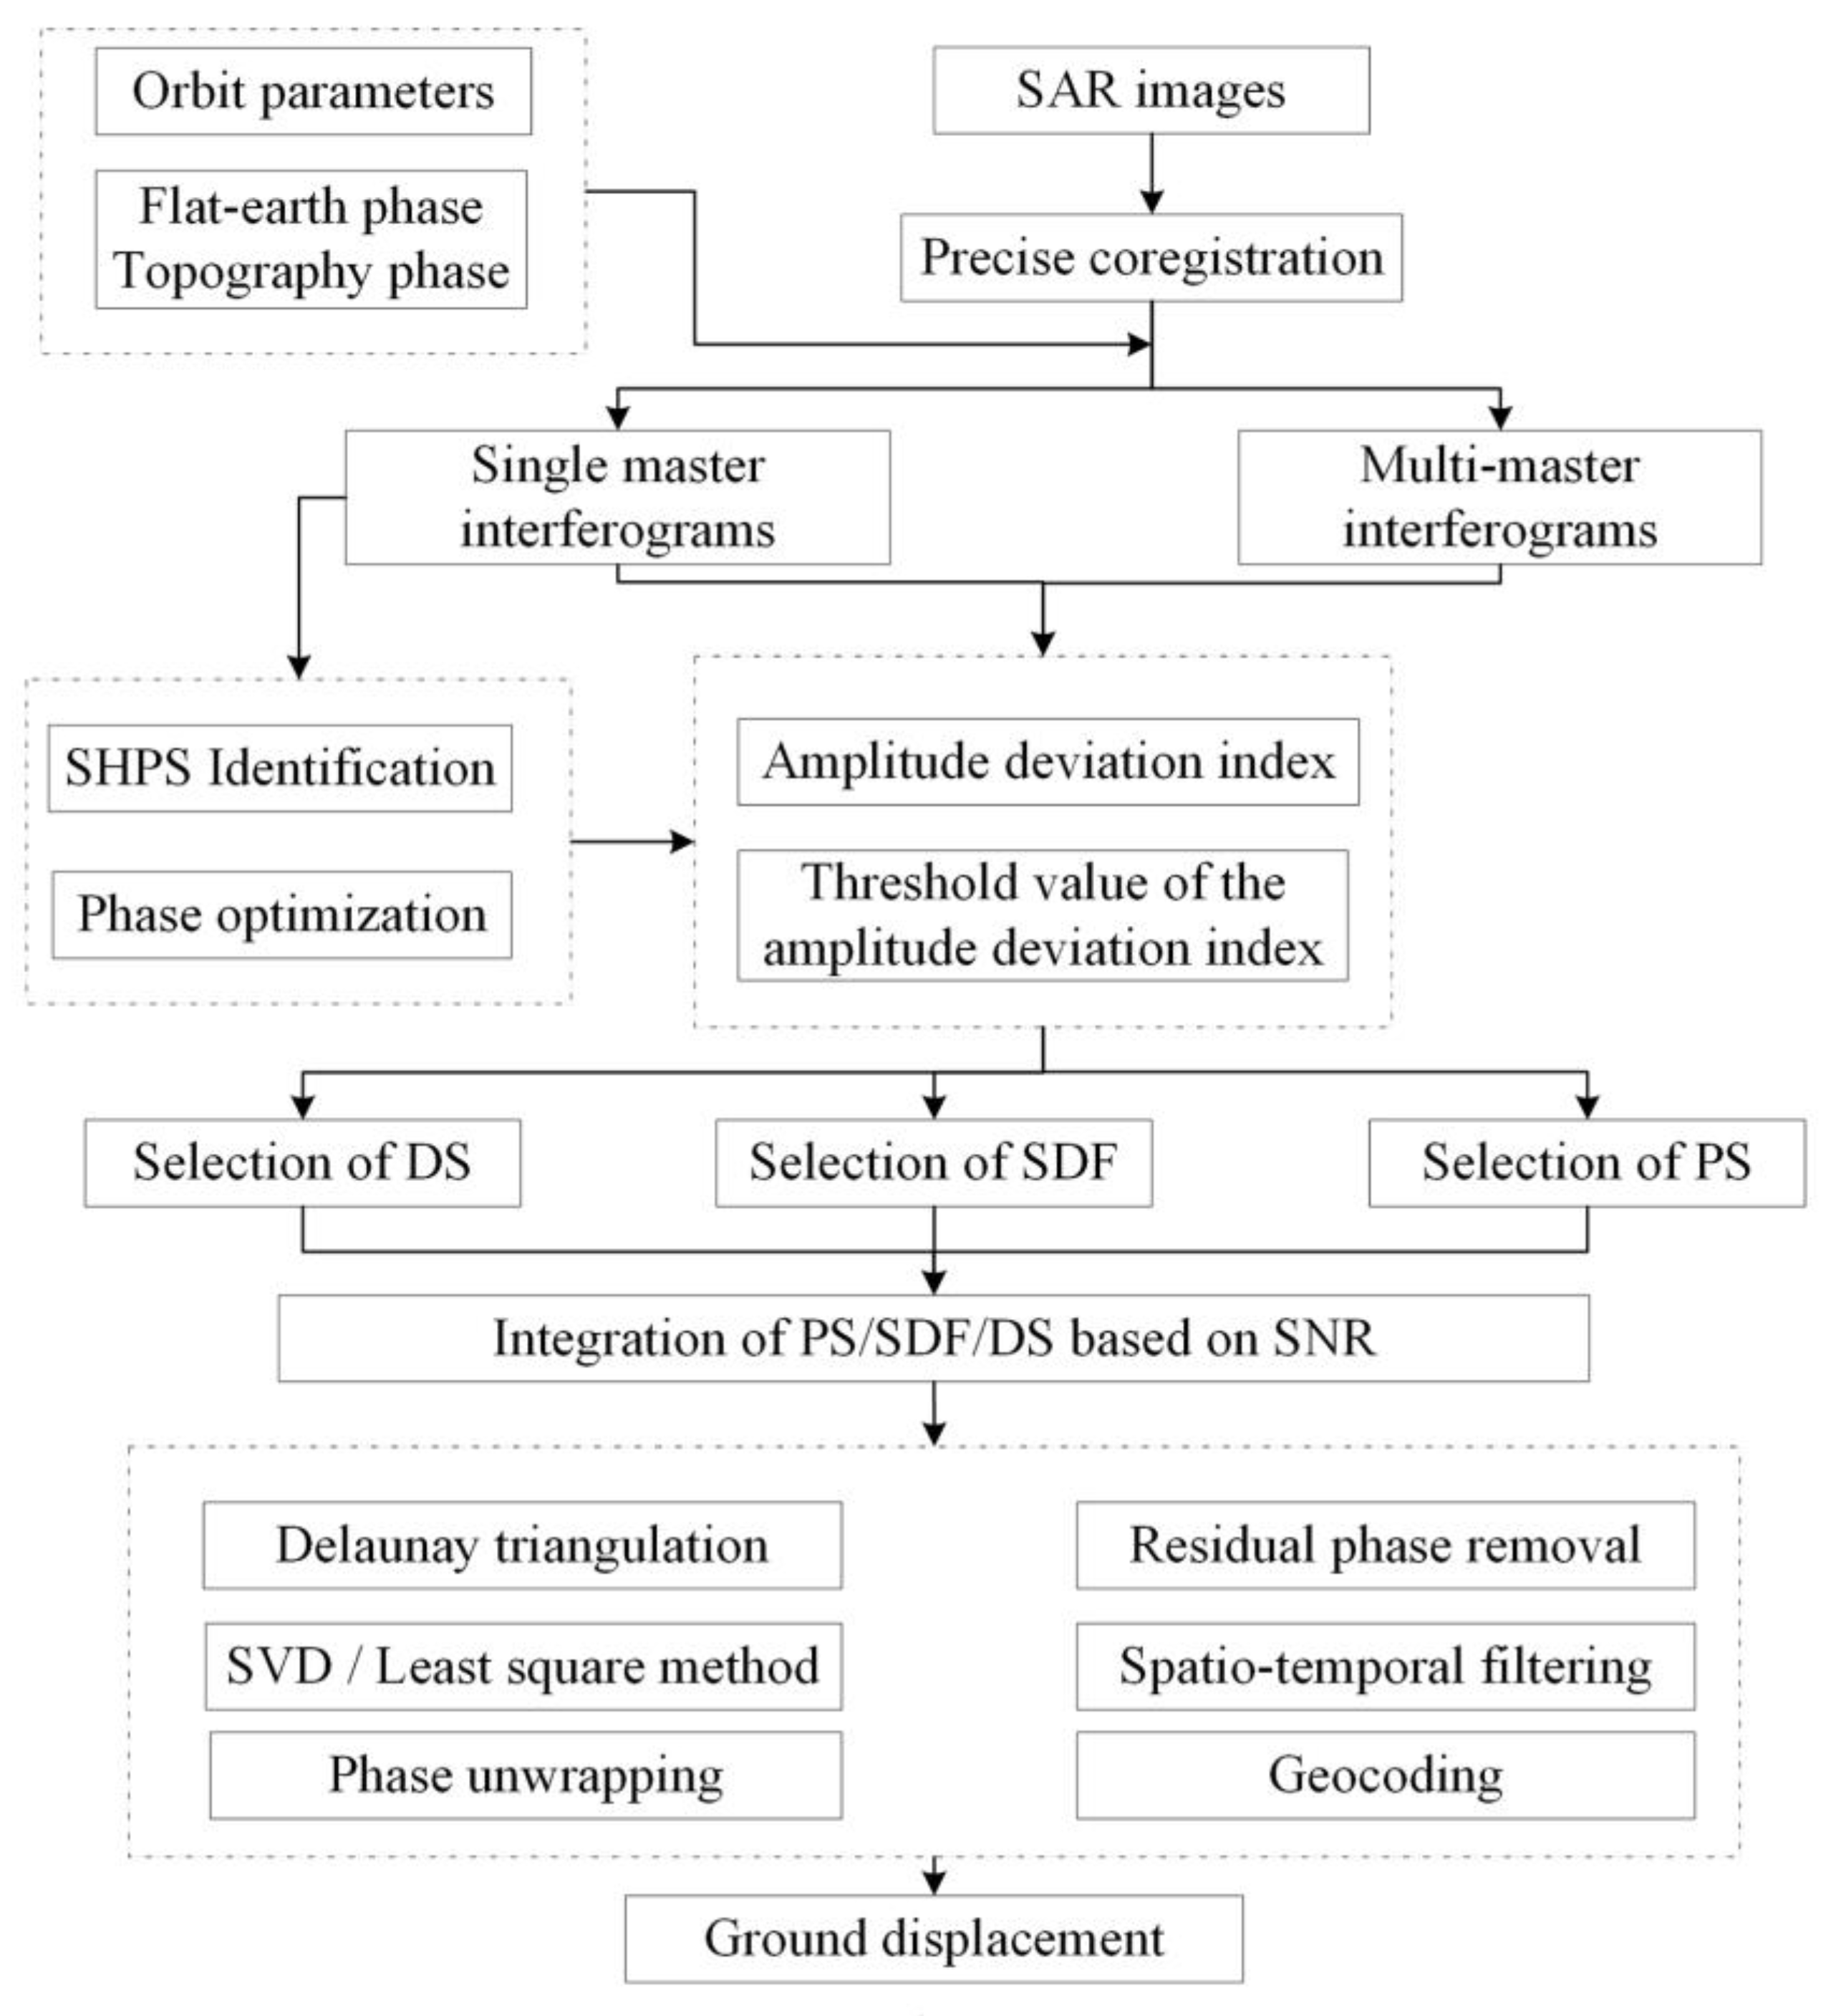
2. Methodology
2.1. Selection of PS/SDF/DS Target Points
2.2. Integration of PS/SDF/DS Based on SNR
2.3. Time Series Ground Displacement Solution
3. Study Area and Data Processing
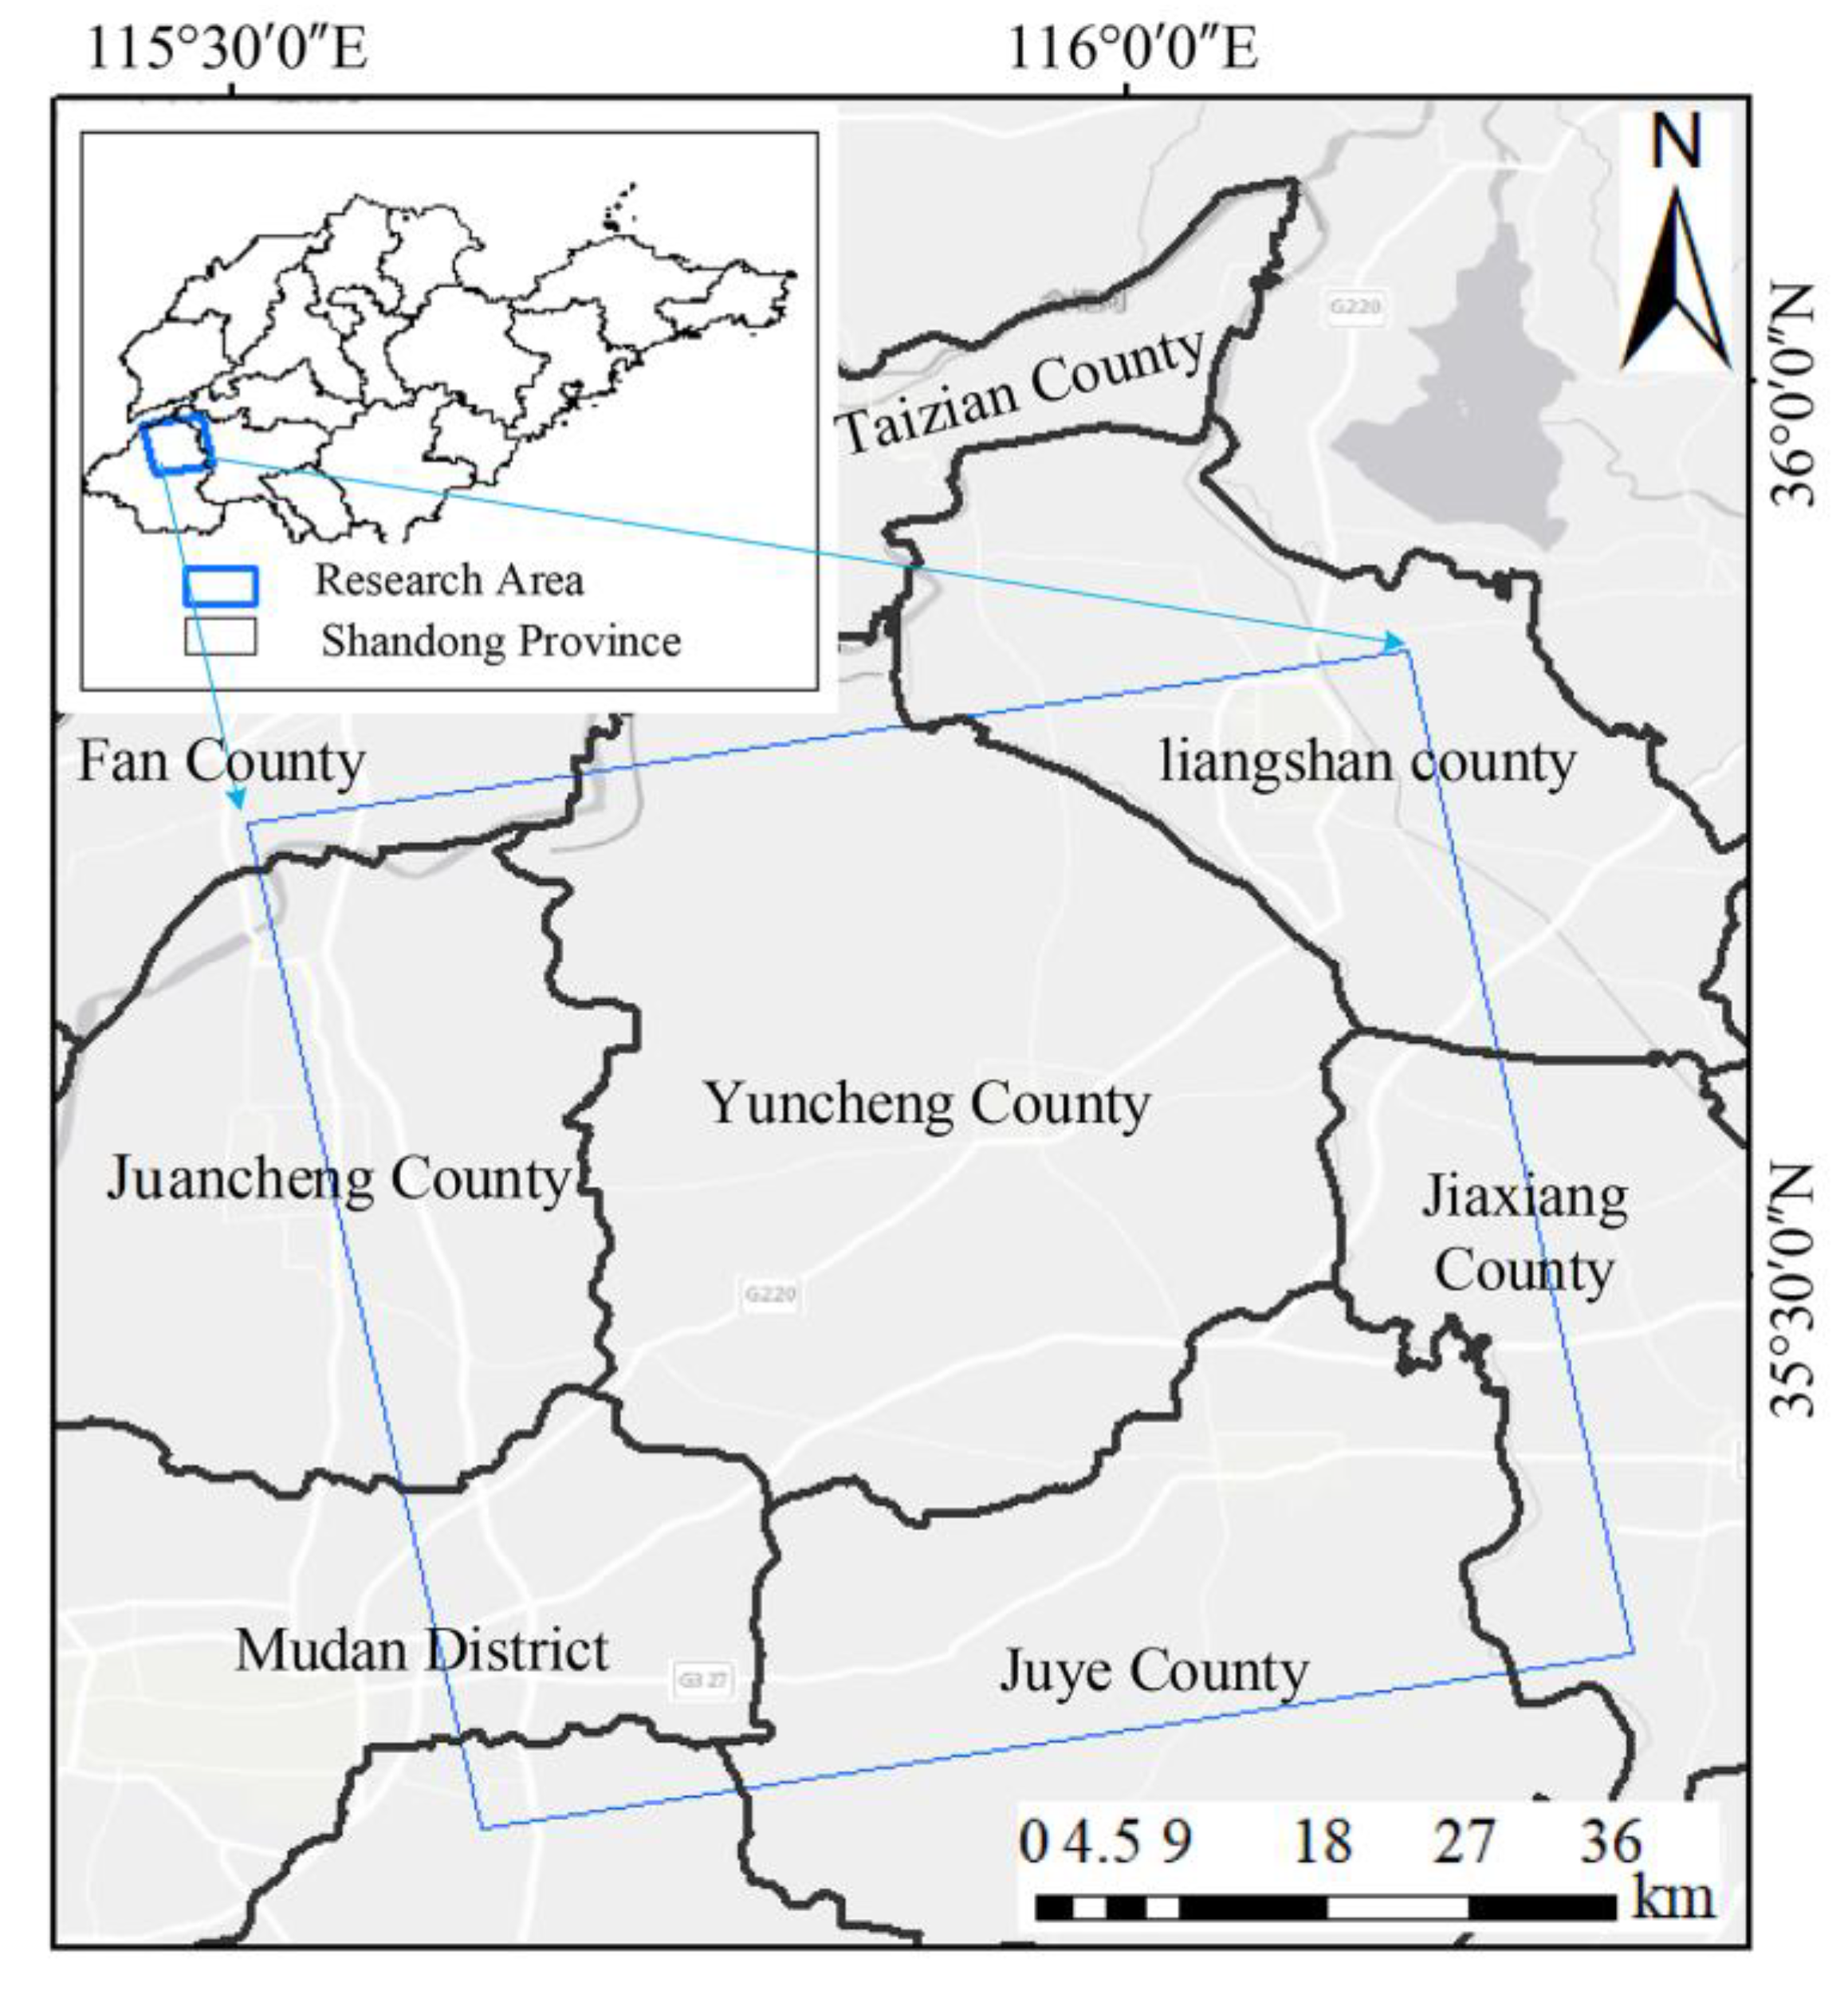
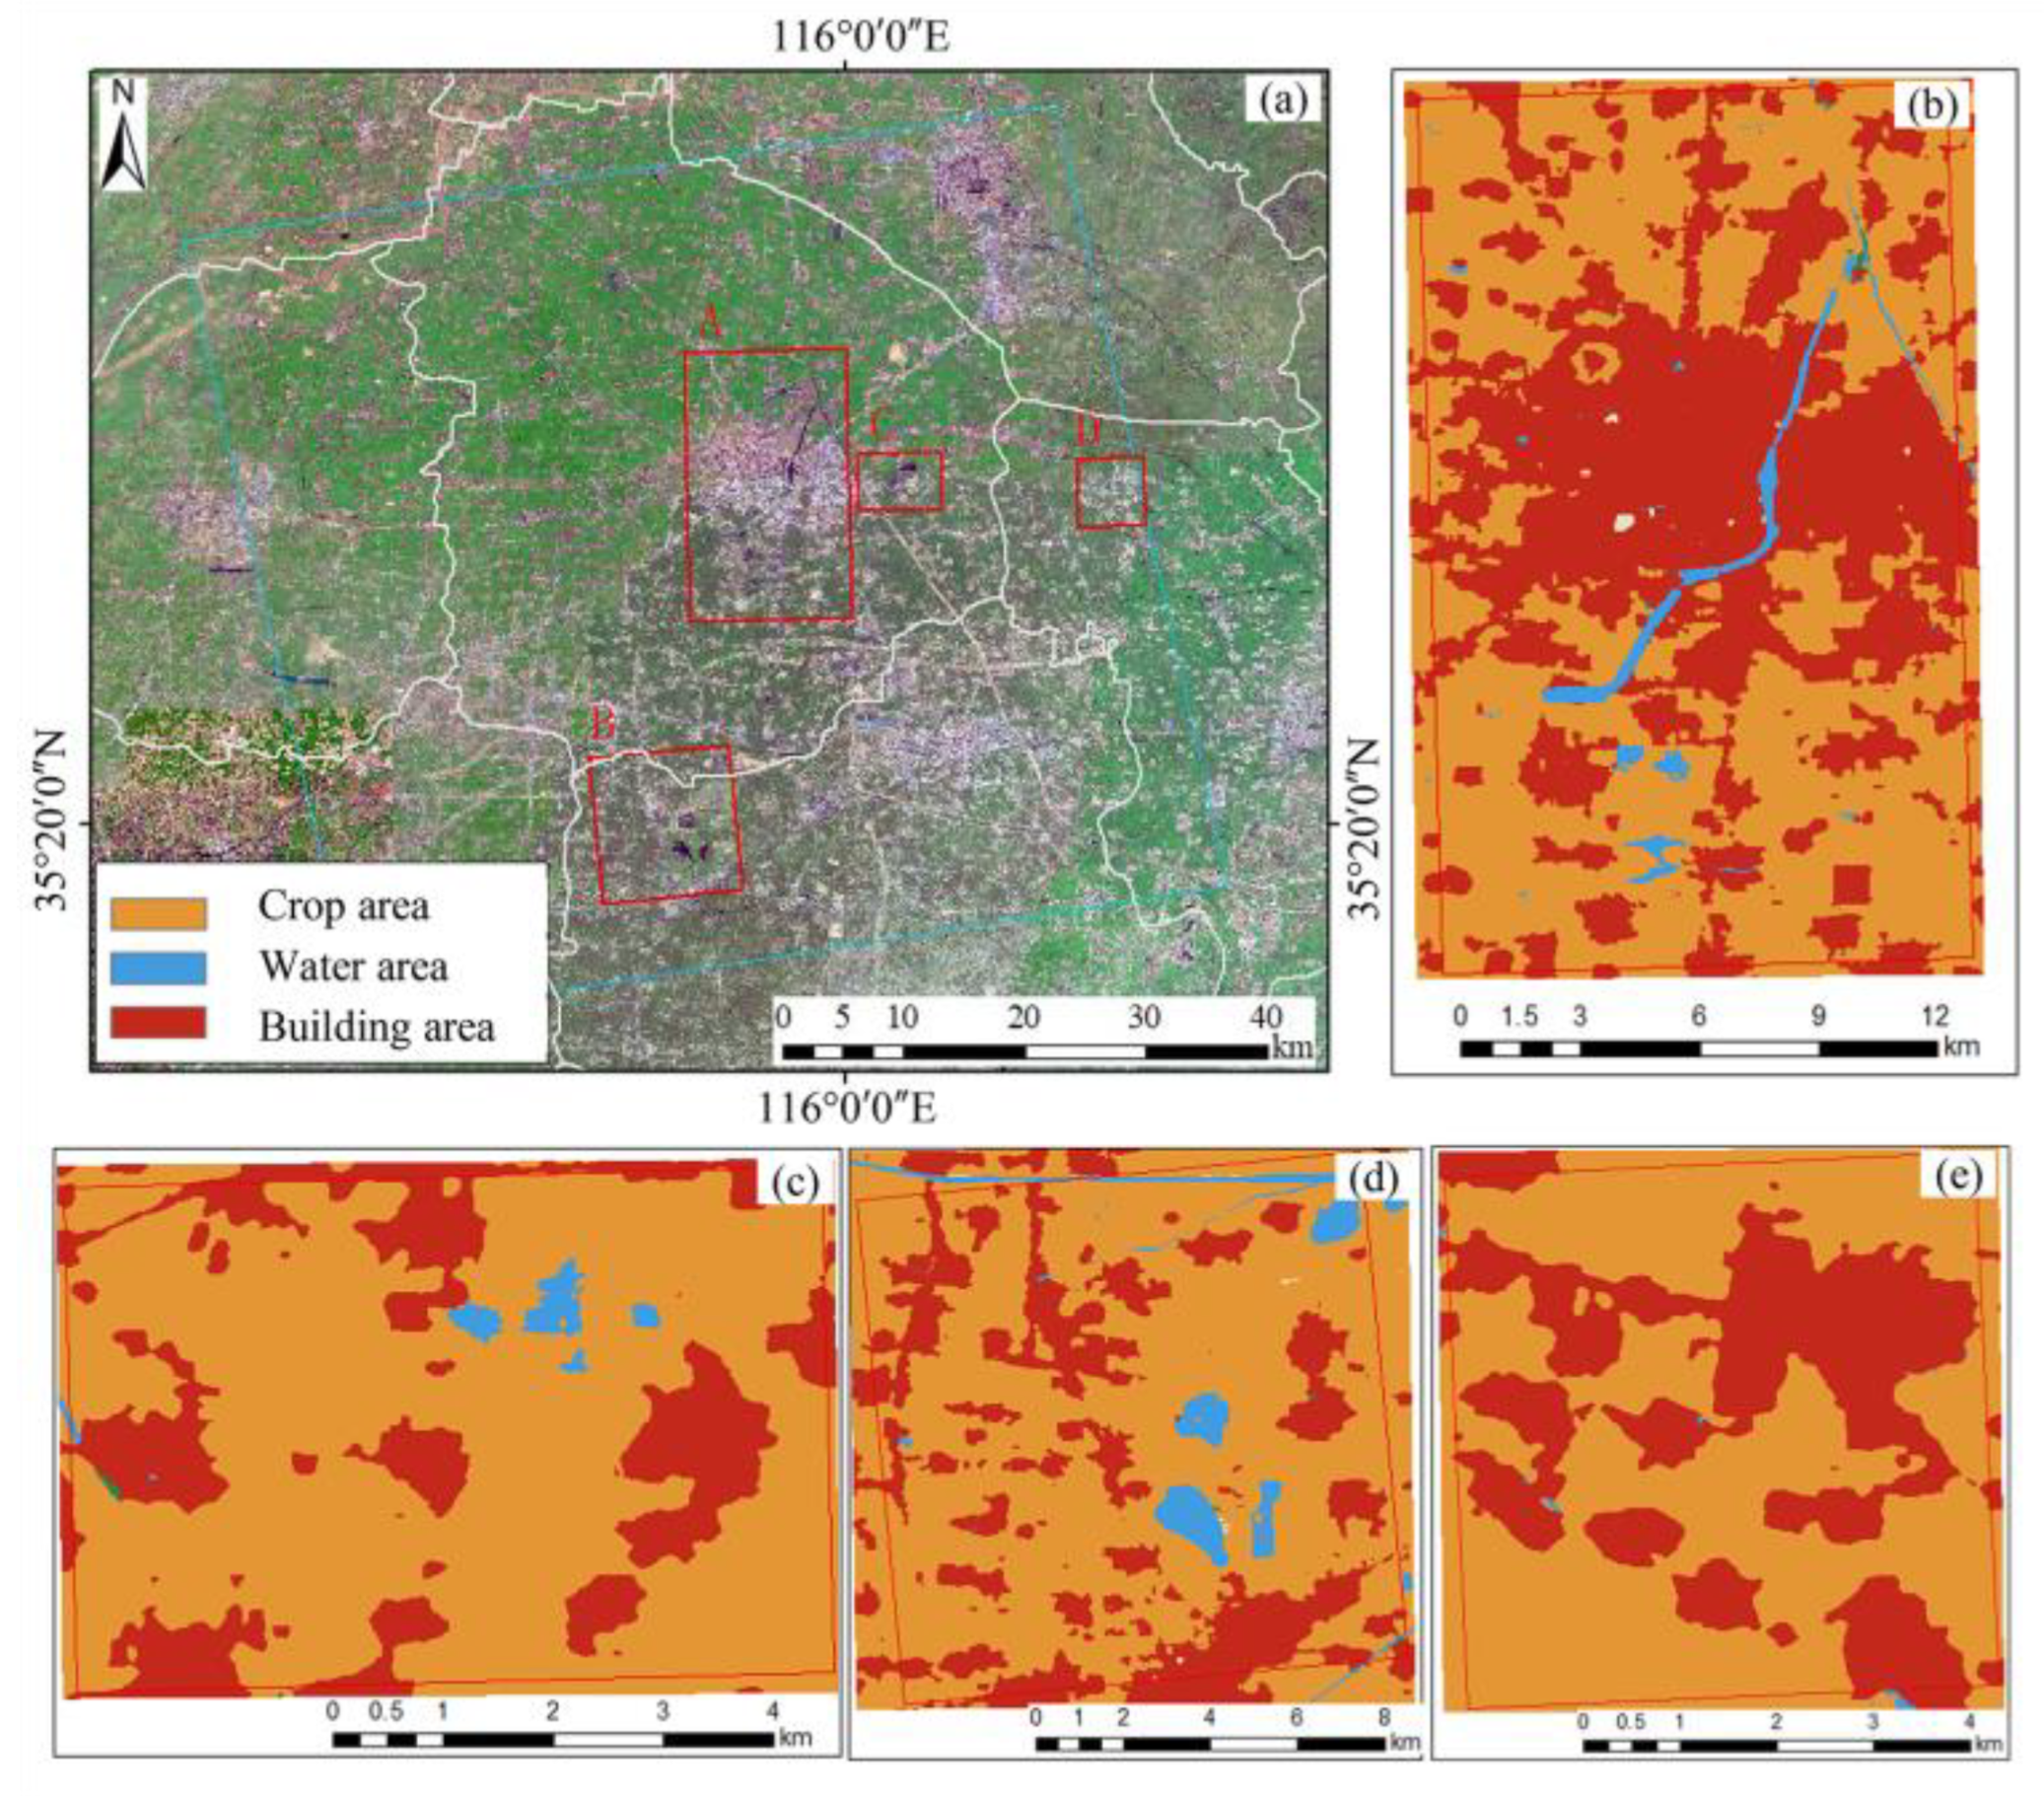
3.1. Study Area
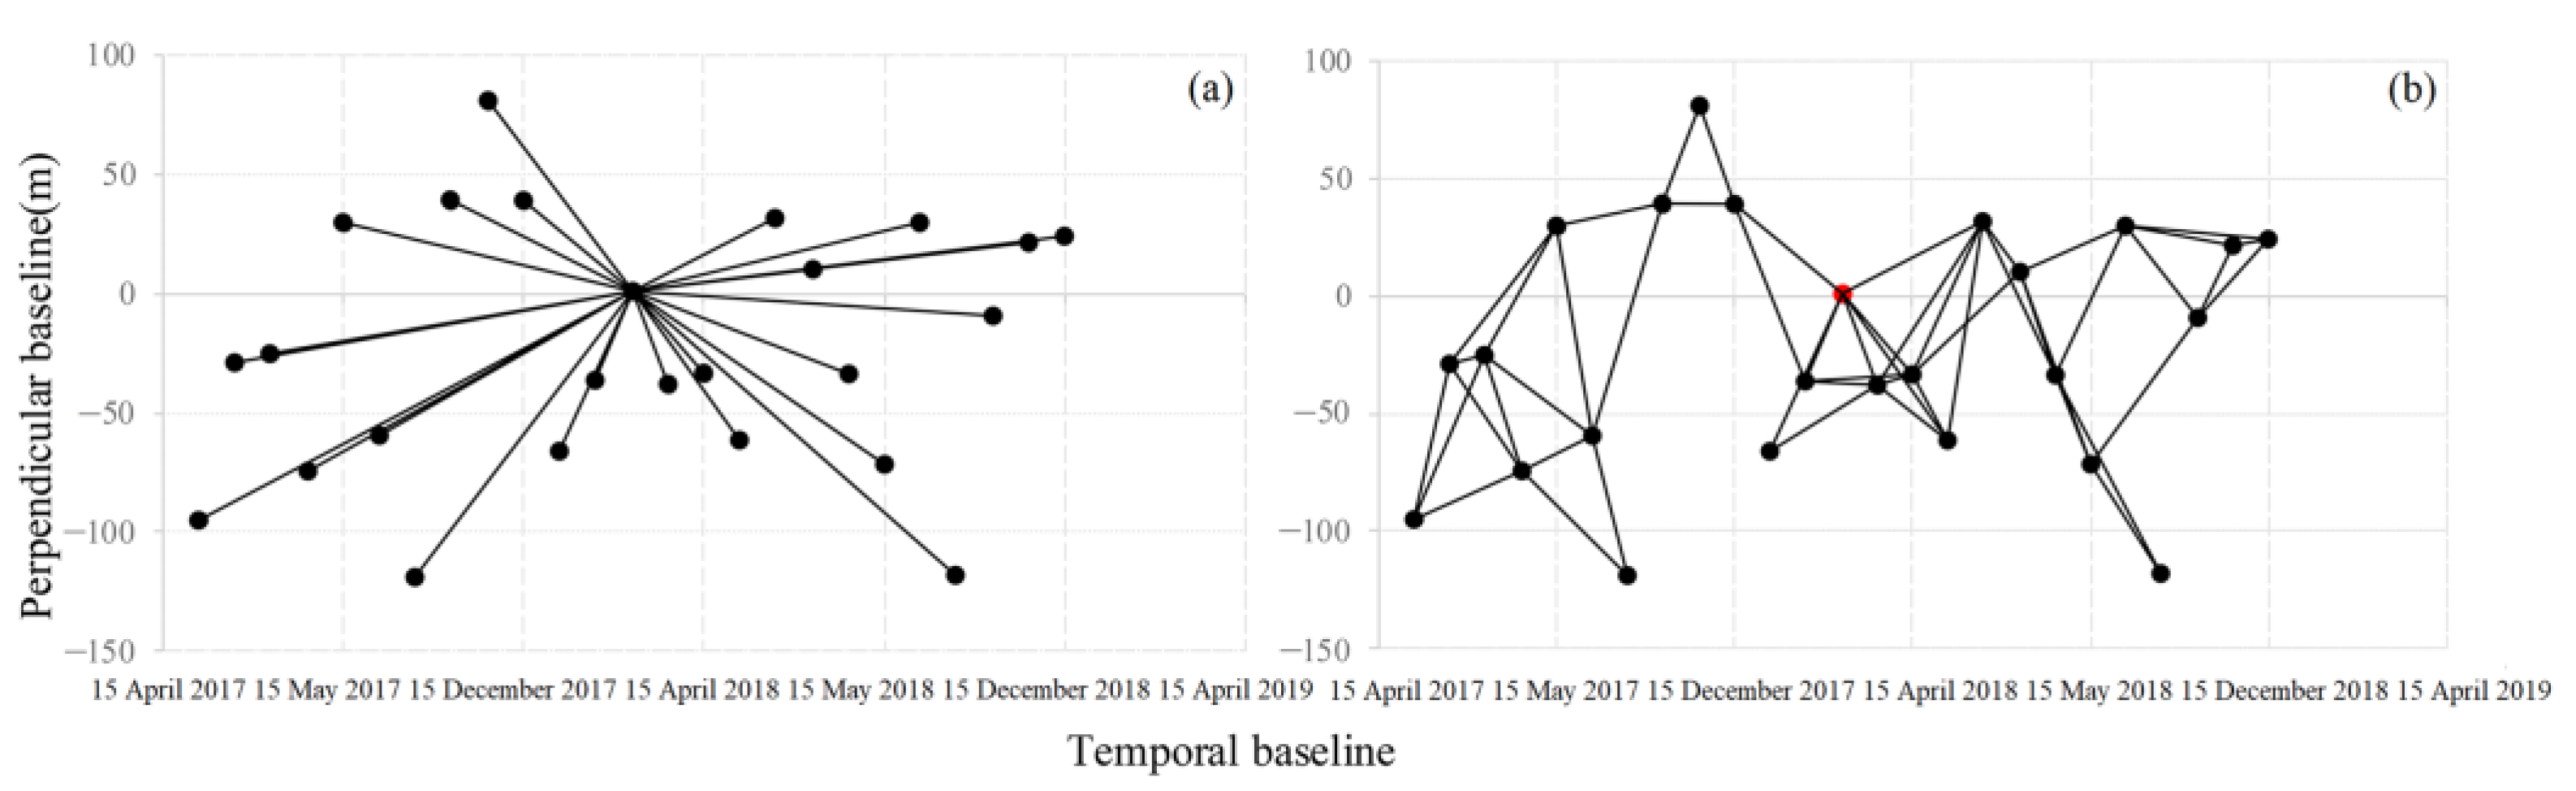
3.2. Datasets
3.3. Data Processing
4. Results
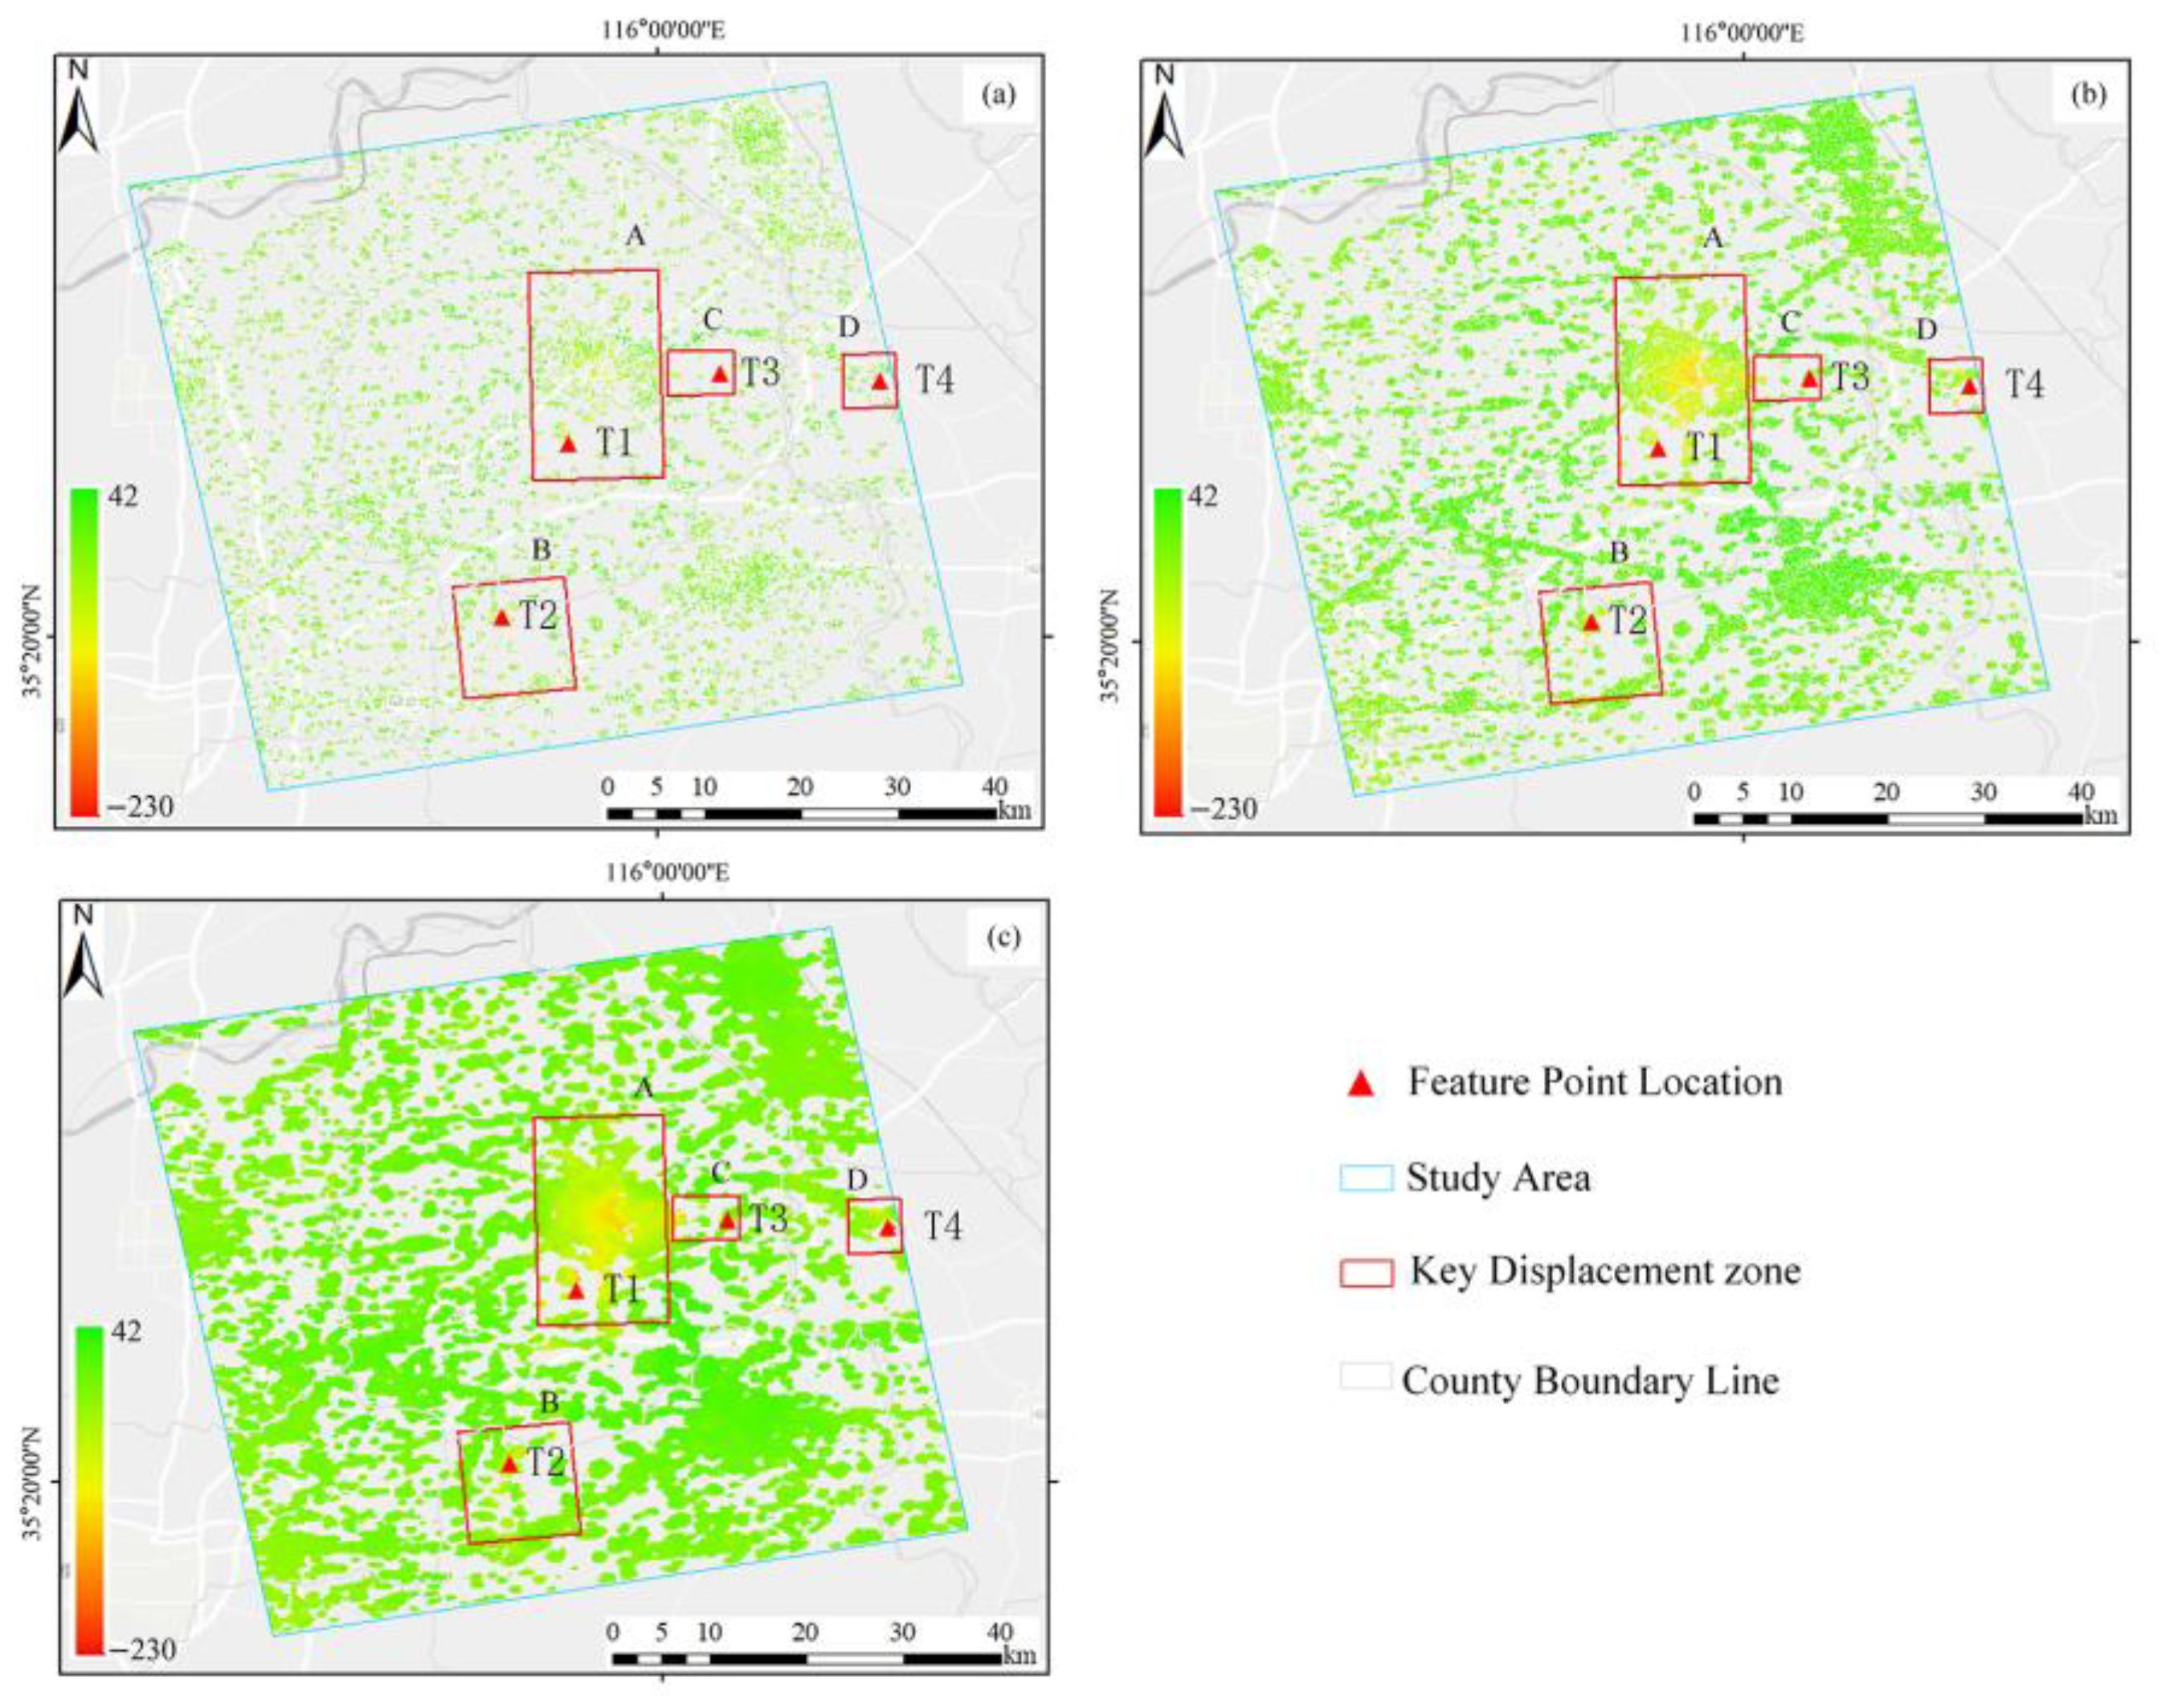
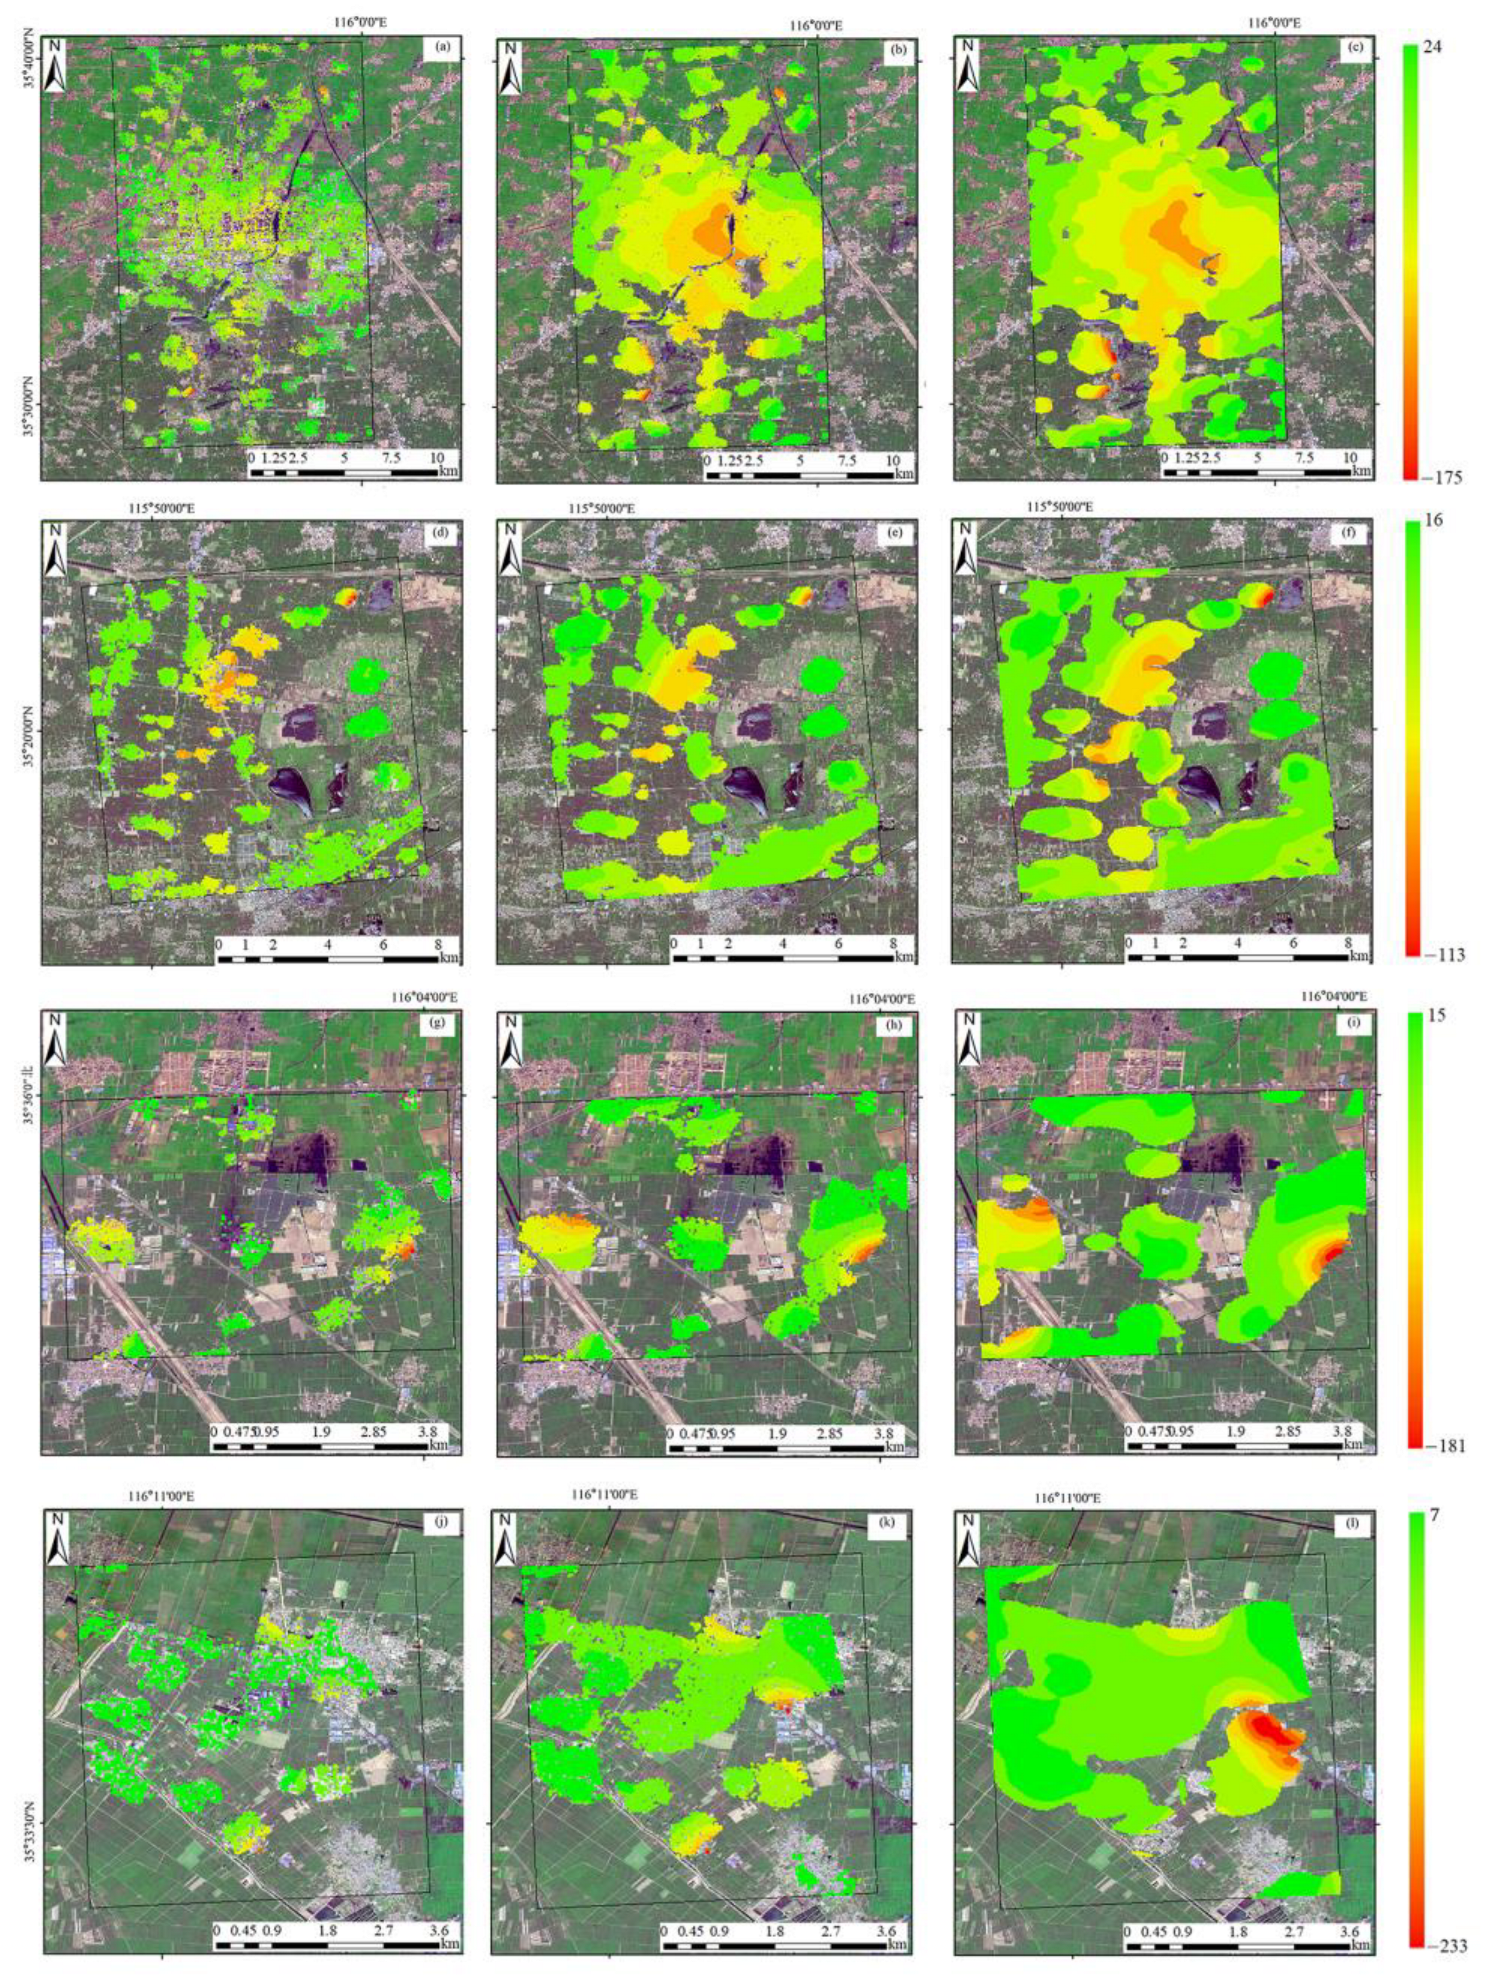
4.1. Ground Displacement Monitoring Result
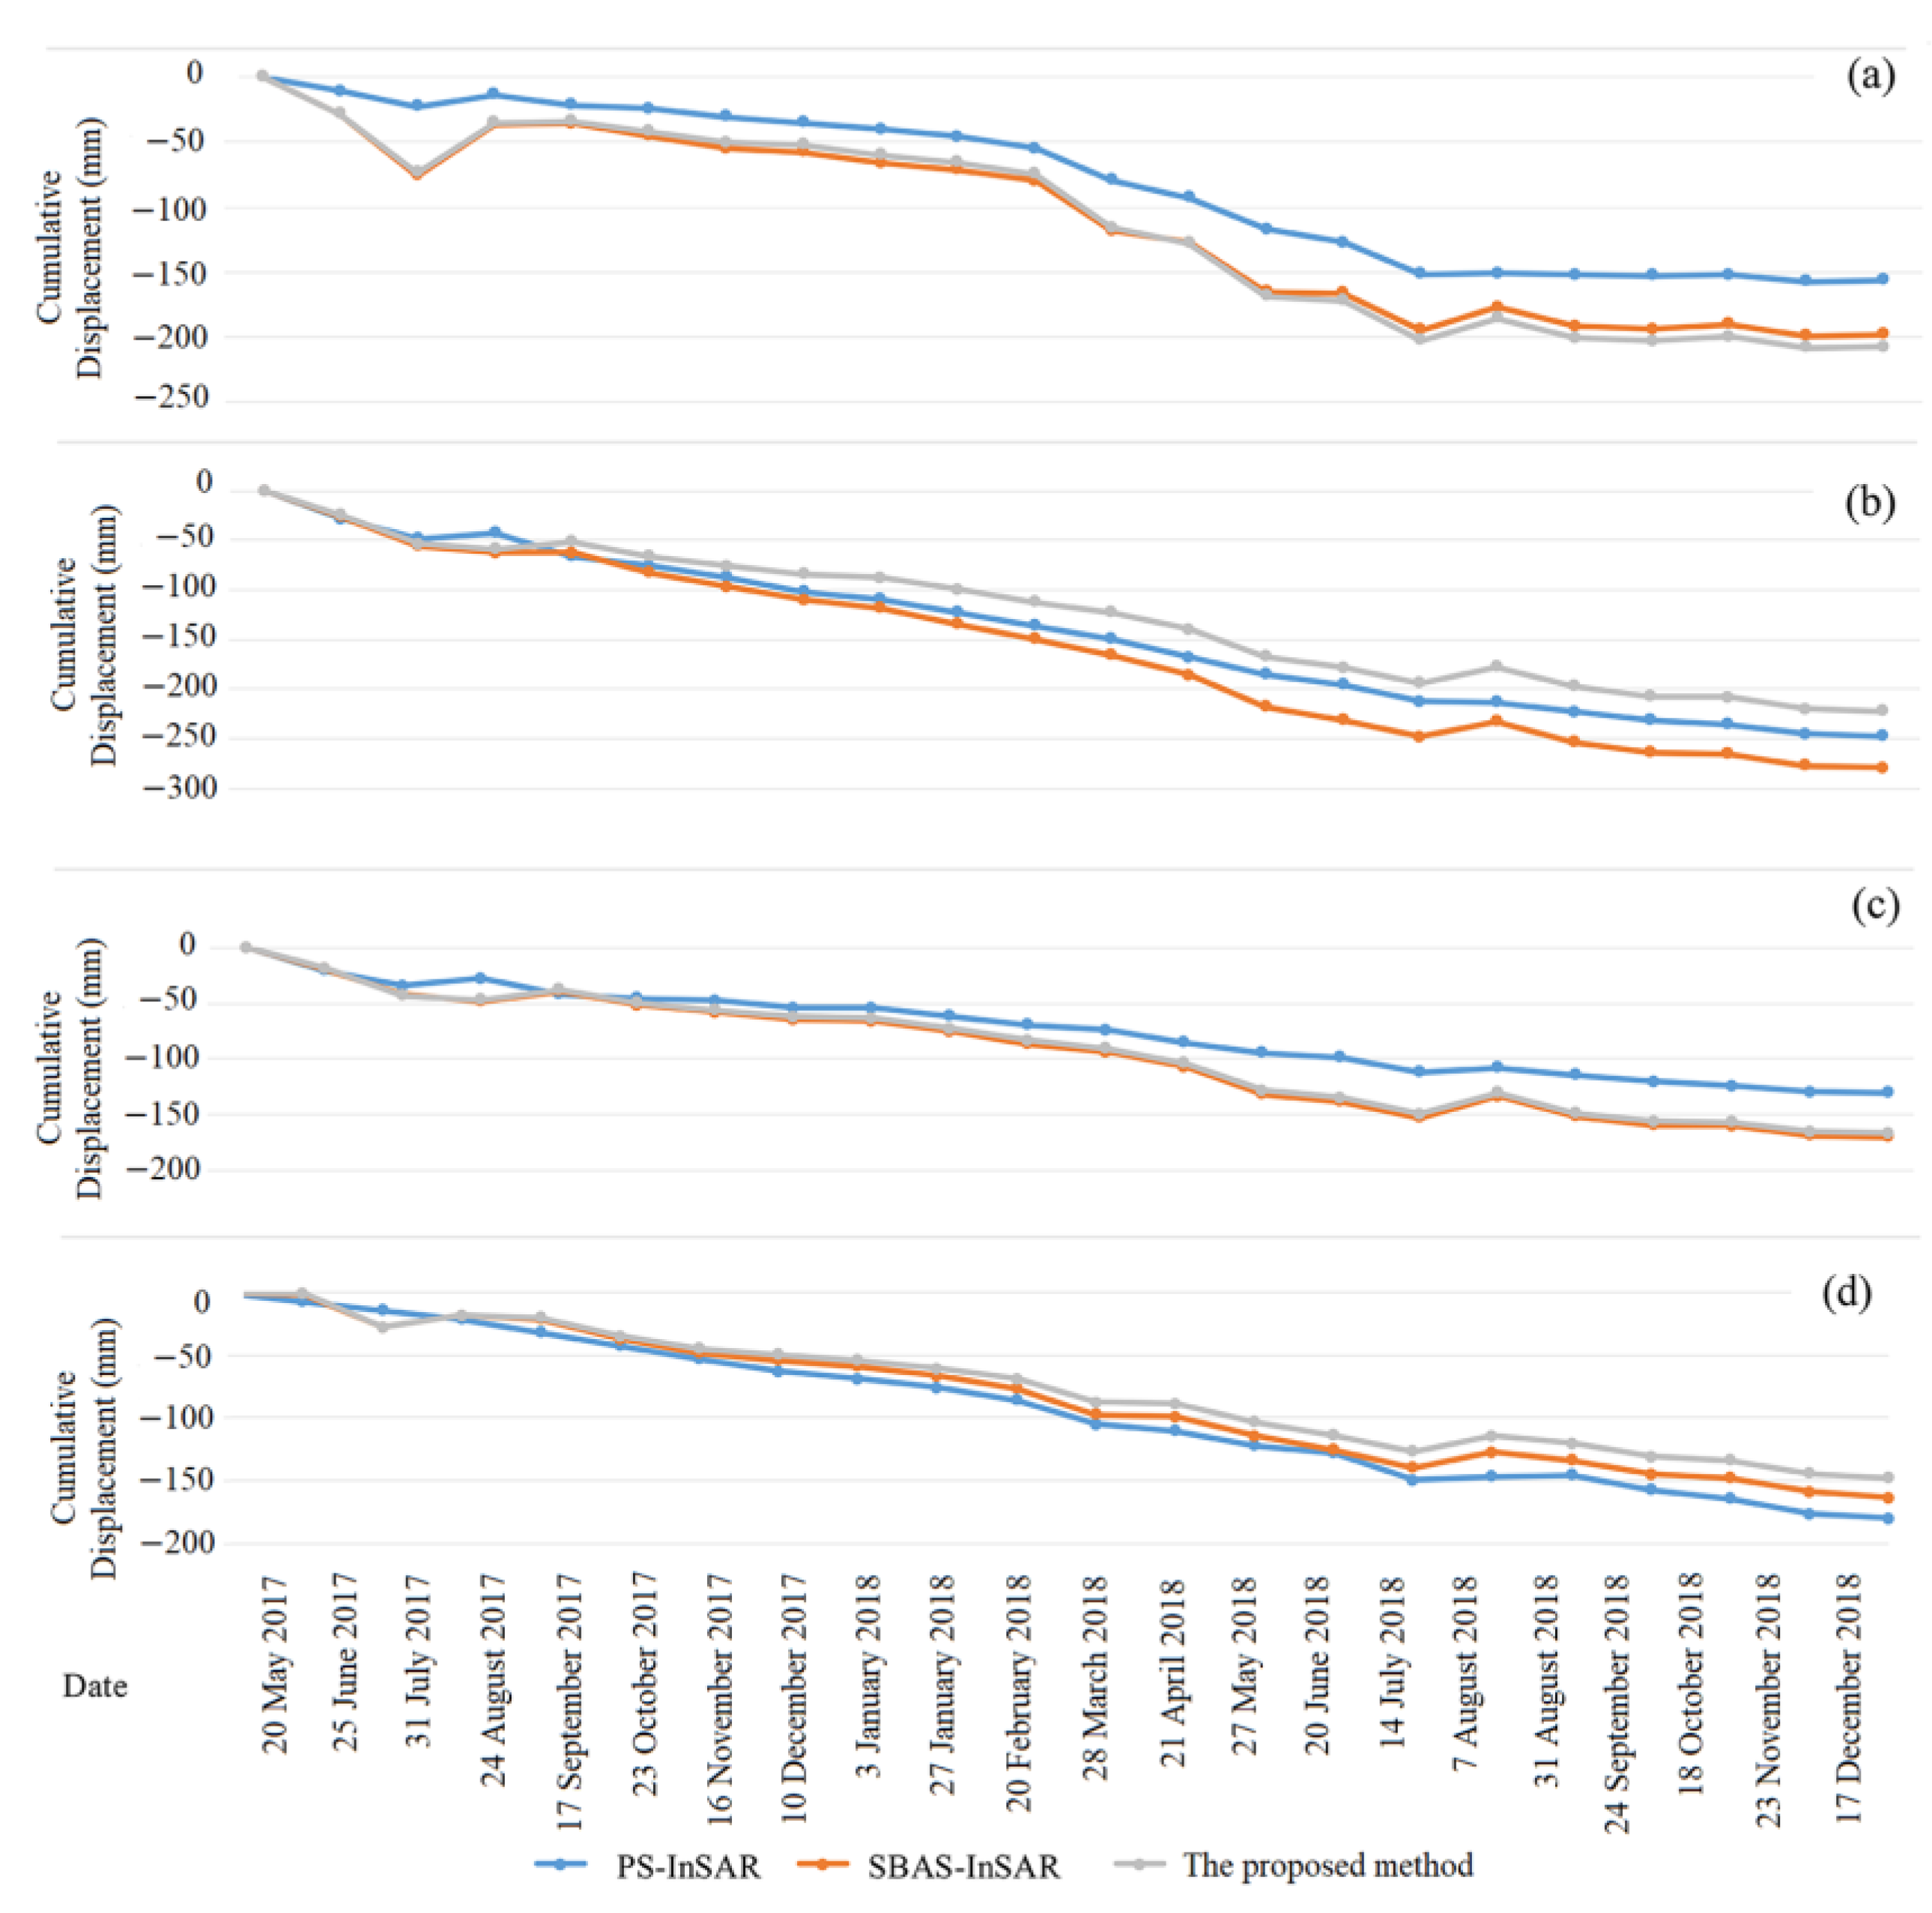
4.2. Time Series Analysis of Ground Displacement
5. Discussion
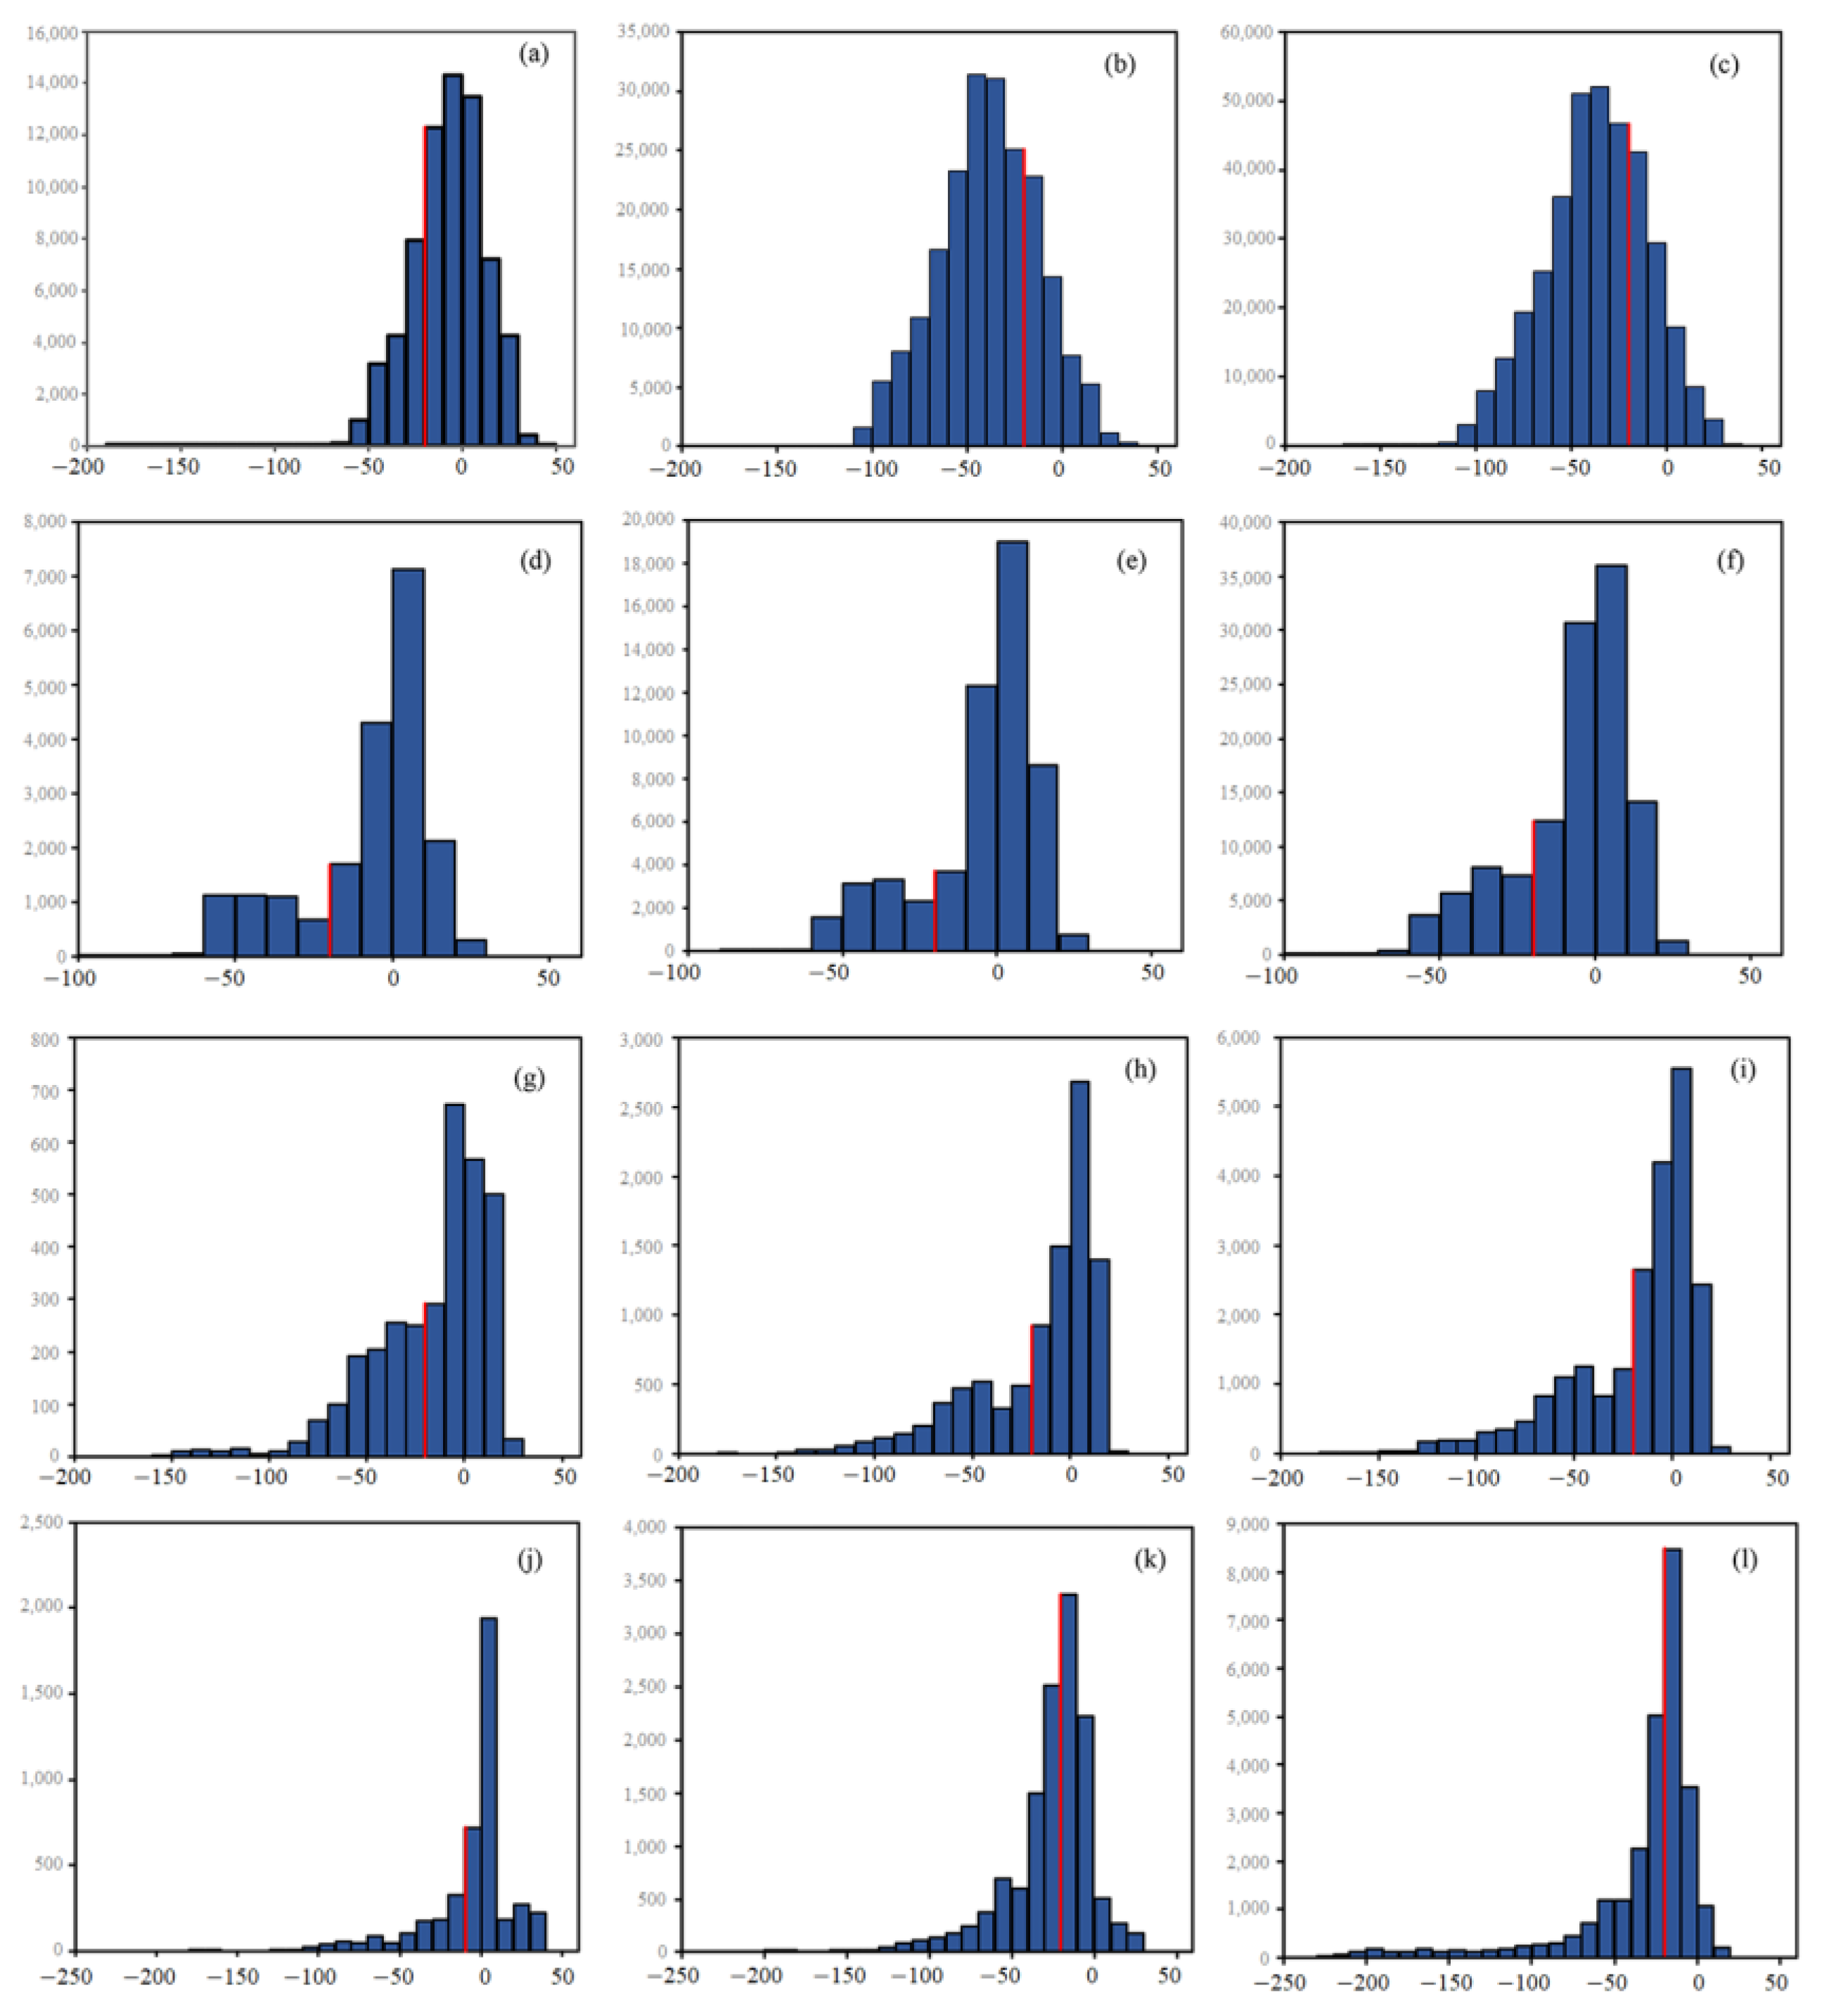
5.1. Comparative Analysis in the Quantity of CPs
5.2. Comparative Analysis on the Average Velocity of Ground Displacement
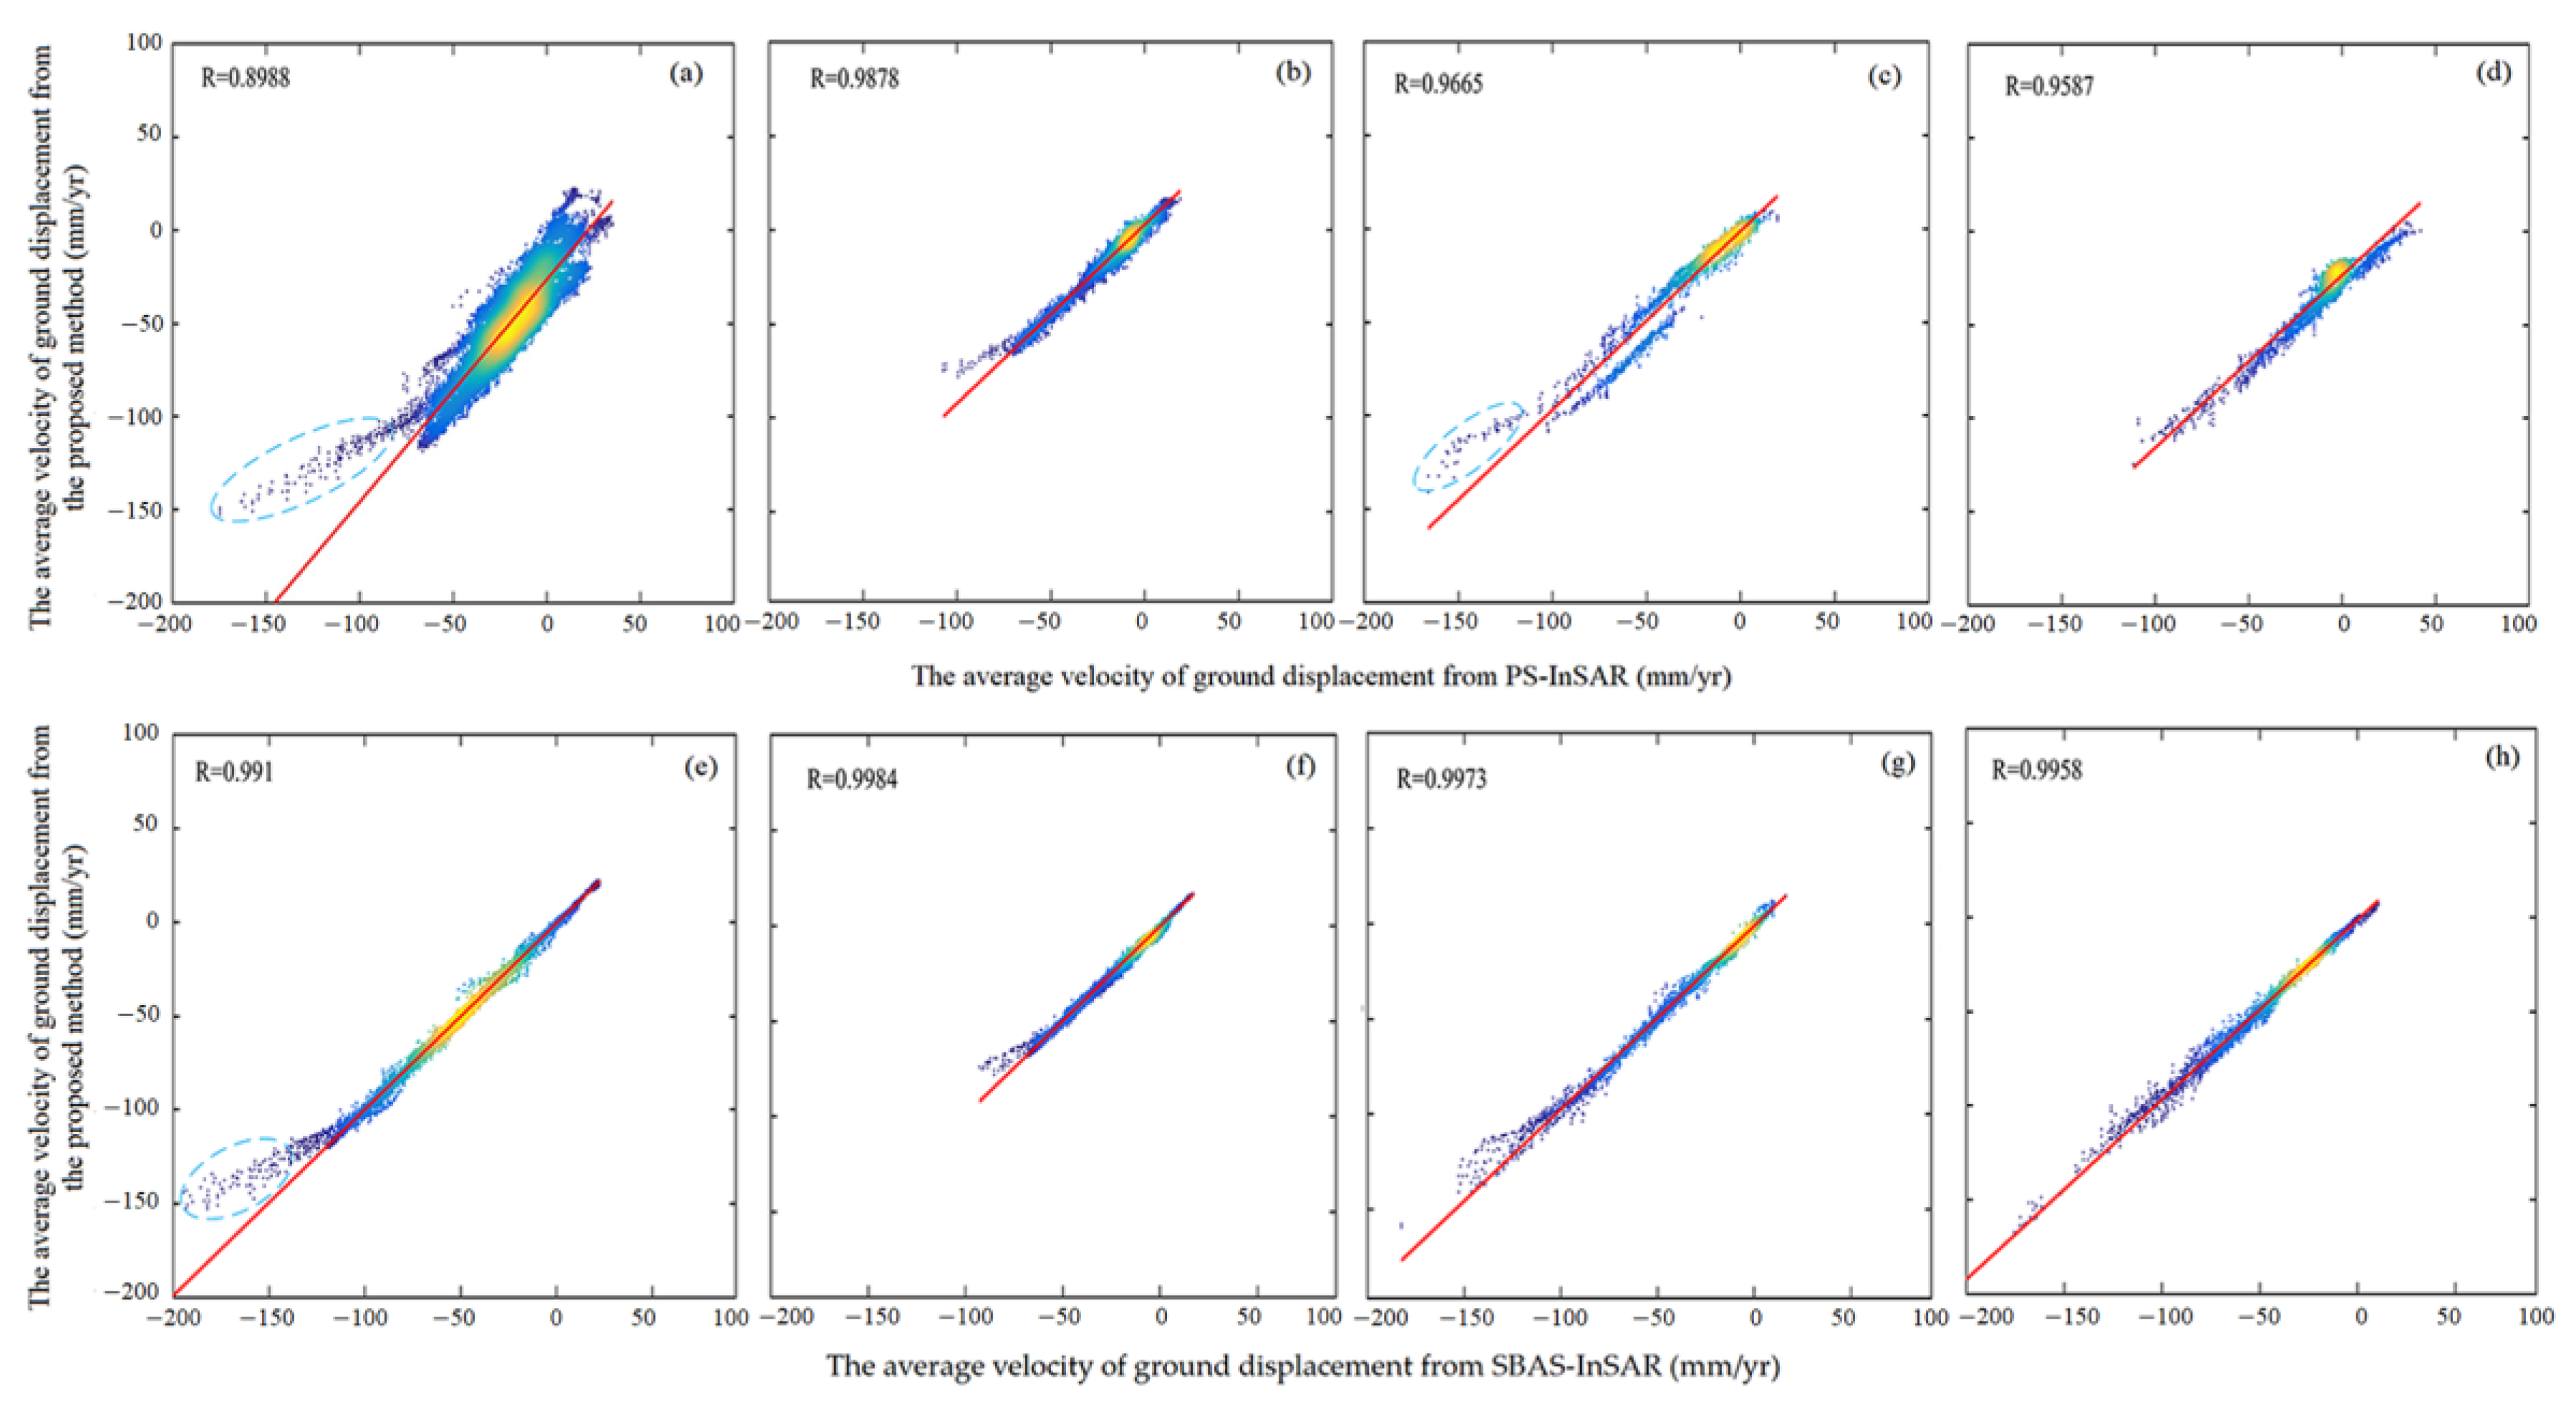
5.3. Correlation Analysis
6. Conclusions
- (1)
- Different InSAR techniques are used for ground displacement monitoring and different quantity of CPs are acquired, the different quantity of CPs lead to different displacement monitoring results (different ranges of displacement values), and the abundance of ground displacement information contained in different displacement value ranges varies.
- (2)
- Compared with the conventional time-series InSAR technique, the ground displacement monitoring results obtained by the proposed method have a wider range of values and provide a more comprehensive and refined presentation of ground displacement monitoring results.
- (3)
- The quantity of CPs and the density of spatial distribution obtained by the method proposed in this paper are significantly improved compared to the conventional time-series InSAR technique.
- (4)
- The displacement monitoring results from the proposed method is consistent with conventional time-series InSAR techniques in terms of displacement trends and distribution and more comparable to SBAS-InSAR in terms of displacement magnitude.
Author Contributions
Funding
Institutional Review Board Statement
Data Availability Statement
Acknowledgments
Conflicts of Interest
References
- Wu, Q.; Tu, K.; Zeng, Y. Research on China’s energy strategic situation under the carbon peaking and carbon neutrality goals. Chin. Sci. Bull. 2023, 68, 1884–1898. [Google Scholar]
- Cuenca, M.C.; Hooper, A.J.; Hanssen, R.F. Surface deformation induced by water influx in the abandoned coal mines in Limburg, The Netherlands observed by satellite radar interferometry. J. Appl. Geophys. 2013, 88, 1–11. [Google Scholar] [CrossRef]
- Zheng, M.; Deng, K.; Fan, H.; Du, S. Monitoring and Analysis of Surface Deformation in Mining Area Based on InSAR and GRACE. Remote Sens. 2018, 10, 1392. [Google Scholar] [CrossRef] [Green Version]
- Wang, L.; Deng, K.; Zheng, M. Research on ground deformation monitoring method in mining areas using the probability integral model fusion D-InSAR, sub-band InSAR and offset-tracking. Int. J. Appl. Earth Obs. Geoinf. 2020, 85, 101981. [Google Scholar] [CrossRef]
- Shi, M.; Yang, H.; Wang, B.; Peng, J.; Gao, Z.; Zhang, B. Improving Boundary Constraint of Probability Integral Method in SBAS-InSAR for Deformation Monitoring in Mining Areas. Remote Sens. 2021, 13, 1497. [Google Scholar] [CrossRef]
- Zhu, S.; Zuo, X.; Shi, K.; Li, Y.; Guo, S.; Li, C. Surface Subsidence Monitoring in Kunming City with Time-Series InSAR and GNSS. Appl. Sci. 2022, 12, 12752. [Google Scholar] [CrossRef]
- Vanicek, P.; Castle, R.O.; Balazs, E.I. Geodetic leveling and its applications. Rev. Geophys. 1980, 18, 505–524. [Google Scholar] [CrossRef]
- Zhang, W.; Shi, J.; Yi, H.; Zhu, Y.; Xu, B. Underground Goaf Parameters Estimation by Cross-Iteration with InSAR Measurements. Remote Sens. 2021, 13, 3204. [Google Scholar] [CrossRef]
- Tao, Q.; Wang, F.; Guo, Z.; Hu, L.; Yang, C.; Liu, T. Accuracy verification and evaluation of small baseline subset (SBAS) interferometric synthetic aperture radar (InSAR) for monitoring mining subsidence. Eur. J. Remote Sens. 2021, 54, 642–663. [Google Scholar] [CrossRef]
- Maghsoudi, Y.; van der Meer, F.; Hecker, C.; Perissin, D.; Saepuloh, A. Using PS-InSAR to detect surface deformation in geothermal areas of West Java in Indonesia. Int. J. Appl. Earth Obs. Geoinf. 2018, 64, 386–396. [Google Scholar] [CrossRef]
- Akcin, H.; Kutoglu, H.S.; Kemaldere, H.; Deguchi, T.; Koksal, E. Monitoring subsidence effects in the urban area of Zonguldak Hardcoal Basin of Turkey by InSAR-GIS integration. Nat. Hazards Earth Syst. Sci. 2010, 10, 1807–1814. [Google Scholar] [CrossRef]
- Dang, V.K.; Nguyen, T.D.; Dao, N.H.; Duong, T.L.; Dinh, X.V.; Weber, C. Land subsidence induced by underground coal mining at Quang Ninh, Vietnam: Persistent scatterer interferometric synthetic aperture radar observation using sentinel-1 data. Int. J. Remote Sens. 2021, 42, 3563–3582. [Google Scholar] [CrossRef]
- Przyłucka, M.; Herrera, G.; Graniczny, M.; Colombo, D.; Béjar-Pizarro, M. Combination of conventional and advanced DInSAR to monitor very fast mining subsidence with TerraSAR-X data: Bytom city (Poland). Remote Sens. 2015, 7, 5300–5328. [Google Scholar] [CrossRef] [Green Version]
- Zhang, Z.; Wang, C.; Tang, Y.; Fu, Q.; Zhang, H. Subsidence monitoring in coal area using time-series InSAR combining persistent scatterers and distributed scatterers. Int. J. Appl. Earth Obs. Geoinf. 2015, 39, 49–55. [Google Scholar] [CrossRef]
- Ferretti, A.; Fumagalli, A.; Novali, F.; Prati, C.; Rocca, F.; Rucci, A. A new algorithm for processing interferometric data-stacks: SqueeSAR. IEEE Trans. Geosci. Remote Sens. 2011, 49, 3460–3470. [Google Scholar] [CrossRef]
- Dong, J.; Zhang, L.; Tang, M.; Liao, M.; Xu, Q.; Gong, J.; Ao, M. Mapping landslide surface displacements with time series SAR interferometry by combining persistent and distributed scatterers: A case study of Jiaju landslide in Danba, China. Remote Sens. Environ. 2018, 205, 180–198. [Google Scholar] [CrossRef]
- Hooper, A. A multi-temporal InSAR method incorporating both persistent scatterer and small baseline approaches. Geophys. Res. Lett. 2008, 35, L16302. [Google Scholar] [CrossRef] [Green Version]
- Lv, X.; Yazıcı, B.; Zeghal, M.; Bennett, V.; Abdoun, T. Joint-scatterer processing for time-series InSAR. IEEE Trans. Geosci. Remote Sens. 2014, 52, 7205–7221. [Google Scholar]
- Fornaro, G.; Verde, S.; Reale, D.; Pauciullo, A. CAESAR: An approach based on covariance matrix decomposition to improve multibaseline–multitemporal interferometric SAR processing. IEEE Trans. Geosci. Remote Sens. 2015, 53, 2050–2065. [Google Scholar] [CrossRef]
- Cao, N.; Lee, H.; Jung, H.C. A phase-decomposition-based PSInSAR processing method. IEEE Trans. Geosci. Remote Sens. 2015, 54, 1074–1090. [Google Scholar] [CrossRef]
- Wang, Y.; Zhu, X.X.; Bamler, R. Retrieval of phase history parameters from distributed scatterers in urban areas using very high resolution SAR data. ISPRS J. Photogramm. Remote Sens. 2012, 73, 89–99. [Google Scholar] [CrossRef] [Green Version]
- Jiang, M.; Miao, Z.; Gamba, P.; Yong, B. Application of Multitemporal InSAR Covariance and Information Fusion to Robust Road Extraction. IEEE Trans. Geosci. Remote Sens. 2017, 55, 3611–3622. [Google Scholar] [CrossRef]
- Jiang, M.; Guarnieri, A.M. Distributed Scatterer Interferometry with the Refinement of Spatiotemporal Coherence. IEEE Trans. Geosci. Remote Sens. 2020, 58, 3977–3987. [Google Scholar] [CrossRef]
- Hooper, A.; Zebker, H.A. Phase unwrapping in three dimensions with application to InSAR time series. J. Opt. Soc. Am. A 2007, 24, 2737–2747. [Google Scholar] [CrossRef] [Green Version]
- Hooper, A.J. Persistent Scatter Radar Interferometry for Crustal Deformation Studies and Modeling of Volcanic Deformation. Ph.D. Thesis, Department of Geophysics, Stanford University, Stanford, CA, USA, 2006. [Google Scholar]
- Jia, C.; Yang, X.; Wu, J.; Ding, P.; Bian, C. Monitoring Analysis and Numerical Simulation of the Land Subsidence in Linear Engineering Areas. KSCE J. Civ. Eng. 2021, 25, 2674–2689. [Google Scholar] [CrossRef]
- Chen, Y.; Yu, S.; Tao, Q.; Liu, G.; Wang, L.; Wang, F. Accuracy Verification and Correction of D-InSAR and SBAS-InSAR in Monitoring Mining Surface Subsidence. Remote Sens. 2021, 13, 4365. [Google Scholar] [CrossRef]
- Zhang, T.X. Advanced Coregistration Methods of Sentinel-1 A/B Satelliates and Its Application in Tianjin Area. Ph.D. Thesis, School of Geodesy and Geomatics, Wuhan University, Wuhan, China, 2019. [Google Scholar]
- European Space Agency. Available online: https://scihub.copernicus.eu/gnss/#/home (accessed on 3 April 2014).
- Tao, Q.; Gao, T.; Liu, G.; Wang, Z. Effect of external digital elevation model on monitoring of mine subsidence by two-pass differential interferometric synthetic aperture radar. J. Appl. Remote Sens. 2017, 11, 026037. [Google Scholar] [CrossRef] [Green Version]
- Hooper, A.; Bekaert, D.; Spaans, K.; Arıkan, M. Recent advances in SAR interferometry time series analysis for measuring crustal deformation. Tectonophysics 2012, 514–517, 1–13. [Google Scholar] [CrossRef]
- Jiang, M.; Ding, X.; Tian, X.; Malhotra, R.; Kong, W. A hybrid method for optimization of the adaptive Goldstein filter. ISPRS J. Photogramm. Remote Sens. 2014, 98, 29–43. [Google Scholar] [CrossRef]
- Jiang, M.; Ding, X.; Li, Z. Homogeneous pixel selection algorithm for multitemporal InSAR. Chin. J. Geophys. 2018, 61, 4767–4776. [Google Scholar]
- Xing, H.; Chen, J.; Wu, H.; Hou, D. A web service-oriented geoprocessing system for supporting intelligent land cover change detection. ISPRS Int. J. Geo-Inf. 2019, 8, 50. [Google Scholar] [CrossRef] [Green Version]
- Karra, K.; Kontgis, C.; Statman-Weil, Z.; Mazzariello, J.C.; Mathis, M.; Brumby, S.P. Global land use/land cover with Sentinel-2 and deep learning. In Proceedings of the 2021 IEEE International Geoscience and Remote Sensing Symposium IGARSS, Brussels, Belgium, 11–16 July 2021. [Google Scholar]
- Liu, Y.; Fan, H.; Wang, L.; Zhuang, H. Monitoring of surface deformation in a low coherence area using distributed scatterers InSAR: Case study in the Xiaolangdi Basin of the Yellow River, China. Bull. Eng. Geol. Environ. 2021, 80, 25–39. [Google Scholar] [CrossRef]
- Zhang, L.; Liao, M.S.; Dong, J.; Xu, Q.; Gong, J.Y. Early detection of landslide hazards in mountainous areas of west China using time series SAR interferometry–A case study of Danba, Sichuan. Geomat. Inf. Sci. Wuhan Univ. 2018, 43, 2039–2049. [Google Scholar]
- Jiang, Z.; Yu, S.; Tao, Q. Application of StaMPS-MTI Technology in Monitoring Ground Subsidence. J. Southwest Jiaotong Univ. 2017, 52, 295–302. [Google Scholar]
- Crosetto, M.; Monserrat, O.; Cuevas-González, M.; Devanthéry, N.; Crippa, B. Persistent Scatterer Interferometry: A review. ISPRS J. Photogramm. Remote Sens. 2016, 115, 78–89. [Google Scholar] [CrossRef] [Green Version]


| Items | Description |
|---|---|
| Strip mode | IW |
| Orbital inclination | 98.18° |
| Waveband | C |
| Incidence angle | 33.88° |
| Orbital height | 693 km |
| Orbit direction | Ascending |
| Polarization | VV |
| Path | 40 |
| Frame | 112 |
| Resolution | Range 2.3 m/Azimuth 13.9 m |
| Time spans | 20 May 2017–17 December 2018 |
| Methods | Parameters | in A | in B | in C | in D |
|---|---|---|---|---|---|
| The proposed method | Quantity | 356,939 | 119,602 | 21,890 | 26,333 |
| PS-InSAR | Quantity | 68,816 | 19,560 | 3229 | 4895 |
| Multiples of increase | 5.1 | 6.1 | 6.7 | 5.3 | |
| SBAS-InSAR | Quantity | 232,373 | 54,701 | 9306 | 13,114 |
| Multiples of increase | 1.5 | 2.1 | 2.3 | 2.0 |
| Methods | in A | in B | in C | in D |
|---|---|---|---|---|
| PS-InSAR | 15.1 | 6.2 | 5.98 | 17.47 |
| SBAS-InSAR | 1.65 | 2.44 | 3.88 | 2 |
Disclaimer/Publisher’s Note: The statements, opinions and data contained in all publications are solely those of the individual author(s) and contributor(s) and not of MDPI and/or the editor(s). MDPI and/or the editor(s) disclaim responsibility for any injury to people or property resulting from any ideas, methods, instructions or products referred to in the content. |
© 2023 by the authors. Licensee MDPI, Basel, Switzerland. This article is an open access article distributed under the terms and conditions of the Creative Commons Attribution (CC BY) license (https://creativecommons.org/licenses/by/4.0/).
Share and Cite
Wang, Z.; Li, W.; Zhao, Y.; Jiang, A.; Zhao, T.; Guo, Q.; Li, W.; Chen, Y.; Ren, X. Monitoring Ground Displacement in Mining Areas with Time-Series Interferometric Synthetic Aperture Radar by Integrating Persistent Scatterer/Slowly Decoherent Filtering Phase/Distributed Scatterer Approaches Based on Signal-to-Noise Ratio. Appl. Sci. 2023, 13, 8695. https://doi.org/10.3390/app13158695
Wang Z, Li W, Zhao Y, Jiang A, Zhao T, Guo Q, Li W, Chen Y, Ren X. Monitoring Ground Displacement in Mining Areas with Time-Series Interferometric Synthetic Aperture Radar by Integrating Persistent Scatterer/Slowly Decoherent Filtering Phase/Distributed Scatterer Approaches Based on Signal-to-Noise Ratio. Applied Sciences. 2023; 13(15):8695. https://doi.org/10.3390/app13158695
Chicago/Turabian StyleWang, Zhiwei, Wenhui Li, Yue Zhao, Aihui Jiang, Tonglong Zhao, Qiuying Guo, Wanqiu Li, Yang Chen, and Xiaofang Ren. 2023. "Monitoring Ground Displacement in Mining Areas with Time-Series Interferometric Synthetic Aperture Radar by Integrating Persistent Scatterer/Slowly Decoherent Filtering Phase/Distributed Scatterer Approaches Based on Signal-to-Noise Ratio" Applied Sciences 13, no. 15: 8695. https://doi.org/10.3390/app13158695