Uber Data Science Project - Partner Business Modeling


Today, we’ll explore the data project that was a part of the recruitment process at Uber and uncover the key steps and requirements for success.
Uber is one of the world's largest ride-hailing companies, with millions of drivers and riders using its platform daily.
To keep up with the growing ride demand, Uber constantly seeks ways to incentivize drivers to go online and pick up more passengers.
In this article, we have one of the data science projects which has been used as a take-home assignment in the recruitment process for the data science positions. And in this data project from Uber, we have to analyze two different scenarios.
First, we will explore two bonus options for drivers to encourage them to drive more online. We will also analyze the financial impact of partnering with Uber for a taxi driver.
Second, we will analyze a business model for Uber drivers.
Through this analysis, we will gain a deeper understanding of the financial implications of the different bonus options and the potential benefits of partnering with Uber for taxi drivers.
Link to the Project: https://platform.stratascratch.com/data-projects/partner-business-modeling
Different Scenarios for This Data Science Project
We have 2 different scenarios, and here is the first one.
Scenario 1

We also have a two-part video walkthrough for this scenario.
Scenario 2
We also have a video walkthrough for this scenario.
Now, you are familiar with the Scenarios and questions.
To answer these questions, first, let’s explore and clear our data frame to gain a better understanding and make it ready for analysis.
Data Exploration
In this section, we will explore the dataset provided by Uber.
We will use the pandas and NumPy libraries for data manipulation and Matplotlib for data visualization.
First, we import the necessary libraries by running the following code.
import pandas as pd
import numpy as np
import matplotlib.pyplot as plt
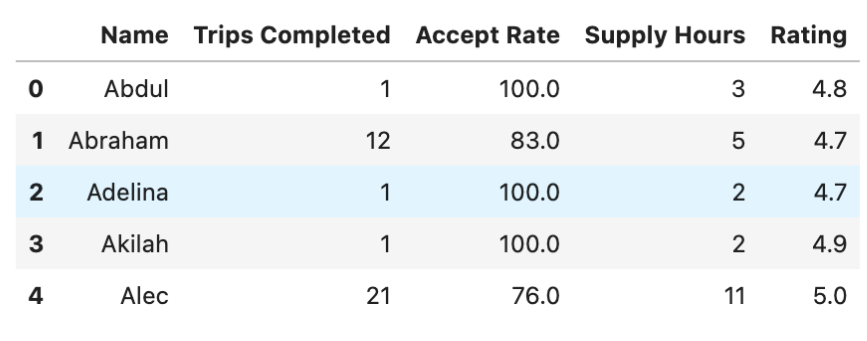
Next, we read the dataset using the read_csv() function from pandas and display the first 10 rows of the dataset using the head() function.
df = pd.read_csv('dataset_2.csv')
df.head(10)

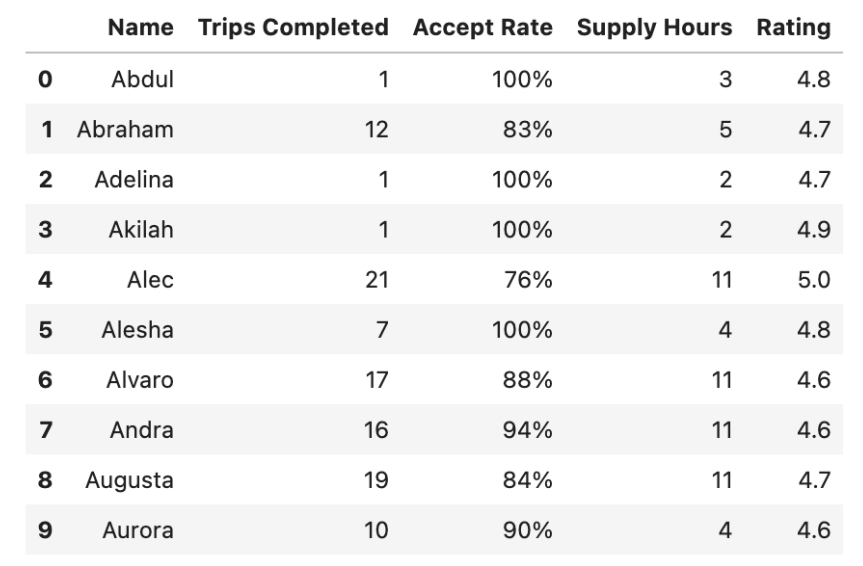
Our DataFrame contains important statistics for various taxi drivers, such as the number of trips completed, acceptance rate, supply hours, and rating.
This data is based on the rides taken on a busy Saturday, and it has been compiled on a per-driver basis. In other words, the dataset gives us a snapshot of the performance of each driver during the specified time frame.
Now, let’s go deeper into our data frame by using the info method.
df.info()
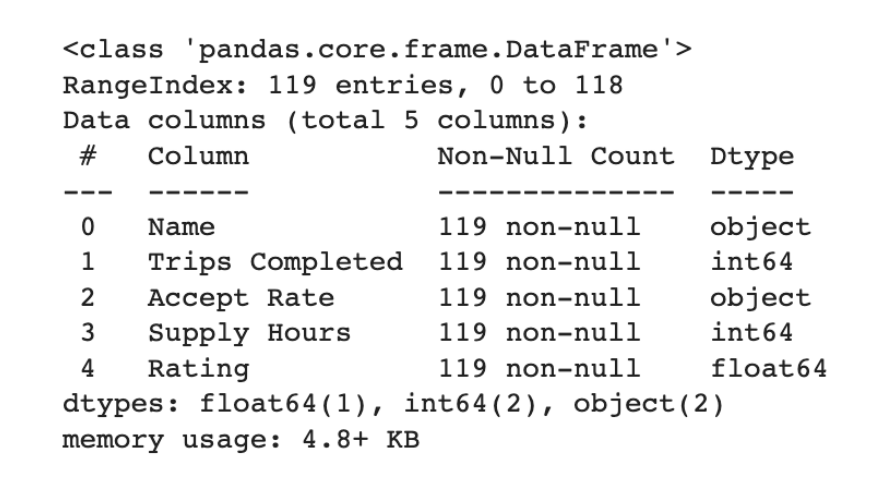
We can see that the dataset includes five columns: Name, Trips Completed, Accept Rate, Supply Hours, and Rating. To check if there are any missing values in the dataset, we run the info() function, which shows us that there are 119 non-null entries in each column of the dataset.
To preprocess the data, we need to remove the % symbol from the Accept Rate column so that we can use its values in integer comparison. We achieve this by using a lambda function with the apply() function.
Then, let’s look at the first rows of our DataFrame again. Here is the code.
# convert accept rate to float from string to force conditions later
df['Accept Rate'] = df['Accept Rate'].apply(lambda x: float(x[:-1]))
df.head()
Here is the output.

Next, we will create a function called plot_counts().
This function takes an axis object and adds labels into the middle of each bar in the chart, with the condition of being greater than 0.
We will use this function several times.
def plot_counts(ax):

    for c in ax.containers:

        # Optional: if the segment is small or 0, customize the labels
        labels = [v.get_height() if v.get_height() > 0 else '' for v in c]

        # remove the labels parameter if it's not needed for customized labels
        ax.bar_label(c, labels=labels, label_type='center', fontsize=8)
    plt.ylabel("Count")
    plt.show()
We will first define the figure size.
plt.rcParams["figure.figsize"] = (12,6)
We start the exploration of the dataset by plotting a bar chart of the Accept Rate column using the groupby() function to group the data by acceptance rate and the count() function to count the number of drivers in each group.
We then call the plot() function and pass in the parameters for the chart's appearance, including the color of the bars.
Here is the code.
ax = df.groupby("Accept Rate")["Name"].count().reset_index().plot(
    kind='bar', stacked=False, x='Accept Rate', color='plum', legend=False)
Finally, we call the plot_counts() function to add labels to each bar in the chart.
plot_counts(ax)
The result is shown below.

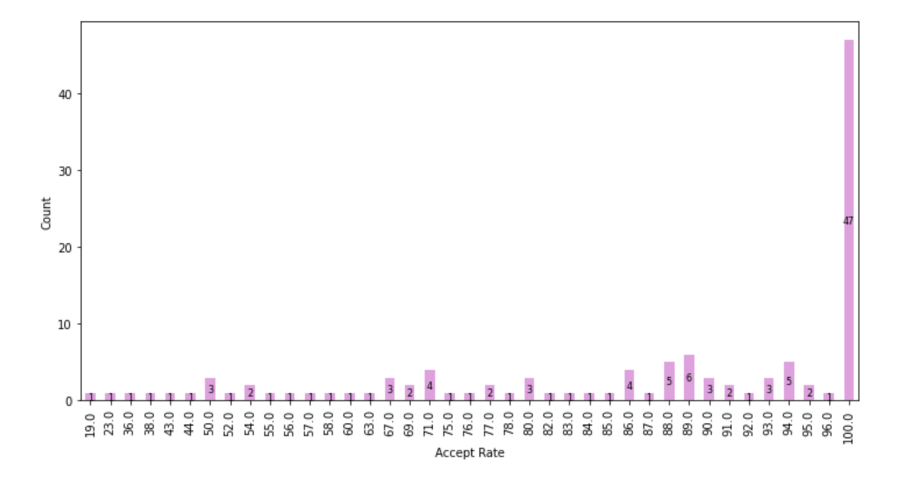
It looks like the majority of drivers have a 100% accept rate.
We will repeat this process for each column in the dataset, generating bar charts of the Rating, Trips Completed, and Supply Hours.
These visualizations allow us to understand better the distribution of statistics for the taxi drivers in the dataset.
The second graph will show ratings.
The general structure of the code is the same. First, we will group our DataFrame by the Rating column and then count the number of drivers using the count() method. Next, we will reset the index and use the plot method to draw the bar chart.
After defining the ax, we will use it as an argument in our custom function.
ax = df.groupby("Rating")["Name"].count().reset_index().plot(
    kind='bar', stacked=False, x='Rating', color='pink',legend=False)
plot_counts(ax)
Here is the output.

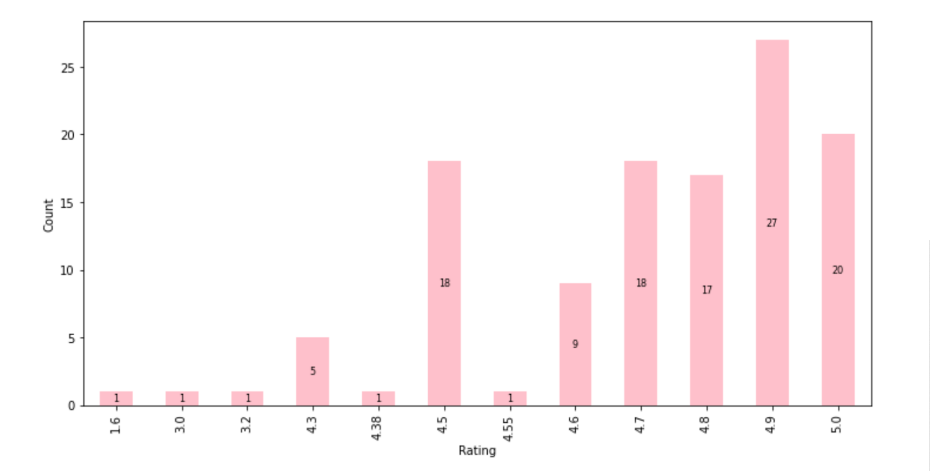
We can tell by looking from the graph that the majority of the driver have ratings higher than 4.5.
Now let’s repeat the process by creating the graph of the Trips Completed column.
ax = df.groupby("Trips Completed")["Name"].count().reset_index().plot(
    kind='bar', stacked=False, x='Trips Completed', color='c', legend=False)
plot_counts(ax)
Here is the output.

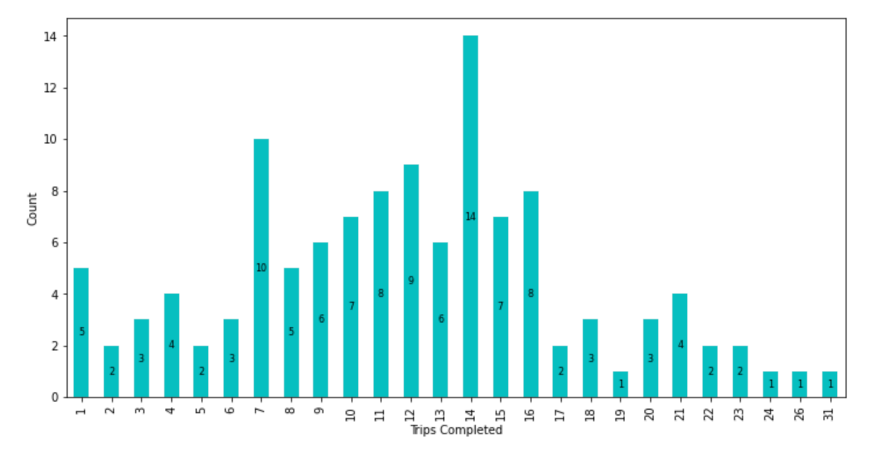
We can see there is a wide range of values starting from 1 to 31.
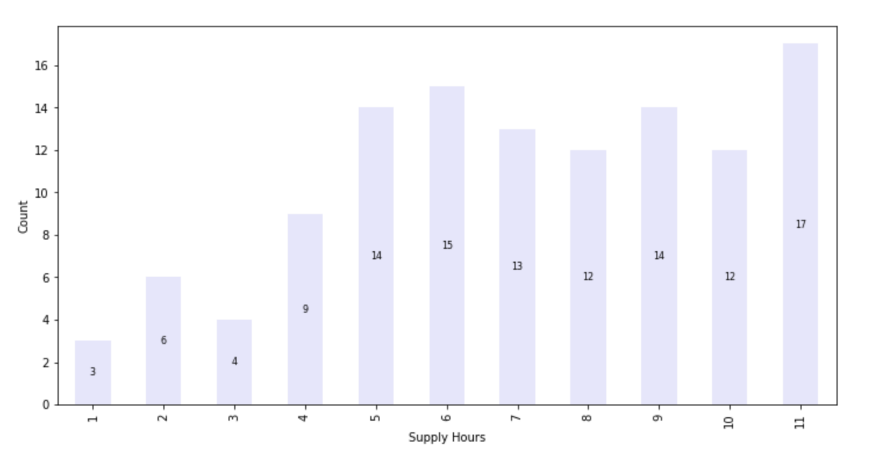
The fourth chart will represent the drivers’ working hours.
ax = df.groupby("Supply Hours")["Name"].count().reset_index().plot(
    kind='bar', stacked=False, x='Supply Hours', color='lavender',legend=False)
plot_counts(ax)
Here is the output.

Data exploration is an essential step in any data project because it allows us to identify patterns, anomalies, and relationships in the data. This is crucial for gaining insights, making informed decisions, and building accurate models.
Skipping this step can lead to incorrect assumptions, biased conclusions, and models that do not generalize well the new data.
We can start answering our questions now that we are familiar with our data and its columns.
Scenario 1
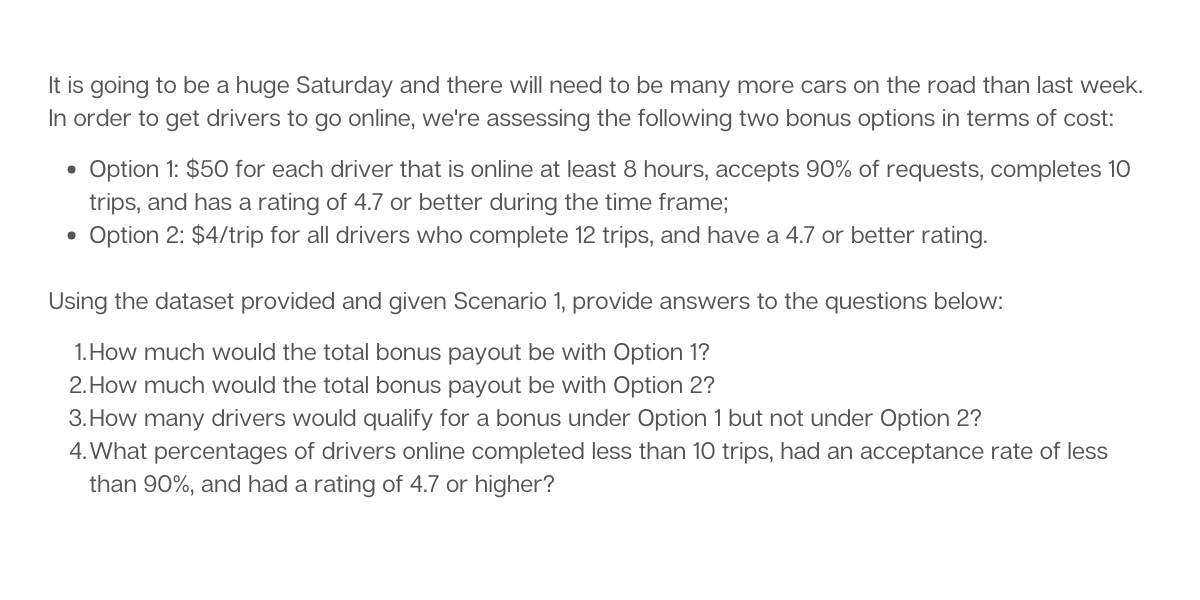
It is going to be a huge Saturday and there will need to be many more cars on the road than last week. In order to get drivers to go online, we're assessing the following two bonus options in terms of cost:
- Option 1: $50 for each driver that is online at least 8 hours, accepts 90% of requests, completes 10 trips, and has a rating of 4.7 or better during the time frame;
- Option 2: $4/trip for all drivers who complete 12 trips, and have a 4.7 or better rating.
Question 1
How much would the total bonus payout be with Option 1?
Coding Approach
To identify drivers who are eligible for the $50 bonus according to the first option, we need to apply the following four conditions:
- Online for 8 hours or more
- Accept rate equal to or higher than 90%
- Should complete 10 or more trips
- Maintain a rating of 4.7 or more
Now, let’s turn this into code. We will define each condition separately and then combine them by using boolean indexing to filter our data frame.
Then we will add the head() method to see the first 5 rows of our data frame.
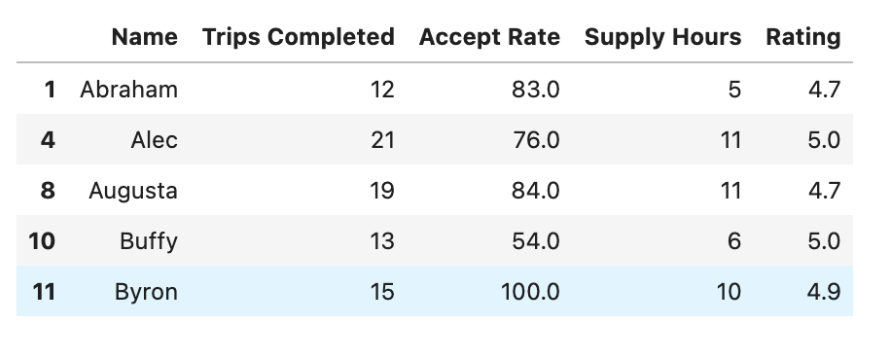
Answer
# filter by given condition
first_option_df = df[(df['Supply Hours'] >= 8) & (df['Trips Completed'] >= 10) &
                     (df['Accept Rate'] >= 90) & (df['Rating'] >= 4.7)]
first_option_df.head()
Here is the output.

To calculate the total cost, we need to multiply the number of eligible drivers in the first_option_df DataFrame by $50 and then print the result.
first_option_total_payout = 50 * len(first_option_df)
print('$'+str(first_option_total_payout))
The total cost would be $1,050.


For the Python One-Liner Fans
We can do the same operation in one line.
First, add a dollar sign to the beginning of the output and filter the df DataFrame based on the conditions that we already mentioned.
Then, determine the number of drivers who meet the conditions using the shape attribute, multiply this number by $50, and return the result as a string using multiple str methods.
str("$") + str(df[(df["Supply Hours"] >= 8) & (df["Accept Rate"] >= 90) & (df["Trips Completed"] >= 10) & (df["Rating"] >= 4.7)].shape[0]*50)Question 2
How much would the total bonus payout be with Option 2?
Coding Approach
The code that we need should filter the DataFrame based on the given conditions:
- Complete more than 12 trips
- Maintain a 4.7 or more rating
Then we will assign the resulting DataFrame to second_option_df, which is displayed using the head() function to show the first few rows.
Again, we will use boolean indexing to filter our DataFrame.
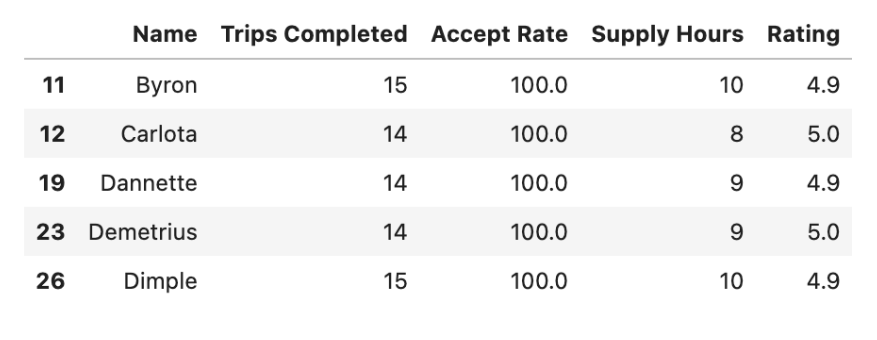
Answer
# filter by given condition
second_option_df = df[(df['Trips Completed'] >= 12) & (df['Rating'] >= 4.7)]
second_option_df.head()
Here is the output.

We need to calculate the total payout for the second option by adding the fare earned by completing 12 or more trips. This is calculated by summing the completed trips and multiplying it by 4, then adding a dollar sign at the beginning of the result by converting the result to a string with the str() function.
second_option_total_payout = 4 * second_option_df['Trips Completed'].sum()
print('$'+str(second_option_total_payout))
The second option would cost $2976.


For the Python One-Liner Fans
The shorter way would be to add a dollar sign at the beginning of our code, then use the boolean indexing.
After that, use the sum() method to calculate the total and then multiply it by 4 to calculate how much the second option would cost.
str("$") + str(df[(df["Trips Completed"] >= 12) & (df["Rating"] >= 4.7)]["Trips Completed"].sum() * 4)Question 3
How many drivers would qualify for a bonus under Option 1 but not under Option 2?
Coding Approach
Our code will merge the two DataFrames used for Option 1 and Option 2 and add an argument to find drivers who qualify for a bonus under Option 1 but not Option 2. It will do that by adding an indicator column to the merged DataFrame.
Answer
# merge all and see if both dataset includes the driver from _merge column
df_all = first_option_df.merge(second_option_df, on=first_option_df.columns.to_list(),
                   how='left', indicator=True)
df_all
Here is the output.

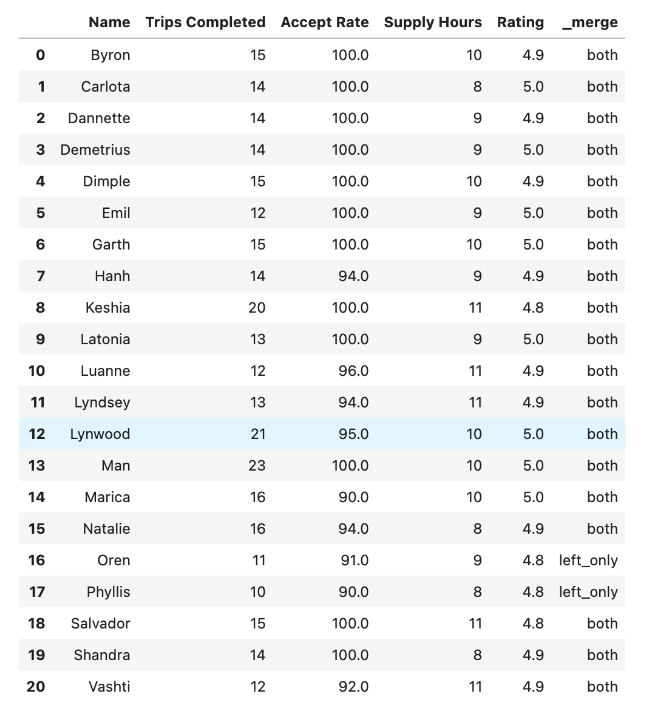
The newly merged DataFrame includes a column named _merge to indicate the origin of the rows.
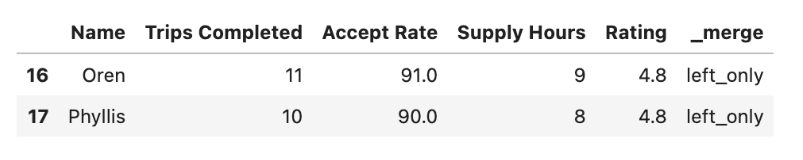
By filtering the rows with the left_only value in the _merge column, we can select the drivers who qualify for a bonus under Option 1 but not under Option 2.
# included by only option 1
df_all[df_all["_merge"] == 'left_only']
Here is the output.

For the Python One-Liner Fans
Here we will use the index.difference method.
This method helps us find the drivers who qualify for a bonus under Option 1 but not under Option 2.
So in the first part, we define Option 1 with boolean indexing. In the second part, we will define Option 2, again with boolean indexing.
Then we use the index.difference method to find the difference between Option 1 and Option 2, which will be an answer to our question.
Here is the code.
len(df[(df["Supply Hours"] >= 8) & (df["Accept Rate"] >= 90) & (df["Trips Completed"] >= 10) & (df["Rating"] >= 4.7)].index.difference(df[(df["Trips Completed"] >= 12) & (df["Rating"] >= 4.7)].index))Question 4
What percentages of drivers online completed less than 10 trips, had an acceptance rate of less than 90%, and had a rating of 4.7 or higher?
Coding Approach
We will filter the dataset based on the following conditions:
- Completed less than 10 trips
- Acceptance rate less than 90%
- Rating is 4.7 or higher
We will then store the resulting rows in the new DataFrame called less_trips_df.
We will solve this question in a similar way to the first, second, and third questions by filtering the dataset using multiple conditions.
Answer
# filter with given condition
less_trips_df = df[(df['Trips Completed'] < 10) & (df['Accept Rate'] < 90) & (df['Rating'] >= 4.7)]
less_trips_df
Here is the output.

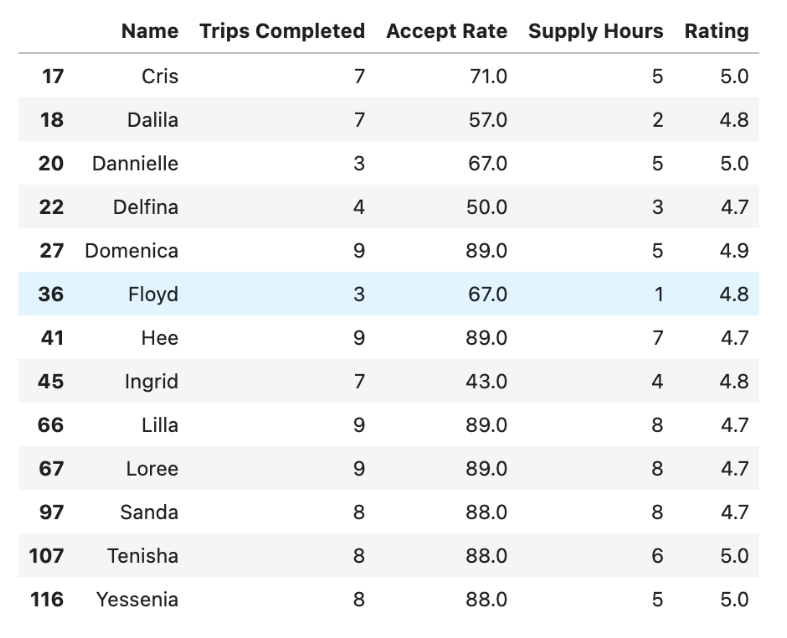
Now we found the drivers, let’s find the percentage by dividing the number of drivers by the length of a DataFrame, then multiplying it by 100. After that, we will turn this result into a string and add “%” at the end of the result.
print(str(len(less_trips_df) / len(df) * 100)+"%")Here is the output.


10.92% of drivers met the criteria.
For the Python One-Liner Fans
This approach filters the conditions, finds the length of the filtered condition, and divides it by the shape of the DataFrame to find the ratio. It then multiplies the ratio by 100 to calculate the percentage and adds the "%" sign at the end of the result.
str((df[(df["Trips Completed"] < 10) & (df["Accept Rate"] < 90) & (df["Rating"] >= 4.7)].shape[0]/ df.shape[0])*100) + str("%")With this, we have completed the first four questions in Scenario 1. Now, it's time to answer the last two questions in Scenario 2. Let's briefly introduce Scenario 2, first.
Scenario 2
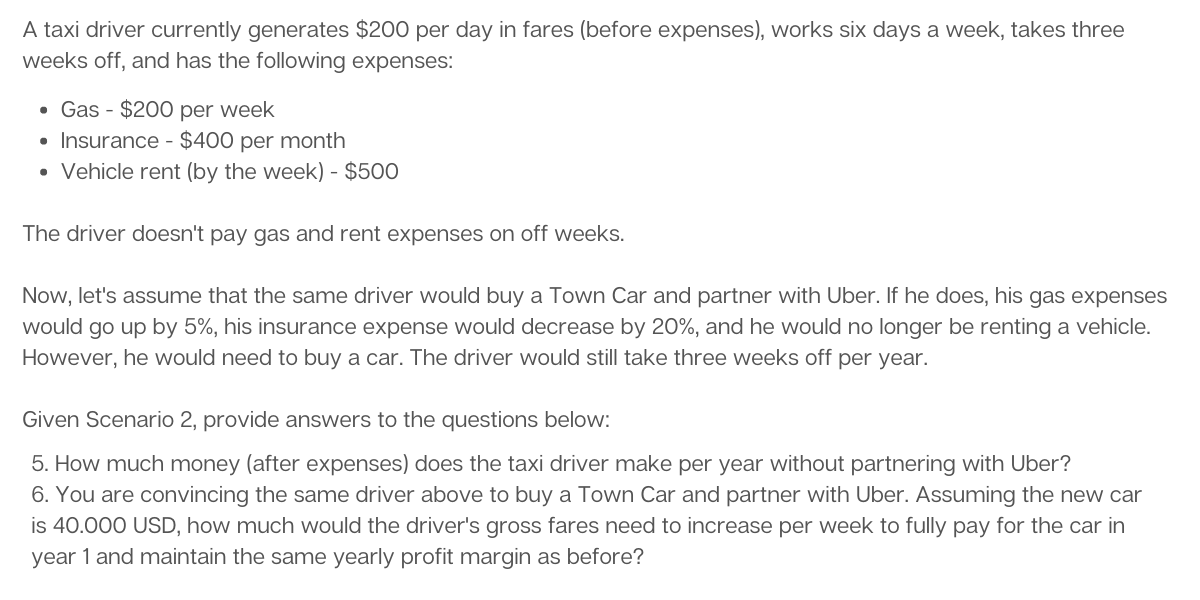
A taxi driver currently generates $200 per day in fares (before expenses), works six days a week, takes three weeks off, and has the following expenses:
- Gas: 200 USD per week
- Insurance: 400 USD per month
- Vehicle rent (by the week): 500 USD
The driver doesn't pay gas and rent expenses on the off weeks.
Question 5
How much money (after expenses) does the taxi driver make per year without partnering with Uber?
Coding Approach
The task is to compute the annual net income of taxi drivers given four conditions, one of which states that they will have three weeks of leave annually.
We will define the variables, including total weeks (52), total_months_per_year (12), weeks_off (3), fare_per_day ($200), and workday_per_week (6), which will be used in the calculations.
We will also define the expenses for each week, including $200 for gas (gas_per_week), $400 for insurance per month (insurance_per_month), and $500 for vehicle rent per week (vehicle_rent_by_week).
Finally, we will compute the net earnings per year using the defined variables and expenses.
Here is the code that we assigned these variables.
Answer
total_weeks_per_year = 52
weeks_off = 3
fare_per_day = 200
workday_per_week = 6
total_months_per_year = 12
# expenses
gas_per_week = 200
insurance_per_month = 400
vehicle_rent_by_week = 500
The calculation will be done in three steps, starting with the total expenses for gas, rent, and insurance. Gas and rent are weekly expenses, while insurance is a monthly expense.
Here is the code.
total_expenses = (gas_per_week + vehicle_rent_by_week) * (total_weeks_per_year - weeks_off) + insurance_per_month * total_months_per_year
print("$"+str(total_expenses))
Here is the output.


Next, we will determine the total revenue by multiplying the fare per day by the number of workdays per week and the number of working weeks per year (52 minus the number of weeks off).
Let’s see the code.
total_revenue = (total_weeks_per_year - weeks_off) * workday_per_week * fare_per_day
print("$"+str(total_revenue))
Here is the output.


The final step involves subtracting the total expenses from the total revenue to obtain the net earnings of the driver.
Let’s see the code.
profit_margin = total_revenue - total_expenses
print("$"+str(profit_margin))
Here is the output.


For the Python One-Liner Fans
In this approach, we will calculate the net earnings per year for a taxi driver by directly performing the calculations for expenses and revenue and then converting the numerical result to a string with a dollar sign.
str("$") + str((49 * (-500 - 200 + 1200)) - (12 * 400))Question 6
You are convincing the same driver above to buy a Town Car and partner with Uber. Assuming the new car is $40,000, how much would the driver's gross fares need to increase per week to fully pay for the car in year 1 and maintain the same yearly profit margin as before?
Coding Approach
We will perform similar calculations, but with some modifications.
Firstly, we will raise the gas price by 5% (multiplying it by 1.05) and decrease the insurance cost by 20% (multiplying the previous insurance cost by 0.8).
In addition, we will add a new expense, the cost of a car, which is $40,000, since we assume that the driver will buy a car instead of renting it.
Now, let's calculate the net earnings with these adjustments.
Here is the code.
Answer
# calculate new expenses
gas_per_week = gas_per_week * 1.05
insurance_per_month = insurance_per_month * 0.8
new_car = 40000

new_total_expenses = new_car + gas_per_week * (total_weeks_per_year - weeks_off) + insurance_per_month * total_months_per_year
new_profit_margin = total_revenue - new_total_expenses
print("$"+str(new_profit_margin))
Here is the output.


Let’s calculate the new profit for our driver.
new_profit_margin = total_revenue - new_total_expenses
print("$"+str(new_profit_margin))

The next step is to calculate the weekly fare increase required to maintain the same yearly profit margin as before after the adjustments made to the expenses.
Here is the code.
# calculate the weekly fare increase
fare_increase = (profit_margin - new_profit_margin) / (total_weeks_per_year - weeks_off)
print("$"+str(round(fare_increase, 2)))
Here is the output.


To be able to purchase a car with increased weekly earnings, the driver needs to raise their fare by 306.73 per week.
For the Python One-Liner Fans
As with the previous question, we will perform the calculations without adding variables and first compute the annual profit margin.
49 * (-500 - 200 + 1200)) - (12 * 400)Next, we'll compute the new profit margin, which will be the profit margin after the driver buys a car.
((49 * 1200) - (200 * 1.05 * 49) - (400 * 0.8 *12) - (40000)))Then, we will calculate the difference and divide it by 49, then round the outcome to 2 decimals.
Lastly, we add a dollar sign at the beginning of the result and convert it into a string.
Below is the code for the Python one-liner fans:
str("$") + str(round(((49 * (-500 - 200 + 1200)) - (12 * 400) - ((49 * 1200) - (200 * 1.05 * 49) - (400 * 0.8 *12) - (40000))) / (49),2))Conclusion
In this article, we explored a data project from Uber and answered six different questions related to driver earnings and expenses.
We went through different coding approaches and explained each step in detail.
Our Python one-liner fans can also find one-liner solutions for each question.
Overall, this article serves as a great example of how data exploration and analysis can be used to answer data project that has been used in the recruitment process for the data science positions at Uber.
We also recommend this post here “Data Analytics Projects” that can boost your portfolio and help you land a data science job.
If you want to learn more about data science, coding, and data projects, be sure to visit our platform, where we provide coding questions, data projects, and blog posts related to data science.
See you there!
Latest Posts:


Share