

Picture yourself as a newly appointed department head, bubbling with ideas and eager to make a lasting impact.
After observing the current state of business operations, you determine your first goal is to increase company efficiency.
But where and how should you start?
Pareto analysis is a simple but effective way to identify key issues in a business and prioritize efforts to fix them. It can work wonders in streamlining processes and optimizing productivity for your team — as long as you use it right.
In this article, we’ll help you understand and use Pareto analysis. We’ll also explain how to create a Pareto chart and apply it in your workplace.
By the end, you’ll have the knowledge and tools you need to leverage Pareto analysis and make significant changes in your business.
Let’s get started!
What is Pareto analysis?
Pareto analysis, also known as the Pareto principle or the 80/20 rule, is a powerful decision-making technique. You can use it to identify and prioritize the main factors influencing a problem or outcome.
Pareto analysis is named after Vilfredo Pareto, who observed that around 80% of effects result from just 20% of causes — hence the “80/20 rule” moniker.
 |
According to the Pareto principle, a small number of contributing factors (roughly 20%) drive most (around 80%) of an observable outcome.
For example, 80% of complaints usually originate from 20% of customers, and 80% of sales might be generated by 20% of clients.
Let’s consider a scenario where you spend six hours working on a project. By applying a Pareto analysis, you realize that only a small part — around 20% — of your efforts contributed to 80% of the project’s progress. It was the hour and 15 minutes you spent on marketing research that led to 80% of your success.
With this insight, you focus your resources and time on comprehensive market research to drive the best project outcomes.
What are the benefits of Pareto analysis?
Quick question: when it comes to making difficult decisions, like choosing between two competing strategies, what do you usually rely on?
A QlikTech survey shows that 45% of leaders often make decisions based on gut feelings rather than data-led insights. However, relying solely on gut feelings is risky. It often leads to biased or subjective choices that don’t result in desirable outcomes.
With Pareto analysis, you have a tool that pinpoints critical factors. You can then use that data to make the right decisions for your business.
These Pareto insights can lead to a wealth of benefits, including the following:
Effective problem-solving
When you have a problem with no clear solution, you can use a Pareto analysis to identify the primary factors impacting the situation.
Instead of wasting your efforts on pointless fixes, you can concentrate your energy on what will have the greatest impact on your end-goal.
Data-driven decision-making
A Quantexa report revealed that two in five leaders don’t believe their organization is using the full potential of its data.
Since a Pareto analysis uses quantitative data, it provides a solid foundation for informed decision-making. The data gathered from your analysis either backs up your instincts or helps you make objective judgments.
 |
You can be more confident in your decision-making as a result since your choices are backed by data instead of intuition.
Efficient resource allocation
Resource allocation can make a big difference in project management. In fact, a recent report found that poor resource management ranked as the third-largest project management challenge that companies face.
The Pareto principle helps businesses allocate resources, like time and staffing, more strategically.
As a result, you can more efficiently address the root causes of resource allocation difficulties and optimize your resources to achieve better outcomes.
Continuous improvement
Pareto analysis promotes continuous improvement by encouraging businesses to improve their processes.
It cultivates a mindset of growth and innovation that empowers your team to continuously learn, adapt, and evolve. This focus leads to sustainable growth and helps your company stay ahead in a competitive business landscape.
The Pareto principle in action
The Pareto principle isn’t just a concept confined to textbooks. It has real-world implications.
Take Microsoft, for example.
In 2002, Microsoft made the startling discovery that 80% of the errors and crashes plaguing Windows and Office were caused by only 20% of the total number of bugs.
Armed with new insights, Microsoft dedicated its resources to tackling that critical 20% head-on. The result? Dramatic improvements in performance and reliability across their software products.
This example shows the tremendous impact a Pareto analysis can have on a business. Paying attention to key areas means businesses can channel their efforts and achieve remarkable outcomes.
8 steps to build a Pareto chart
Now that you understand how the Pareto principle works, let’s discuss how you can put it to use in your business.
To conduct a Pareto analysis, you need to build a Pareto chart. Here’s how to do it:
1. Identify the problem
To begin, you need to clearly state the problem or goal you want to analyze. It could be a specific issue or challenge that your business is facing, like a high customer churn rate, low sales conversion, or production defects.
The key is to define the problem in a clear and concise manner. This will help ensure the Pareto analysis is effective.
2. Gather and group data
Once you’ve identified the problem, the next step is to gather and organize relevant data on the issue.
This involves getting information from customers, production reports, and sales data, then categorizing it based on the factors or variables that are contributing to the problem.
3. Calculate the frequency and percentage
Next, calculate the frequency and percentage of each category. To do this, you can simply tally up how many times an issue caused by each factor occurs and calculate its corresponding percentage.
 |
This step helps you gauge the significance of each category and identify the contributors that have the biggest impact on the problem or goal you’re analyzing.
4. Rank the categories
Now, sort the categories based on their frequency — from highest to lowest. You should be able to visually identify the categories that need your attention the most.
In this step, you find the root causes of your problem.
5. Calculate the cumulative percentage
The next step is to calculate the cumulative percentage by adding up the percentages as you move from the highest-ranked category to the lowest.
 |
This will help you determine the cumulative impact of each category so you can further prioritize your efforts.
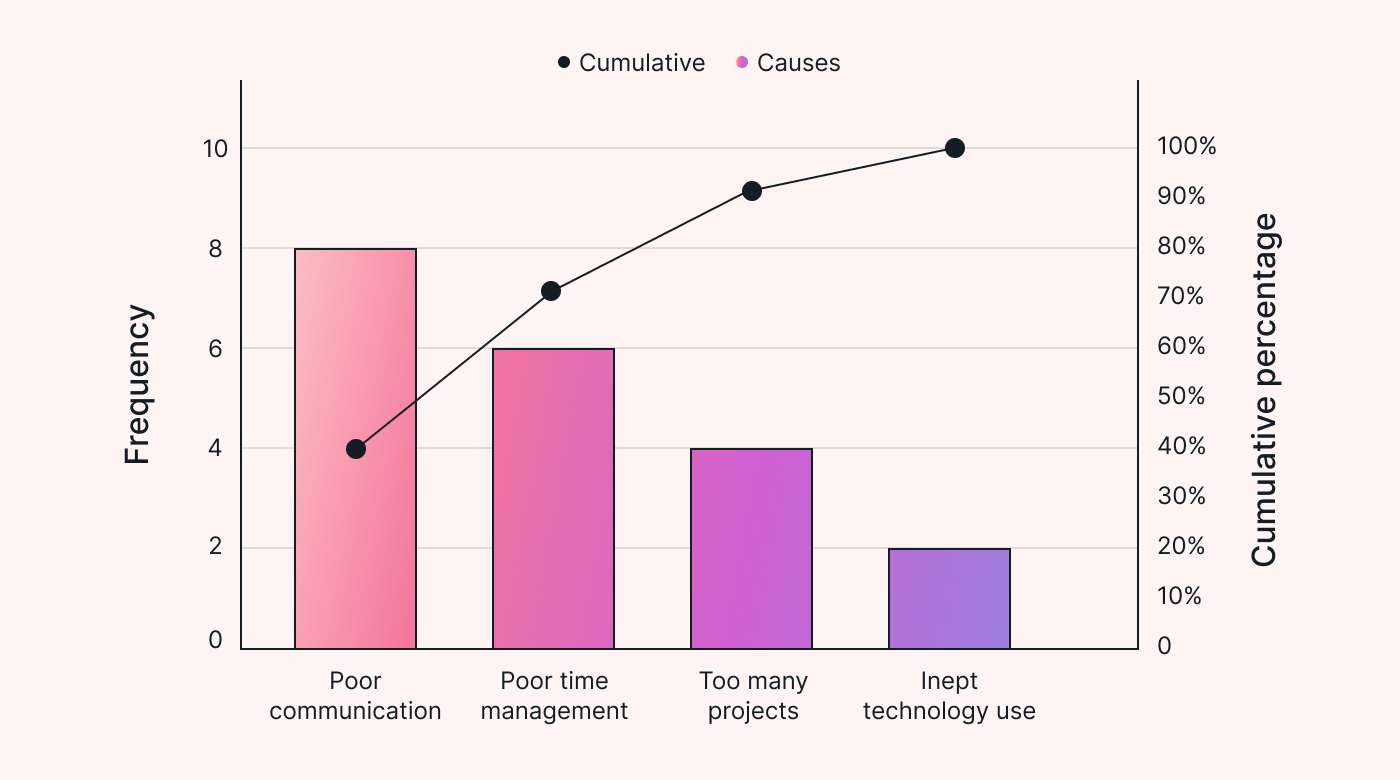
6. Create the Pareto chart
After you’ve done all the hard work, you can plot your Pareto bar chart. Your bar chart should show your categories on the x-axis and their respective frequencies on the y-axis.
 |
The Pareto chart will provide a clear visual representation of the critical factors that need your attention so you can focus your efforts on the areas that are the most impactful.
7. Add a cumulative percentage line
Don’t forget to include a line on the chart that represents the cumulative percentage. This line is essential, as it’ll show you how each category contributes cumulatively to the overall total.
 |
A steeper incline suggests that a category has a more significant impact on the overall problem or goal. The point where the cumulative line starts to level off is the inflection point, and it signifies diminishing returns. Categories beyond this point contribute less to the overall impact and aren’t as important.
8. Analyze the chart and take action
The last step is chart analysis. Focus on the highest-scoring categories and take action to address them. They will have the biggest impact, so putting your energy with these heavy-hitters will help you get results, whether you’re trying to solve a problem or achieve a goal.
3 workplace scenarios where a Pareto analysis can help
Pareto analysis can be applied to various workplace scenarios to drive change and improvement.
Here are three scenarios in which a Pareto analysis can be implemented to inspire positive change and bring about tangible results:
Scenario 1: A design agency
One of the common challenges design agencies face is meeting project deadlines. According to Wellingtone’s The State of Project Management 2021 report, only 34% of projects are delivered on time and within budget. These numbers highlight the industry-wide struggle.
Imagine a design agency grappling with project delays. Their clients are unhappy, so they have difficulty keeping them.
The agency turns to Pareto analysis to determine which design projects are causing the most delays. The factors involved include specific design stages, client revisions, and resource allocation.
The agency discovers a handful of key factors responsible for the majority of the delays. They improve their client communication, design approval process, and resource allocation.
After revamping its project management processes, the design agency boosts its workflow efficiency and exceeds its clients’ expectations.
Moreover, the agency decides to use a task scheduler to help them manage their time effectively and stay accountable. By using technology to automatically assign team members and deadlines to each task, it’s easier for everyone to see when each task needs to be finished.

The agency also uses a progress tracker to track the progress of each task. As a result, the design team is aligned on the project’s progress, and team members can easily see the results of the implemented changes. This promotes transparency and collaboration within the agency, fostering a sense of shared responsibility and accountability.
Scenario 2: A construction company
A construction business is facing recurring quality control issues in its projects. The project manager finds themselves constantly dealing with project rework requests and customer complaints. They brainstorm for weeks but struggle to find an effective solution.
In this situation, a Pareto analysis helps the project manager identify the different quality issues that might be slowing down the company’s construction projects.
The project manager then assesses the frequency of each quality issue and realizes that the main problems are inconsistent employee training, poor communication, and low-quality vendors.
The project manager makes a data-driven decision to rebuild employee training programs and improve supplier selection. They also decide to use Motion’s AI-powered project manager, which automatically prioritizes tasks to make sure the most critical tasks get the necessary attention.
Motion also improves communication and collaboration among the team. Team members can now communicate directly through comments and notifications in a centralized location.

These proactive measures help the business reduce its rework costs and improve its project quality, teamwork, and customer satisfaction.
Scenario 3: A real estate office
Now picture a long-established real estate office struggling to convert leads into actual property sales. The team leader is stressed about their team’s low conversion rates and missed revenue opportunities.
To put an end to the sales drought, the team leader categorizes all lead sources and channels, including online listings, referrals, direct mail, and social media ads.
Then, they use a Pareto analysis to determine which channels to invest in for the highest ROI. After identifying which channels have the biggest impact, they decide to optimize online listings, nurture referral relationships, and enhance the business’s social media advertising campaigns.
However, with so many new initiatives in place, it becomes difficult to manage everything. To solve this problem, the team lead implements a marketing calendar, like Motion’s Intelligent Calendar, to plan lead follow-ups, content creation, and advertising campaigns.

By allocating marketing resources to these channels, the team leader improves conversion rates, sells more properties, and revives the business.
Motion makes the Pareto principle sustainable for your business
Think of Motion as your supportive best friend on your business transformation journey.
We give you the tools you need to sustain the Pareto principle and keep you accountable when implementing new changes.
Our features, which include a task scheduler, progress tracker, and intelligent calendar, simplify the process of integrating and maintaining the Pareto principle in your operations.
Combining the power of Motion with the Pareto principle will give you the support you need to drive meaningful change, optimize productivity, and achieve long-term success.
Let Motion be your catalyst for sustainable growth and transformation. Try it for free today!