Politics
Mapped: The Age of U.S. Senators, by State
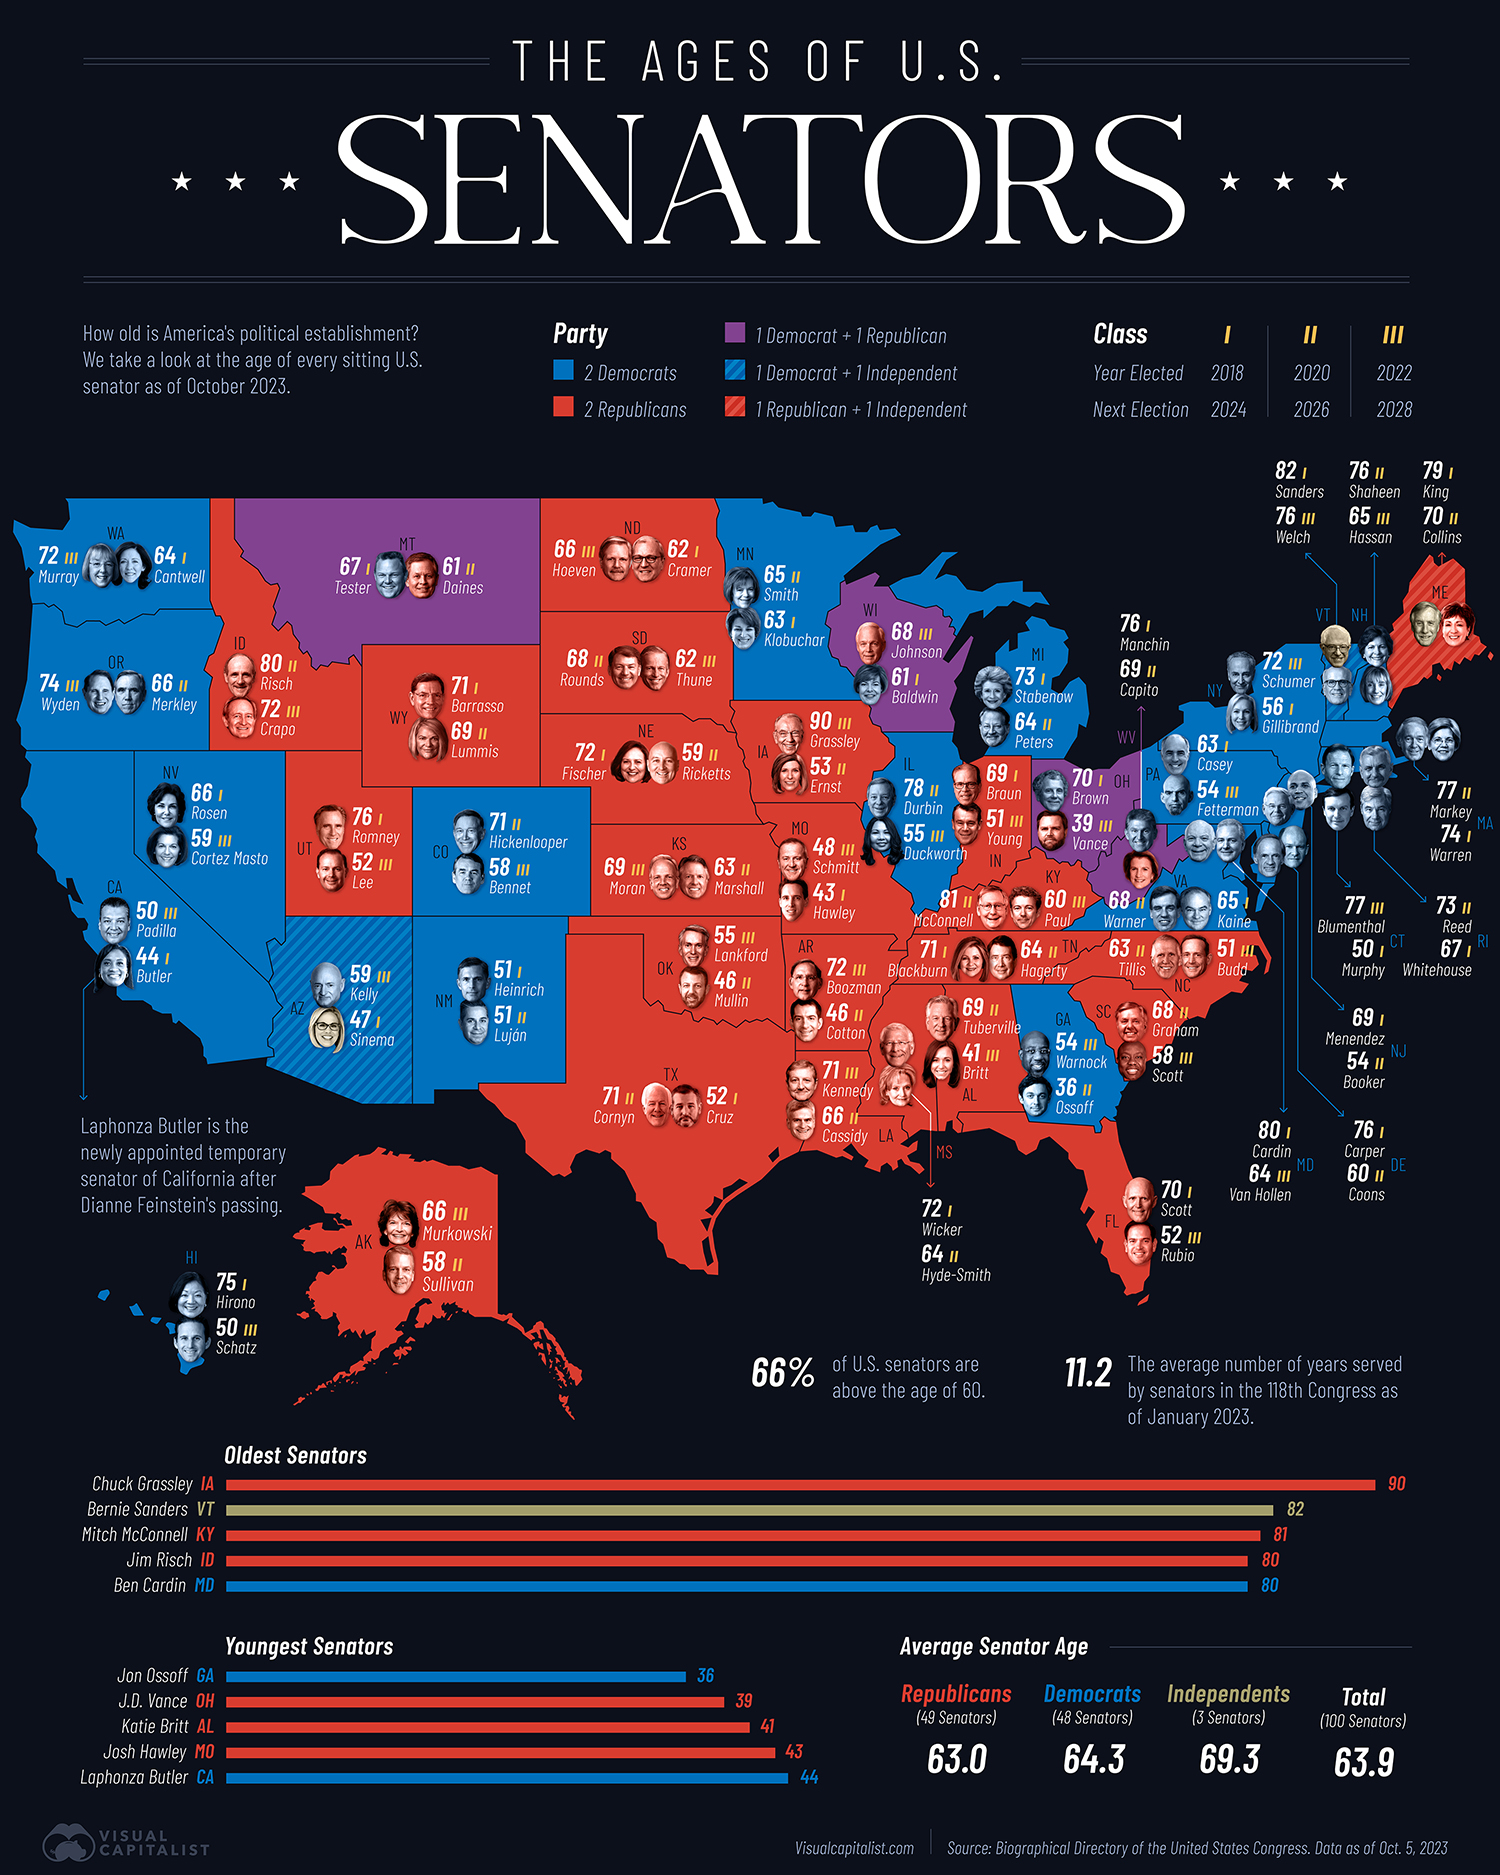
Mapped: The Age of U.S. Senators, by State
The passing of California Senator Dianne Feinstein at the age of 90 is throwing a spotlight on America’s political establishment, not only with the government narrowly escaping shutdown, but on questions of ageism, representation, and fitness for office.
Feinstein had a noteworthy career. As the longest-running woman in the Senate’s history, she served the nation’s most populous state.
Yet Feinstein’s growing health complications along with two incidents of Senate Minority Leader Mitch McConnell freezing while speaking this year highlight the growing trend of America’s aging leadership.
The above graphic shows the age of U.S. senators, by state as of October 5, 2023.
How the Age of U.S. Senators Breaks Down
Today, 66% of senators are over the age of 60.
While senators have historically been older than the American population, consider how the median age in the U.S. is 39 according to the 2020 U.S. Census, and the median age of the Senate prior to Feinstein’s passing was 65.
We can see in the below table how the Senate has become growingly older, influenced by longer lifespans and the increased likelihood of members running for re-election (and winning). In addition, members in the Baby Boomer generation, ages 58 to 77 years old, often have more resources and wealth to help secure their seat.
| Name | Senator Age | State | Party |
|---|---|---|---|
| Grassley, Chuck | 90 | Iowa | Republican |
| Sanders, Bernard | 82 | Vermont | Independent |
| McConnell, Mitch | 81 | Kentucky | Republican |
| Risch, James E. | 80 | Idaho | Republican |
| Cardin, Benjamin L. | 80 | Maryland | Democratic |
| King, Angus S., Jr. | 79 | Maine | Independent |
| Durbin, Richard J. | 78 | Illinois | Democratic |
| Blumenthal, Richard | 77 | Connecticut | Democratic |
| Markey, Edward J. | 77 | Massachusetts | Democratic |
| Carper, Thomas R. | 76 | Delaware | Democratic |
| Shaheen, Jeanne | 76 | New Hampshire | Democratic |
| Welch, Peter | 76 | Vermont | Democratic |
| Manchin, Joe, III | 76 | West Virginia | Democratic |
| Romney, Mitt | 76 | Utah | Republican |
| Hirono, Mazie K. | 75 | Hawaii | Democratic |
| Warren, Elizabeth | 74 | Massachusetts | Democratic |
| Wyden, Ron | 74 | Oregon | Democratic |
| Stabenow, Debbie | 73 | Michigan | Democratic |
| Reed, Jack | 73 | Rhode Island | Democratic |
| Schumer, Charles E. | 72 | New York | Democratic |
| Murray, Patty | 72 | Washington | Democratic |
| Boozman, John | 72 | Arkansas | Republican |
| Crapo, Mike | 72 | Idaho | Republican |
| Wicker, Roger F. | 72 | Mississippi | Republican |
| Fischer, Deb | 72 | Nebraska | Republican |
| Hickenlooper, John W. | 71 | Colorado | Democratic |
| Kennedy, John | 71 | Louisiana | Republican |
| Blackburn, Marsha | 71 | Tennessee | Republican |
| Cornyn, John | 71 | Texas | Republican |
| Barrasso, John | 71 | Wyoming | Republican |
| Brown, Sherrod | 70 | Ohio | Democratic |
| Scott, Rick | 70 | Florida | Republican |
| Collins, Susan M. | 70 | Maine | Republican |
| Menendez, Robert | 69 | New Jersey | Democratic |
| Tuberville, Tommy | 69 | Alabama | Republican |
| Braun, Mike | 69 | Indiana | Republican |
| Moran, Jerry | 69 | Kansas | Republican |
| Capito, Shelley Moore | 69 | West Virginia | Republican |
| Lummis, Cynthia M. | 69 | Wyoming | Republican |
| Warner, Mark R. | 68 | Virginia | Democratic |
| Graham, Lindsey | 68 | South Carolina | Republican |
| Rounds, Mike | 68 | South Dakota | Republican |
| Johnson, Ron | 68 | Wisconsin | Republican |
| Tester, Jon | 67 | Montana | Democratic |
| Whitehouse, Sheldon | 67 | Rhode Island | Democratic |
| Rosen, Jacky | 66 | Nevada | Democratic |
| Merkley, Jeff | 66 | Oregon | Democratic |
| Murkowski, Lisa | 66 | Alaska | Republican |
| Hoeven, John | 66 | North Dakota | Republican |
| Cassidy, Bill | 66 | Louisiana | Republican |
| Smith, Tina | 65 | Minnesota | Democratic |
| Hassan, Margaret Wood | 65 | New Hampshire | Democratic |
| Kaine, Tim | 65 | Virginia | Democratic |
| Van Hollen, Chris | 64 | Maryland | Democratic |
| Peters, Gary C. | 64 | Michigan | Democratic |
| Cantwell, Maria | 64 | Washington | Democratic |
| Hyde-Smith, Cindy | 64 | Mississippi | Republican |
| Hagerty, Bill | 64 | Tennessee | Republican |
| Klobuchar, Amy | 63 | Minnesota | Democratic |
| Casey, Robert P., Jr. | 63 | Pennsylvania | Democratic |
| Marshall, Roger | 63 | Kansas | Republican |
| Tillis, Thom | 63 | North Carolina | Republican |
| Cramer, Kevin | 62 | North Dakota | Republican |
| Thune, John | 62 | South Dakota | Republican |
| Baldwin, Tammy | 61 | Wisconsin | Democratic |
| Daines, Steve | 61 | Montana | Republican |
| Coons, Christopher A. | 60 | Delaware | Democratic |
| Paul, Rand | 60 | Kentucky | Republican |
| Kelly, Mark | 59 | Arizona | Democratic |
| Cortez Masto, Catherine | 59 | Nevada | Democratic |
| Ricketts, Pete | 59 | Nebraska | Republican |
| Bennet, Michael F. | 58 | Colorado | Democratic |
| Sullivan, Dan | 58 | Alaska | Republican |
| Scott, Tim | 58 | South Carolina | Republican |
| Gillibrand, Kirsten E. | 56 | New York | Democratic |
| Duckworth, Tammy | 55 | Illinois | Democratic |
| Lankford, James | 55 | Oklahoma | Republican |
| Warnock, Raphael G. | 54 | Georgia | Democratic |
| Booker, Cory A. | 54 | New Jersey | Democratic |
| Fetterman, John | 54 | Pennsylvania | Democratic |
| Ernst, Joni | 53 | Iowa | Republican |
| Rubio, Marco | 52 | Florida | Republican |
| Cruz, Ted | 52 | Texas | Republican |
| Lee, Mike | 52 | Utah | Republican |
| Heinrich, Martin | 51 | New Mexico | Democratic |
| Luján, Ben Ray | 51 | New Mexico | Democratic |
| Young, Todd | 51 | Indiana | Republican |
| Budd, Ted | 51 | North Carolina | Republican |
| Padilla, Alex | 50 | California | Democratic |
| Murphy, Christopher | 50 | Connecticut | Democratic |
| Schatz, Brian | 50 | Hawaii | Democratic |
| Schmitt, Eric | 48 | Missouri | Republican |
| Sinema, Kyrsten | 47 | Arizona | Independent |
| Cotton, Tom | 46 | Arkansas | Republican |
| Mullin, Markwayne | 46 | Oklahoma | Republican |
| Laphonza Butler | 44 | California | Democratic |
| Hawley, Josh | 43 | Missouri | Republican |
| Britt, Katie Boyd | 41 | Alabama | Republican |
| Vance, J.D. | 39 | Ohio | Republican |
| Ossoff, Jon | 36 | Georgia | Democratic |
On the other end of the spectrum are nine senators under the age of 50, including Democrat Jon Ossoff of Georgia, at 36, and Republican senator J.D. Vance of Ohio, at 39. Laphonza Butler, 44, the newly appointed senator to replace Feinstein, also falls within this camp.
This trend of an older Senate may have policy ramifications.
Studies show that lawmakers’ identities can influence legislative behavior. Older members of Congress have been shown to have a higher likelihood of introducing legislation on prescription drugs and long-term care, and other issues affecting seniors.
Other studies show that racial minorities, women, and veterans are more likely to intervene in Congress in the interest of these groups.
Top U.S. Senators, by Time in Office
Along with the trend of an older Congress, the average number of years served has also increased.
Today, senators in the 118th Congress have served 11.2 years on average as of January 2023. Over the 20th century, turnover has decreased due to more senators seeking re-election, which stands in contrast to the Senate’s early history when turnover happened more frequently.
Below, we show the currently serving senators that have held office the longest, based on their time in both the Senate and the House:
| Name | State | Party | Number of Years in Office |
|---|---|---|---|
| Grassley, Chuck | Iowa | Republican | 48 years |
| Markey, Ed | Massachusetts | Democrat | 46 years |
| Wyden, Ron | Oregon | Democrat | 42 years |
| Schumer, Charles E. | New York | Democrat | 42 years |
| McConnell, Mitch | Kentucky | Republican | 38 years |
Together, the top five U.S. senators have served a combined 216 years in office.
Economy
The Bloc Effect: International Trade with Geopolitical Allies on the Rise
Rising geopolitical tensions are shaping the future of international trade, but what is the effect on trading among G7 and BRICS countries?


The Bloc Effect: International Trade with Allies on the Rise
International trade has become increasingly fragmented over the last five years as countries have shifted to trading more with their geopolitical allies.
This graphic from The Hinrich Foundation, the first in a three-part series covering the future of trade, provides visual context to the growing divide in trade in G7 and pre-expansion BRICS countries, which are used as proxies for geopolitical blocs.
Trade Shifts in G7 and BRICS Countries
This analysis uses IMF data to examine differences in shares of exports within and between trading blocs from 2018 to 2023. For example, we looked at the percentage of China’s exports with other BRICS members as well as with G7 members to see how these proportions shifted in percentage points (pp) over time.
Countries traded nearly $270 billion more with allies in 2023 compared to 2018. This shift came at the expense of trade with rival blocs, which saw a decline of $314 billion.
Country Change in Exports Within Bloc (pp) Change in Exports With Other Bloc (pp)
🇮🇳 India 0.0 3.9
🇷🇺 Russia 0.7 -3.8
🇮🇹 Italy 0.8 -0.7
🇨🇦 Canada 0.9 -0.7
🇫🇷 France 1.0 -1.1
🇪🇺 EU 1.1 -1.5
🇩🇪 Germany 1.4 -2.1
🇿🇦 South Africa 1.5 1.5
🇺🇸 U.S. 1.6 -0.4
🇯🇵 Japan 2.0 -1.7
🇨🇳 China 2.1 -5.2
🇧🇷 Brazil 3.7 -3.3
🇬🇧 UK 10.2 0.5
All shifts reported are in percentage points. For example, the EU saw its share of exports to G7 countries rise from 74.3% in 2018 to 75.4% in 2023, which equates to a 1.1 percentage point increase.
The UK saw the largest uptick in trading with other countries within the G7 (+10.2 percentage points), namely the EU, as the post-Brexit trade slump to the region recovered.
Meanwhile, the U.S.-China trade dispute caused China’s share of exports to the G7 to fall by 5.2 percentage points from 2018 to 2023, the largest decline in our sample set. In fact, partly as a result of the conflict, the U.S. has by far the highest number of harmful tariffs in place.
The Russia-Ukraine War and ensuing sanctions by the West contributed to Russia’s share of exports to the G7 falling by 3.8 percentage points over the same timeframe.
India, South Africa, and the UK bucked the trend and continued to witness advances in exports with the opposing bloc.
Average Trade Shifts of G7 and BRICS Blocs
Though results varied significantly on a country-by-country basis, the broader trend towards favoring geopolitical allies in international trade is clear.
Bloc Change in Exports Within Bloc (pp) Change in Exports With Other Bloc (pp)
Average 2.1 -1.1
BRICS 1.6 -1.4
G7 incl. EU 2.4 -1.0
Overall, BRICS countries saw a larger shift away from exports with the other bloc, while for G7 countries the shift within their own bloc was more pronounced. This implies that though BRICS countries are trading less with the G7, they are relying more on trade partners outside their bloc to make up for the lost G7 share.
A Global Shift in International Trade and Geopolitical Proximity
The movement towards strengthening trade relations based on geopolitical proximity is a global trend.
The United Nations categorizes countries along a scale of geopolitical proximity based on UN voting records.
According to the organization’s analysis, international trade between geopolitically close countries rose from the first quarter of 2022 (when Russia first invaded Ukraine) to the third quarter of 2023 by over 6%. Conversely, trade with geopolitically distant countries declined.
The second piece in this series will explore China’s gradual move away from using the U.S. dollar in trade settlements.
Visit the Hinrich Foundation to learn more about the future of geopolitical trade

-

 Economy2 days ago
Economic Growth Forecasts for G7 and BRICS Countries in 2024
The IMF has released its economic growth forecasts for 2024. How do the G7 and BRICS countries compare?
-

 United States2 weeks ago
Ranked: The Largest U.S. Corporations by Number of Employees
We visualized the top U.S. companies by employees, revealing the massive scale of retailers like Walmart, Target, and Home Depot.
-

 Economy2 weeks ago
Where U.S. Inflation Hit the Hardest in March 2024
We visualized product categories that saw the highest % increase in price due to U.S. inflation as of March 2024.
-

 Economy1 month ago
G20 Inflation Rates: Feb 2024 vs COVID Peak
We visualize inflation rates across G20 countries as of Feb 2024, in the context of their COVID-19 pandemic peak.
-

 Economy1 month ago
Mapped: Unemployment Claims by State
This visual heatmap of unemployment claims by state highlights New York, California, and Alaska leading the country by a wide margin.
-

 Economy2 months ago
Confidence in the Global Economy, by Country
Will the global economy be stronger in 2024 than in 2023?

-

 Misc1 week ago
How Hard Is It to Get Into an Ivy League School?
-

 Technology2 weeks ago
Ranked: Semiconductor Companies by Industry Revenue Share
-

 Markets2 weeks ago
Ranked: The World’s Top Flight Routes, by Revenue
-

 Countries2 weeks ago
Population Projections: The World’s 6 Largest Countries in 2075
-

 Markets2 weeks ago
The Top 10 States by Real GDP Growth in 2023
-

 Demographics2 weeks ago
The Smallest Gender Wage Gaps in OECD Countries
-
Economy2 weeks ago
Where U.S. Inflation Hit the Hardest in March 2024
-

 Green2 weeks ago
Top Countries By Forest Growth Since 2001