September 8th
 February 22nd
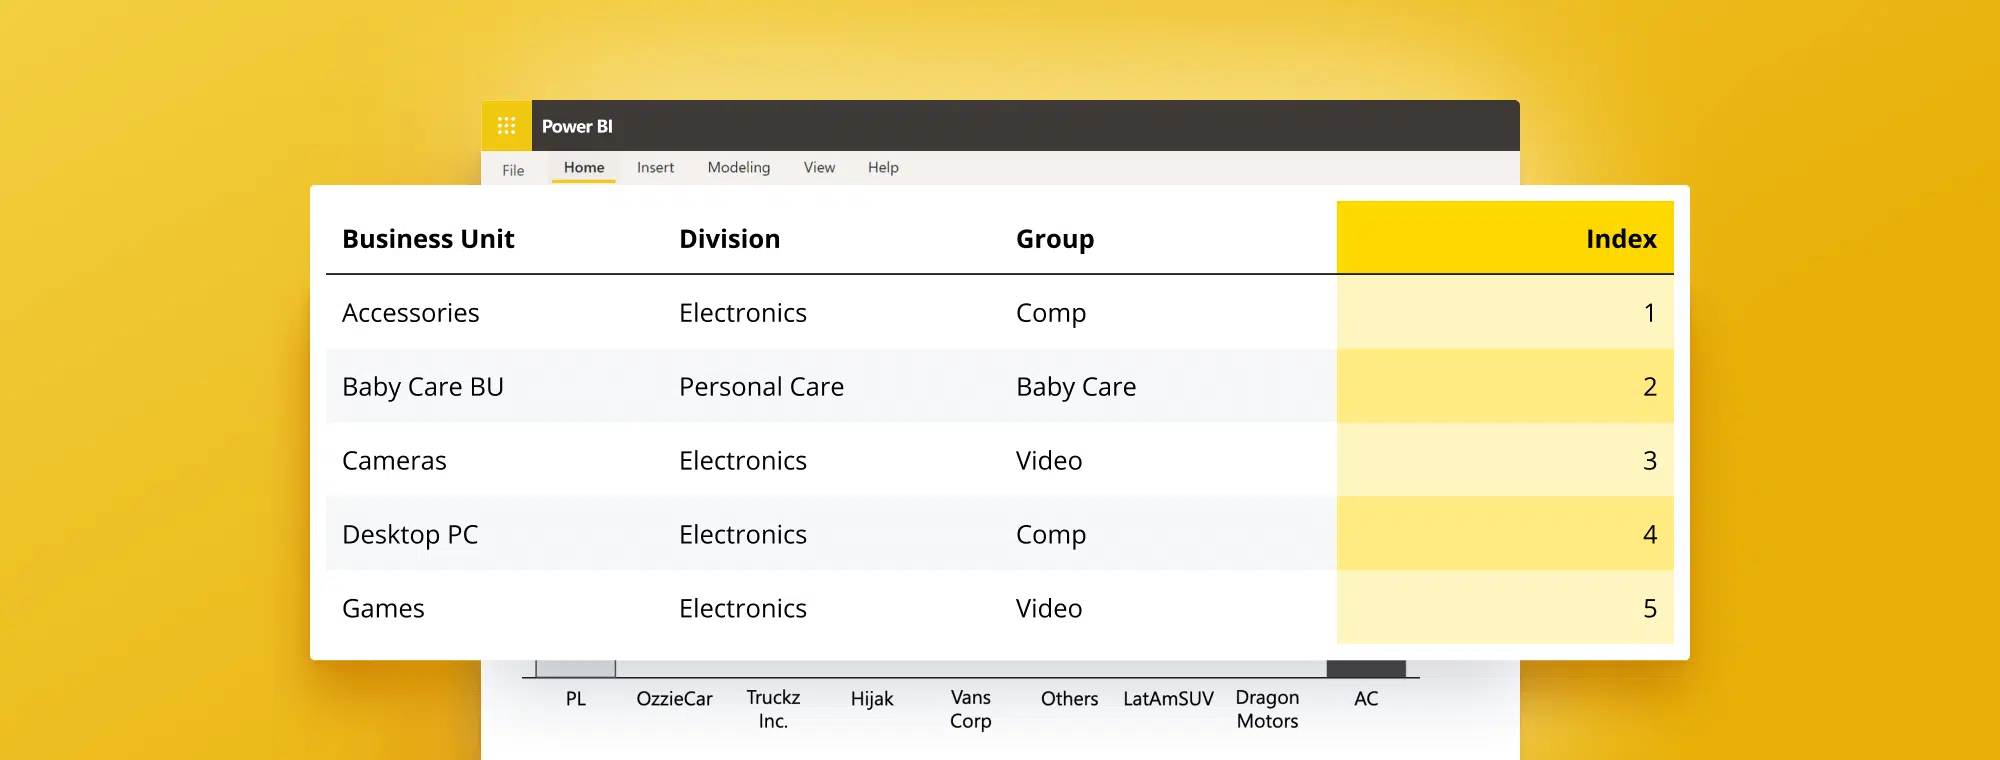
How to Add Index Column in Power BI (DAX)
If you're using Power BI for data analysis or reporting, you might encounter scenarios requiring an index column. An index column is a sequenced column of numbers used for various purposes, such as sorting, filtering, and creating hierarchies. In this article, we'll discuss everything you need to know about the index column in Power BI, including its benefits, limitations, and real-world applications. We'll also provide a step-by-step guide on creating and customizing an index column to suit your needs.
What is an Index Column in Power BI?
An index column in Power BI DAX is a calculated column that generates an ordered sequence of integers, starting from 1. The index column acts as a unique identifier for each row in the dataset and helps perform different operations like sorting and filtering. The index column can be added to any data model table and calculated based on the row context.
One of the main benefits of using an index column in Power BI DAX is that it allows for easier tracking of changes over time. Including an index, column lets you quickly identify which rows have been added, removed, or modified in your dataset. This can be particularly useful when working with large datasets or when collaborating with other team members on a project. The index column can also be used with other Dax functions to perform more complex calculations and analyses.
Get Actionable Insights from your data in Power BI
Create jaw-dropping reports and dashboards with powerful visualization tools to deliver real insights from your data in record time.
Benefits of Adding an Index Column in Power BI
There are various benefits of adding an index column in Power BI. Some of these benefits include:
- Sorting: An index column can be used to sort data in ascending or descending order, making it easier to analyze.
- Filtering: An index column can filter data based on a range of values, making it helpful in selecting a subset of data.
- Creating Hierarchies: An index column can create hierarchical structures like product categories or regions.
Another benefit of adding an index column in Power BI with DAX is that it can improve the performance of your report. By creating an index column, you can reduce the number of calculations that need to be performed on your data, speeding up the processing time.
Steps to Create an Index Column in Power BI with DAX
You can use the Index Column function if you need a numeric column that shows the row number. In this function, you can define if the numbering should start at 0, 1, or a custom-defined number.
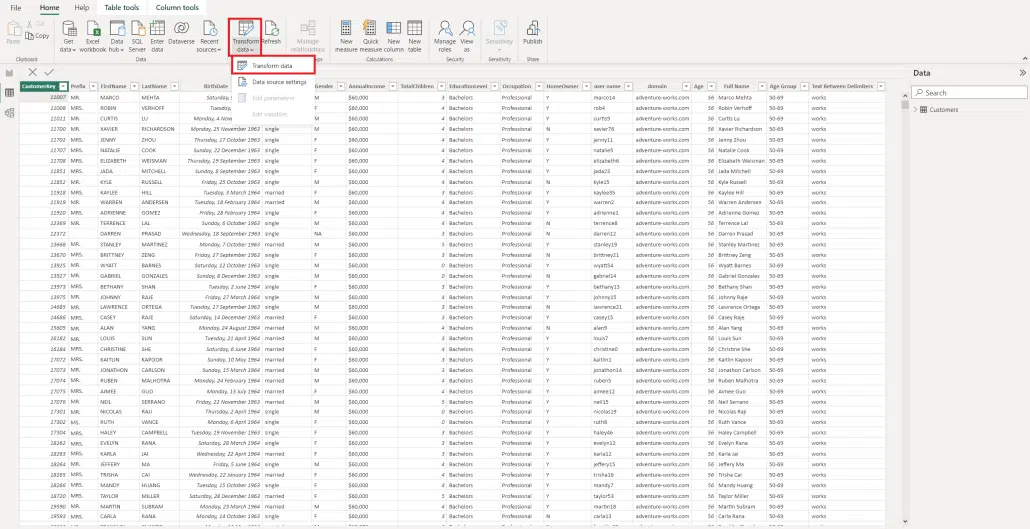
1. After you have loaded your data to Power BI, go to Home Tab and select Transform Data. This will open the Power Query editor:
2. To add an index column starting with 1, go to the Add Column Tab and select Index Column > From 1
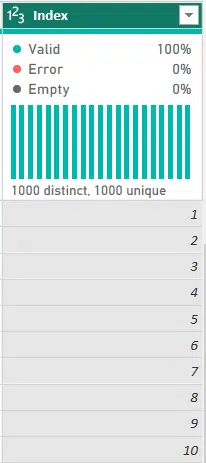
3. You now have a column showing the row number.
Another option with DAX measure:
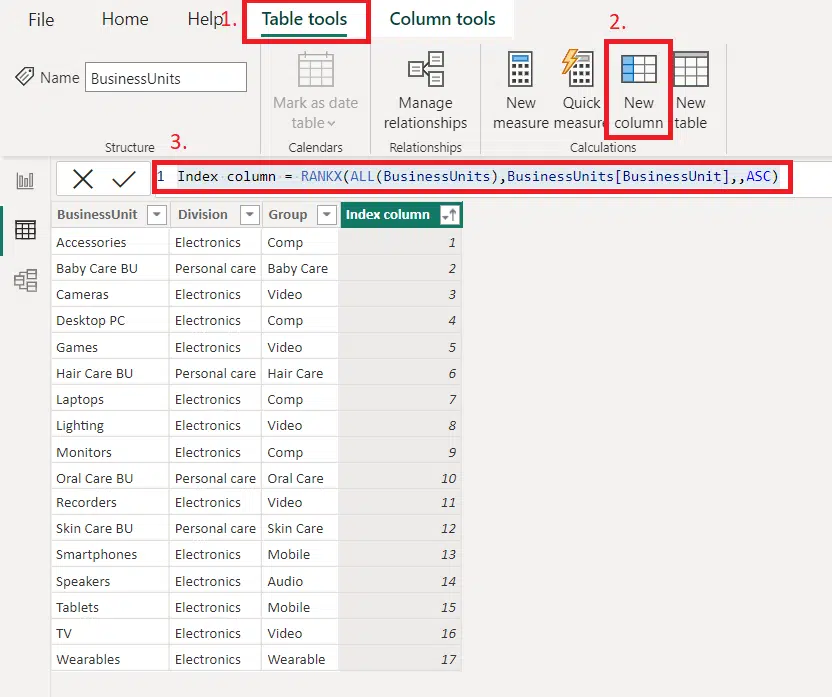
1. Go to Data View and select Table tools
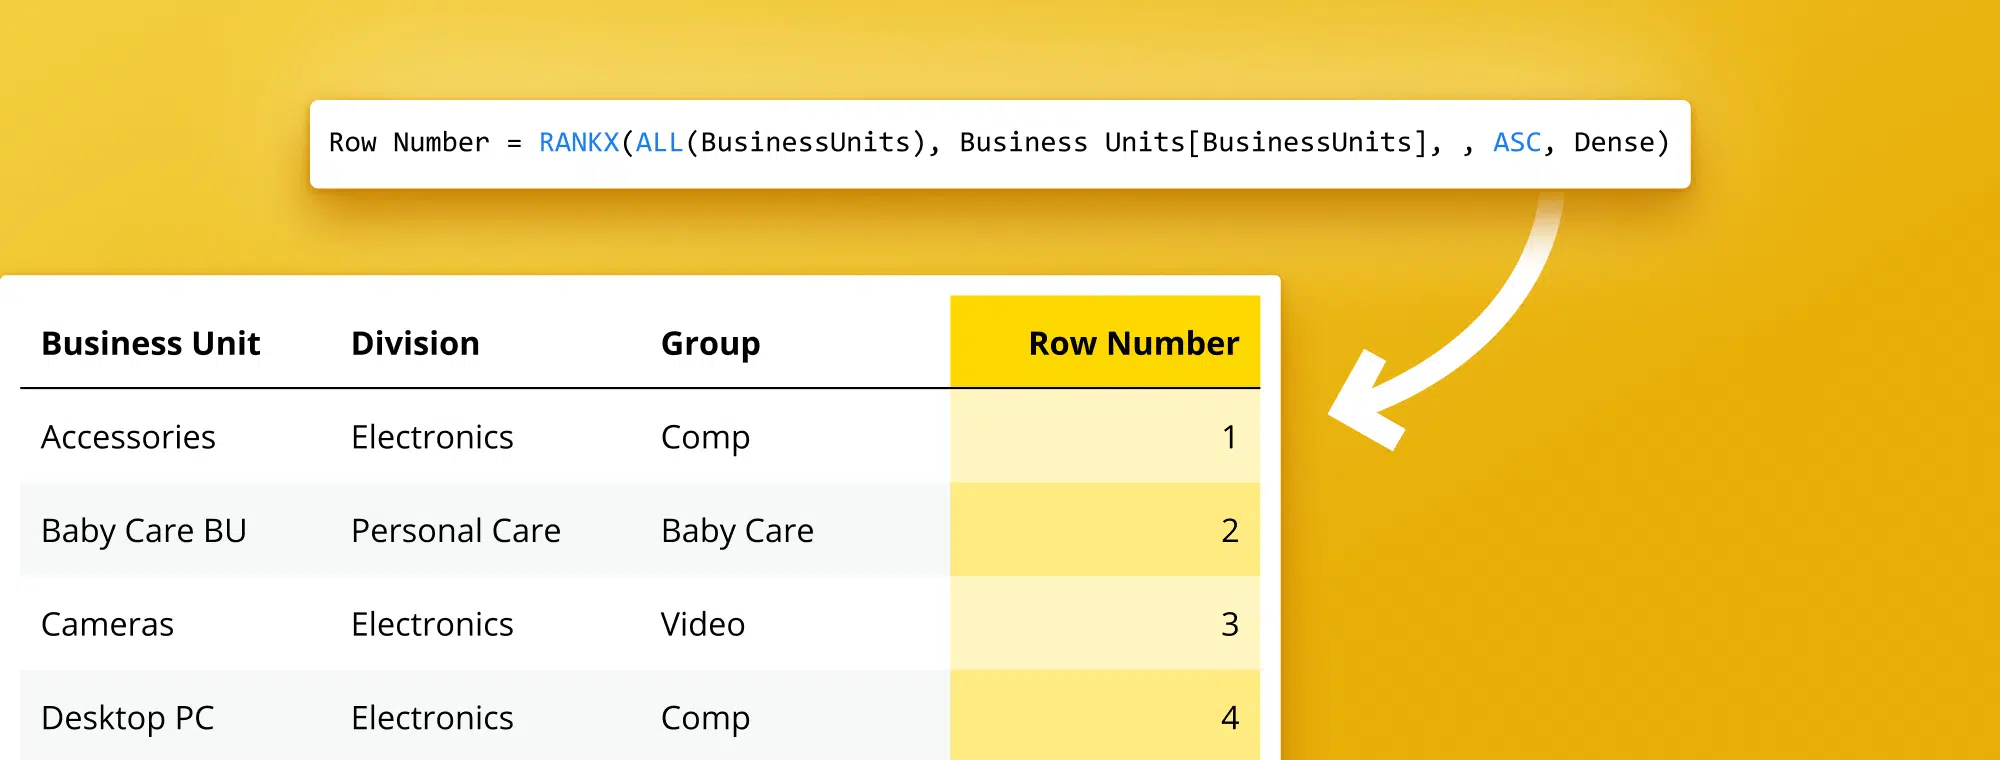
2. Select the New column
3. Add the formula Index column = RANKX(ALL(BusinessUnits),BusinessUnits[BusinessUnit],,ASC) in the Formula editor and press Enter.
Customizing the Index Column Format in Power BI
You can customize the format of the index column based on your preferences. Here's how:
- Open the Power BI Desktop and go to the Data View
- Select the table containing the index column.
- Click on the index column name to select it
- Go to the Column tools tab and choose from formatting options
It's important to note that the format you choose for the index column can affect the performance of your Power BI report. Selecting a format requiring a lot of memory or processing power may slow the report's performance.
Additionally, you can use the same steps to customize the format of other columns in your Power BI report. This can be useful if you want to change the way dates, numbers, or different types of data are displayed in your report.
Sorting Data Using the Index Column in Power BI
You can use the index column to sort data in ascending or descending order. Here's how:
- Open the Power BI Desktop and go to the Data view.
- Select the table containing the index column.
- Click on the index column name to select it.
- Go to the Column tools and choose Sort by Column.
- Select the index column from the list of columns.
It's important to note that sorting by the index column can be particularly useful when working with large datasets. This is because the index column is automatically generated by Power BI and is optimized for sorting and filtering data quickly. Additionally, you can use the index column to create custom sorting orders that are impossible with other columns in your dataset.
Filtering Data Using the Index Column in Power BI
You can use the index column to filter data based on a range of values. Here's how:
- Open the Power BI Desktop and go to the Report view.
- Select the visual that displays the data you want to filter.
- Go to the Filters pane on the right-hand side of your desktop view.
- From the Data pane, click and drag the index column to Filters (if it is not already there)
- Expand the Index column box in the Filter pane and enter the exact number or a range of numbers for filtering.
- The data will be filtered based on the index column.
It's important to note that the index column must be numeric to use the range filter. If the index column is not numeric, you can still filter the data using other filters, such as the basic or advanced filters.
Additionally, you can use the index column to sort the data in ascending or descending order. To do this, click on the index column name and select "Sort Ascending" or "Sort Descending" from the drop-down list. This can be useful to identify the highest or lowest values in your data.
Creating Hierarchies Using the Index Column in Power BI
You can use the index column to create hierarchical structures. Here's how:
- Open the Power BI Desktop and go to the Data view.
- In the Data pane on the right-hand side of your desktop view, right-click on the index column and select "Create Hierarchy."
- To add additional columns to the hierarchy, right-click the column and select Add to Hierarchy.
Limitations and Considerations for Using an Index Column in Power BI
Although the index column can be a valuable tool for data analysis, it has some limitations and considerations to keep in mind:
- Performance: Creating an index column can affect the performance of your report, especially for large datasets. Use it only when necessary.
- Unique Values: Each row's index column is unique, and duplicates are prohibited. If you have duplicate rows, the index column may not work correctly.
- Updates: The index column updates dynamically based on the row context, which may change if the data changes. Ensure to update the index column if the data is updated.
Tips and Tricks for Optimizing Performance with the Index Column in Power BI Dax
Here are some tips and tricks for optimizing performance when using the index column in Power BI:
- Use the index column only when necessary.
- Index only small segments of data that require sorting or filtering.
- Prepare your data (create index column) in Power Query to optimize your report performance.
- You can use your index column for sorting within your data visualization. For example, when you do not want to sort alphabetically or based on the highest/lowest number (read more: How to add a sorting column manually)
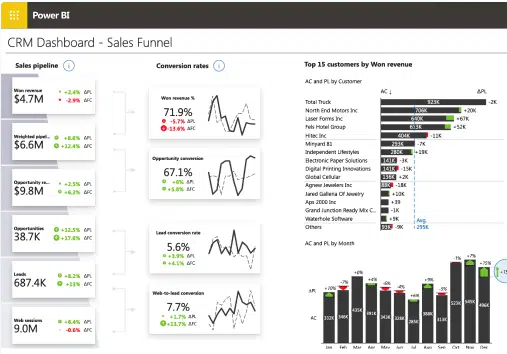
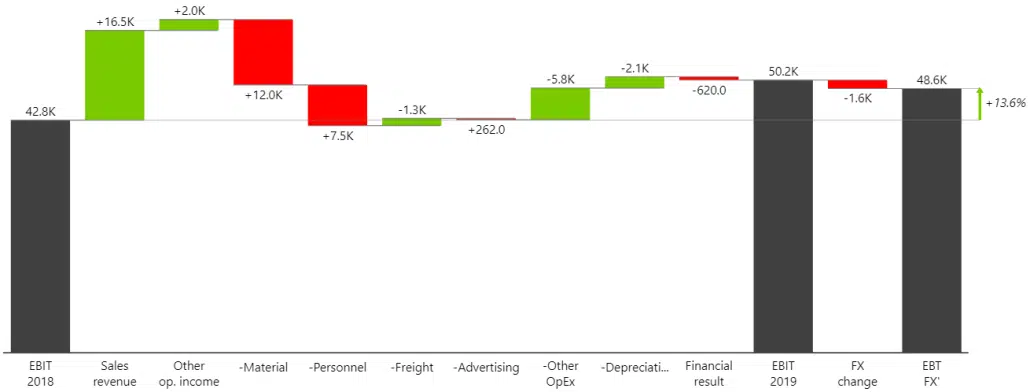
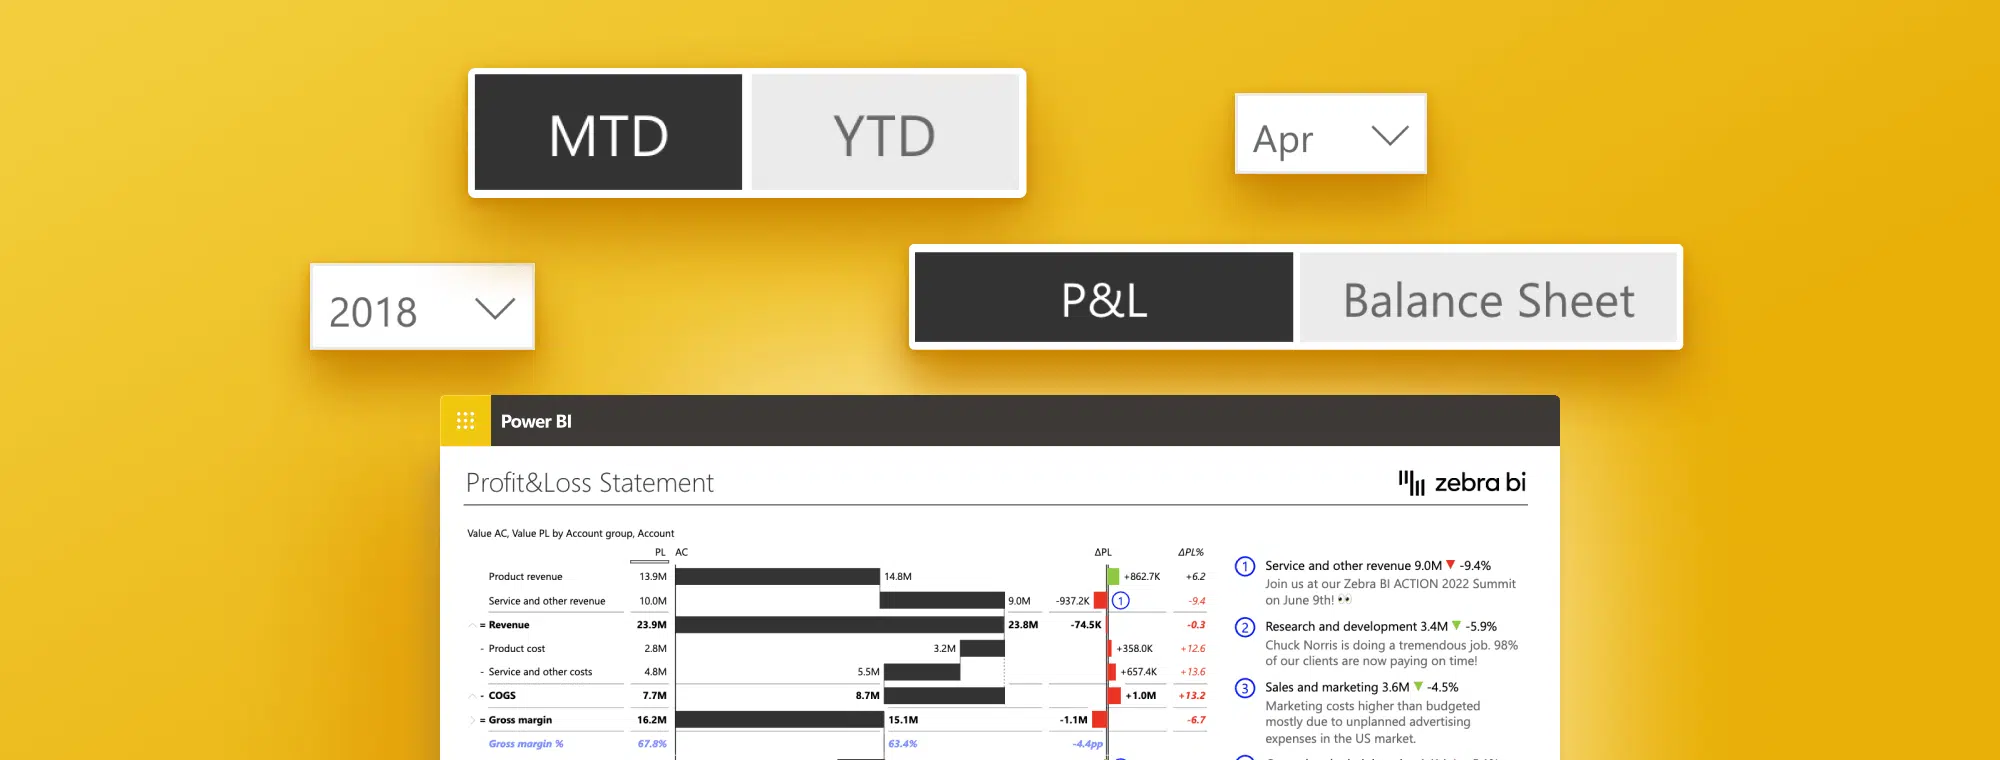
Use sorting my index column to build visuals like a waterfall chart:
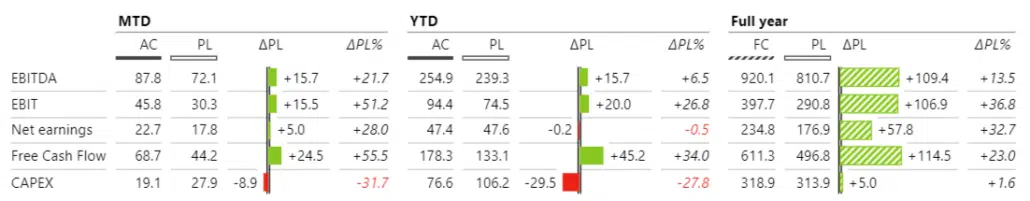
...or table with integrated charts with Zebra BI for Power BI:
Examples of Real-world Applications of the Index Column in Power BI with DAX
The index column in Power BI Dax can be used for various real-world applications, such as:
- Sorting data by date, time, or location
- Filtering data based on customer preferences or demographics
- Creating hierarchical structures based on organizational roles or company departments
In conclusion, an index column is an essential tool for data analysis in Power BI DAX. It allows you to sort, filter, and create hierarchies based on the sequenced column of integers. Follow the steps outlined in this article to create and customize your index column.
Remember to consider the limitations and performance impacts of the index column when using it in your report, and use tips and tricks to optimize performance. You can enhance your data analysis and create meaningful insights with the index column.
Create stunning reports in your favorite tool with just a few clicks!
Take your Power BI reports to the next level with Zebra BI's intuitive visualization tools.
Related Resources
Top 5 Power BI DAX tricks for super effective Power BI dashboards
Power BI: How to Insert Row Numbers in Table Visual
How to Add Filter Button in Power BI: 6 Key Steps for Better Analytics